

Changes in adiposity among children and adolescents in the United States, 1999-2006 to 2011-2018
- PMID: 34291279
- PMCID: PMC8645193
- DOI: 10.1093/ajcn/nqab237
Changes in adiposity among children and adolescents in the United States, 1999-2006 to 2011-2018
Abstract
Background: Data from the NHANES indicate that BMI has increased in some subgroups of children and adolescents in the United States over the past 20 y; however, BMI is an indirect measure of body fatness.
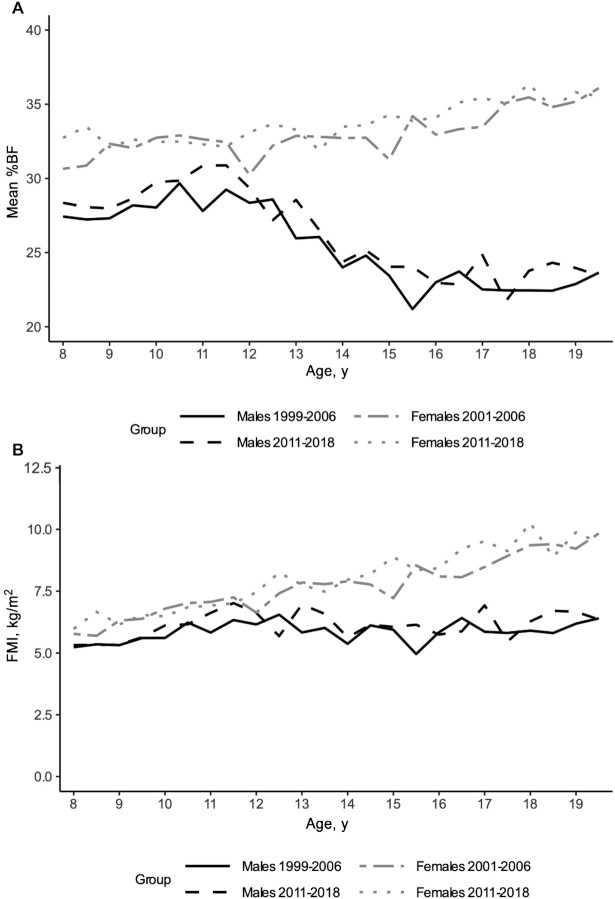
Objectives: We assessed changes in DXA-derived measures of adiposity in a nationally representative population of US children and adolescents aged 8-19 y from 1999-2006 to 2011-2018.
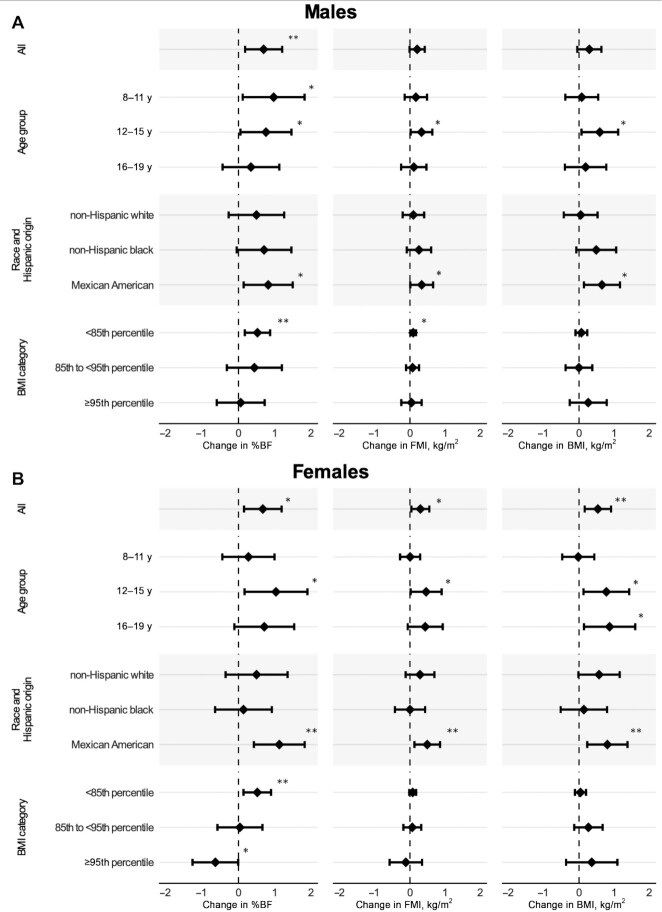
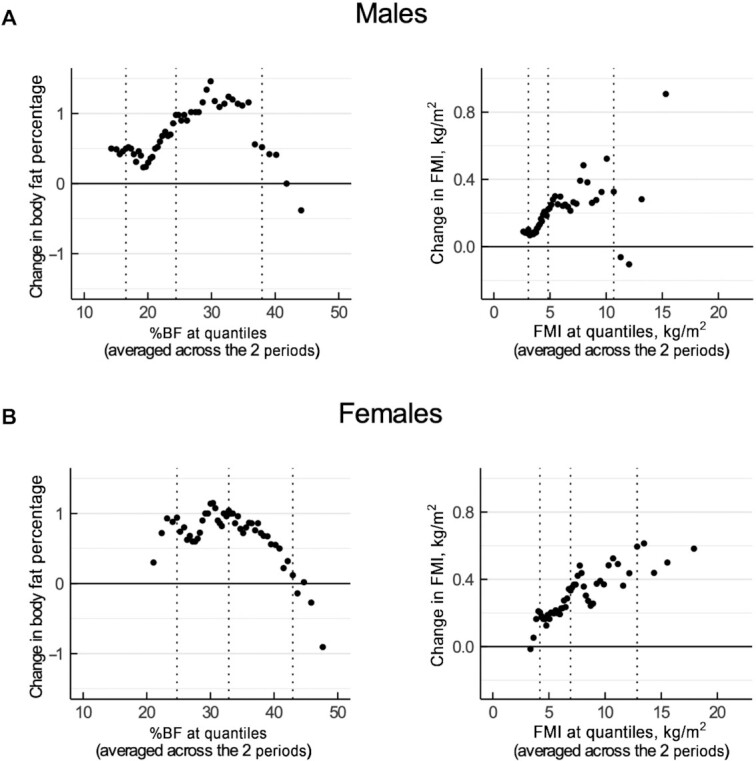
Methods: Using data from the NHANES, we compared the means and distributions of DXA-derived percentage body fat (%BF) and fat mass index (FMI; fat mass/height2 in kg/m2) between 1999-2006 (n = 10,231) and 2011-2018 (n = 6923) among males and females by age group, race and Hispanic origin, and BMI categories. Estimates were standardized by age and race and Hispanic origin.
Results: From 1999-2006 to 2011-2018, mean %BF increased from 25.6% to 26.3% (change in %BF: 0.7%; 95% CI: 0.2%, 1.2%; P < 0.01) among all males, whereas mean %BF increased from 33.0% to 33.7% (change in %BF: 0.7%; 95% CI: 0.2%, 1.2%; P = 0.01) and mean FMI increased from 7.7 to 8.0 fat mass kg/m2 (change in FMI: 0.3 fat mass kg/m2; 95% CI: 0.0, 0.6 fat mass kg/m2; P = 0.02) among all females. Changes were not consistent across all age, race and Hispanic origin, and BMI categories. Both %BF and FMI increased among Mexican-American children and adolescents, but not other race and Hispanic origin groups.
Conclusions: Among US children and adolescents, DXA-derived measures of adiposity increased from 1999-2006 to 2011-2018, albeit not consistently in every age, race and Hispanic origin, and BMI subgroup. These data reinforce the need to consider other measures, besides BMI categories, when studying adiposity in children and adolescents.
Keywords: DXA; NHANES; US children and adolescents; adiposity; body fatness; dual-energy X-ray absorptiometry; fat mass index; percentage body fat.
Published by Oxford University Press on behalf of the American Society for Nutrition 2021.
Figures
Comment in
-
Increases in adiposity among children and adolescents over time: Moving beyond BMI.Am J Clin Nutr. 2021 Oct 4;114(4):1275-1276. doi: 10.1093/ajcn/nqab265. Am J Clin Nutr. 2021. PMID: 34375399 Free PMC article. No abstract available.
References
-
- Barlow SE, Expert Committee. Expert Committee recommendations regarding the prevention, assessment, and treatment of child and adolescent overweight and obesity: summary report. Pediatrics. 2007;120(Supplement 4):S164–92. - PubMed
-
- CDC National Center for Chronic Disease Prevention and Health Promotion.. Defining childhood obesity. [Internet]. Atlanta (GA): CDC; [cited 2021 Feb 1]. Available from: https://www.cdc.gov/obesity/childhood/defining.html.
-
- Must A, Strauss RS. Risks and consequences of childhood and adolescent obesity. Int J Obes. 1999;23(S2):S2–S11. - PubMed
MeSH terms
Grants and funding
LinkOut - more resources
Full Text Sources
Other Literature Sources
Miscellaneous
