

Improving protein tertiary structure prediction by deep learning and distance prediction in CASP14
- PMID: 34291486
- PMCID: PMC8671168
- DOI: 10.1002/prot.26186
Improving protein tertiary structure prediction by deep learning and distance prediction in CASP14
Abstract
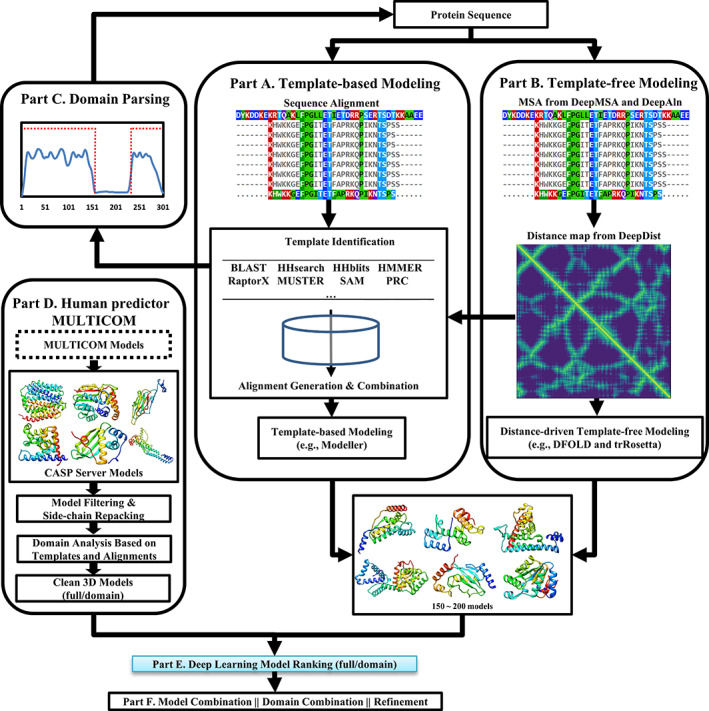
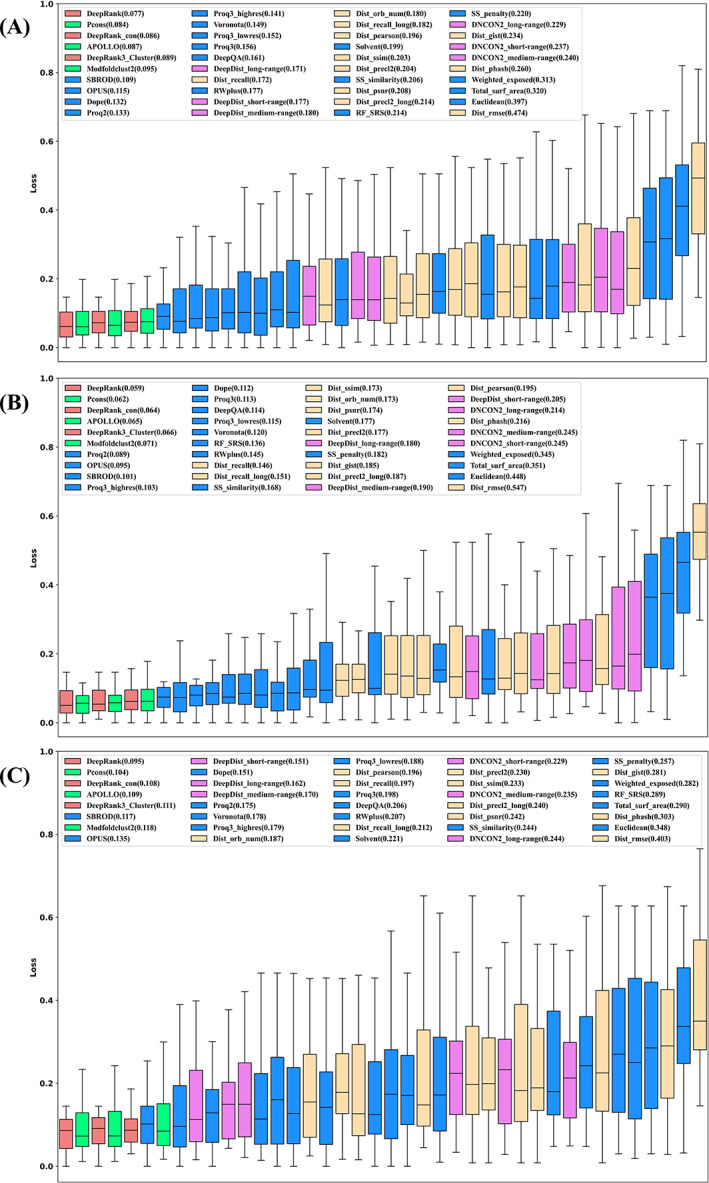
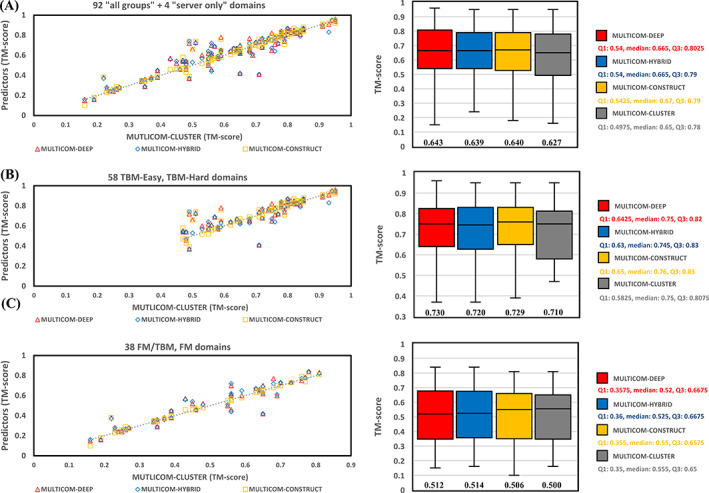
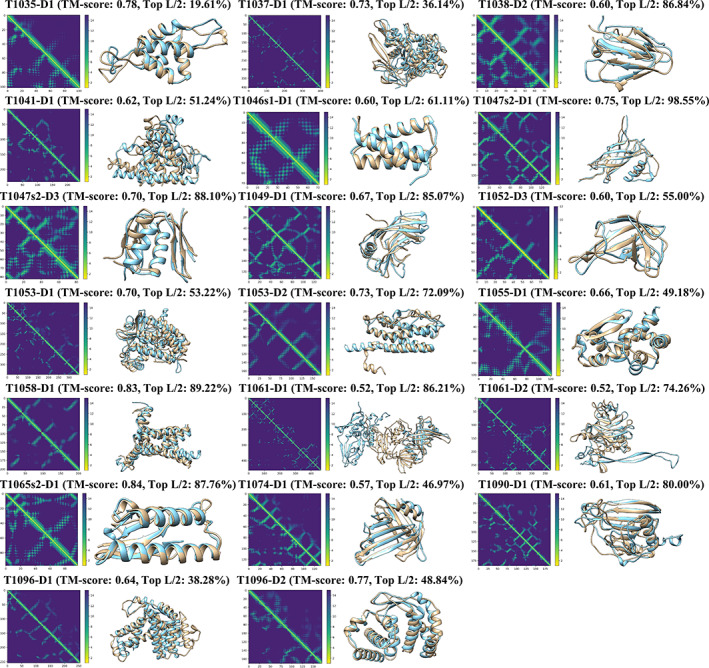
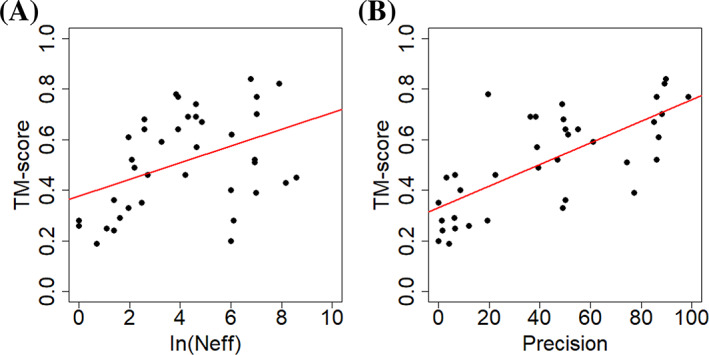
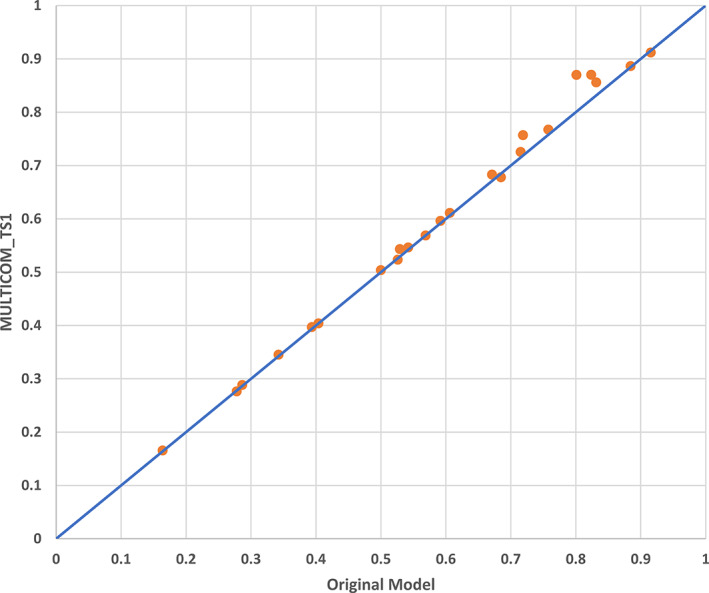
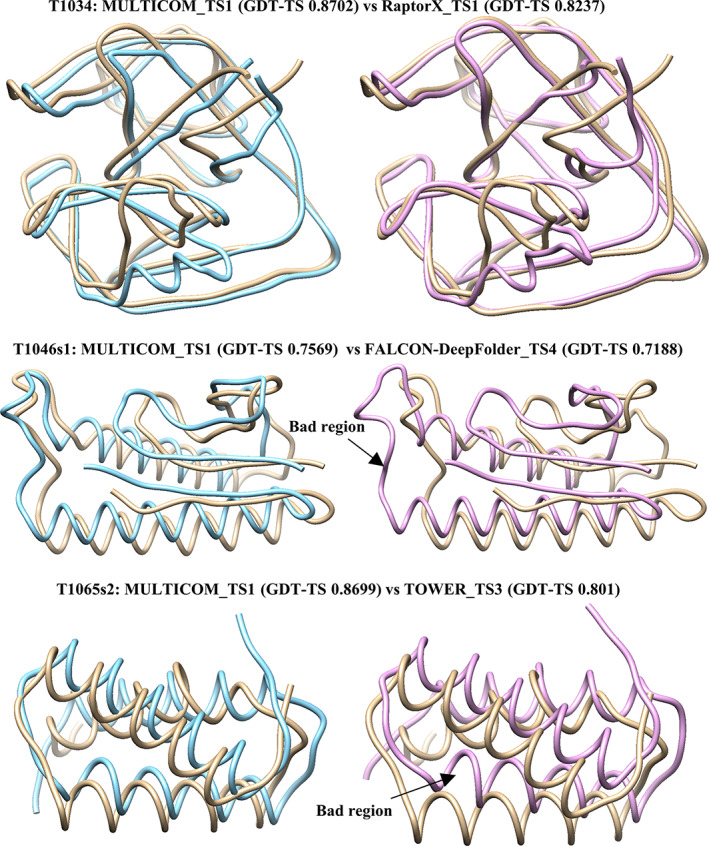
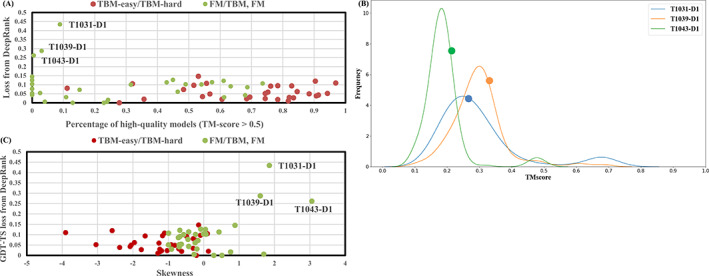
Substantial progresses in protein structure prediction have been made by utilizing deep-learning and residue-residue distance prediction since CASP13. Inspired by the advances, we improve our CASP14 MULTICOM protein structure prediction system by incorporating three new components: (a) a new deep learning-based protein inter-residue distance predictor to improve template-free (ab initio) tertiary structure prediction, (b) an enhanced template-based tertiary structure prediction method, and (c) distance-based model quality assessment methods empowered by deep learning. In the 2020 CASP14 experiment, MULTICOM predictor was ranked seventh out of 146 predictors in tertiary structure prediction and ranked third out of 136 predictors in inter-domain structure prediction. The results demonstrate that the template-free modeling based on deep learning and residue-residue distance prediction can predict the correct topology for almost all template-based modeling targets and a majority of hard targets (template-free targets or targets whose templates cannot be recognized), which is a significant improvement over the CASP13 MULTICOM predictor. Moreover, the template-free modeling performs better than the template-based modeling on not only hard targets but also the targets that have homologous templates. The performance of the template-free modeling largely depends on the accuracy of distance prediction closely related to the quality of multiple sequence alignments. The structural model quality assessment works well on targets for which enough good models can be predicted, but it may perform poorly when only a few good models are predicted for a hard target and the distribution of model quality scores is highly skewed. MULTICOM is available at https://github.com/jianlin-cheng/MULTICOM_Human_CASP14/tree/CASP14_DeepRank3 and https://github.com/multicom-toolbox/multicom/tree/multicom_v2.0.
Keywords: inter-residue distance prediction; protein quality assessment; protein structure prediction.
© 2021 The Authors. Proteins: Structure, Function, and Bioinformatics published by Wiley Periodicals LLC.
Figures
Similar articles
-
MULTICOM2 open-source protein structure prediction system powered by deep learning and distance prediction.Sci Rep. 2021 Jun 23;11(1):13155. doi: 10.1038/s41598-021-92395-6. Sci Rep. 2021. PMID: 34162922 Free PMC article.
-
Protein tertiary structure modeling driven by deep learning and contact distance prediction in CASP13.Proteins. 2019 Dec;87(12):1165-1178. doi: 10.1002/prot.25697. Epub 2019 Apr 25. Proteins. 2019. PMID: 30985027 Free PMC article.
-
Improving deep learning-based protein distance prediction in CASP14.Bioinformatics. 2021 Oct 11;37(19):3190-3196. doi: 10.1093/bioinformatics/btab355. Bioinformatics. 2021. PMID: 33961009 Free PMC article.
-
Toward the solution of the protein structure prediction problem.J Biol Chem. 2021 Jul;297(1):100870. doi: 10.1016/j.jbc.2021.100870. Epub 2021 Jun 11. J Biol Chem. 2021. PMID: 34119522 Free PMC article. Review.
-
Recent Progress of Protein Tertiary Structure Prediction.Molecules. 2024 Feb 13;29(4):832. doi: 10.3390/molecules29040832. Molecules. 2024. PMID: 38398585 Free PMC article. Review.
Cited by
-
Deep Learning for Genomics: From Early Neural Nets to Modern Large Language Models.Int J Mol Sci. 2023 Nov 1;24(21):15858. doi: 10.3390/ijms242115858. Int J Mol Sci. 2023. PMID: 37958843 Free PMC article. Review.
-
Hierarchical deep learning for predicting GO annotations by integrating protein knowledge.Bioinformatics. 2022 Sep 30;38(19):4488-4496. doi: 10.1093/bioinformatics/btac536. Bioinformatics. 2022. PMID: 35929781 Free PMC article.
-
Distance-based reconstruction of protein quaternary structures from inter-chain contacts.Proteins. 2022 Mar;90(3):720-731. doi: 10.1002/prot.26269. Epub 2021 Nov 2. Proteins. 2022. PMID: 34716620 Free PMC article.
-
Homology Modelling, Molecular Docking and Molecular Dynamics Simulation Studies of CALMH1 against Secondary Metabolites of Bauhinia variegata to Treat Alzheimer's Disease.Brain Sci. 2022 Jun 12;12(6):770. doi: 10.3390/brainsci12060770. Brain Sci. 2022. PMID: 35741655 Free PMC article.
-
Improving AlphaFold2-based protein tertiary structure prediction with MULTICOM in CASP15.Commun Chem. 2023 Sep 7;6(1):188. doi: 10.1038/s42004-023-00991-6. Commun Chem. 2023. PMID: 37679431 Free PMC article.
References
Publication types
MeSH terms
Substances
Grants and funding
LinkOut - more resources
Full Text Sources
