Loss of PIKfyve drives the spongiform degeneration in prion diseases
- PMID: 34291577
- PMCID: PMC8518562
- DOI: 10.15252/emmm.202114714
Loss of PIKfyve drives the spongiform degeneration in prion diseases
Abstract
Brain-matter vacuolation is a defining trait of all prion diseases, yet its cause is unknown. Here, we report that prion infection and prion-mimetic antibodies deplete the phosphoinositide kinase PIKfyve-which controls endolysosomal maturation-from mouse brains, cultured cells, organotypic brain slices, and brains of Creutzfeldt-Jakob disease victims. We found that PIKfyve is acylated by the acyltransferases zDHHC9 and zDHHC21, whose juxtavesicular topology is disturbed by prion infection, resulting in PIKfyve deacylation and rapid degradation, as well as endolysosomal hypertrophy and activation of TFEB-dependent lysosomal enzymes. A protracted unfolded protein response (UPR), typical of prion diseases, also induced PIKfyve deacylation and degradation. Conversely, UPR antagonists restored PIKfyve levels in prion-infected cells. Overexpression of zDHHC9 and zDHHC21, administration of the antiprion polythiophene LIN5044, or supplementation with the PIKfyve reaction product PI(3,5)P2 suppressed prion-induced vacuolation and restored lysosomal homeostasis. Thus, PIKfyve emerges as a central mediator of vacuolation and neurotoxicity in prion diseases.
Keywords: neurodegeneration; palmitoylation; prion; spongiosis; unfolded protein response.
© 2021 The Authors. Published under the terms of the CC BY 4.0 license.
Conflict of interest statement
The authors declare that they have no conflict of interest.
Figures

- A
Conspicuous downregulation of PIKfyve, but not FIG4 or VAC14, in brain lysates of terminally sick mice intracerebrally inoculated with prions (RML). Control: Mice inoculated with non‐infectious brain homogenate (NBH). Right: Quantification of immunoblot. Each dot represents one mouse. ***P < 0.001; unpaired t‐test. Error bars represent s.e.m.
- B
PIKfyve is selectively downregulated in mice infected with ME7 prions. Right: Quantification. Each dot represents one individual (n = 4/group). ***P < 0.001; unpaired t‐test. Error bars represent s.e.m.
- C
Time course of PIKfyve downregulation in brains of prion‐infected mice (three mice/time point). PIKfyve (but not FIG4, Calnexin, NeuN, and synaptophysin) was suppressed between 60 and 120 dpi. T: terminal disease stage.
- D
The PIKfyve/FIG4 ratio gradually decreased in prion‐infected mice (unpaired t‐test). **P < 0.01; ***P < 0.001. Each dot represents one mouse.
- E
Prion‐infected Gt1 cells (75 dpi) stained with Alexa‐Fluor 647‐succinimidyl ester which stains vacuoles negatively (arrows).
- F
Loss of PIKfyve, but not FIG4 and VAC14, in prion‐infected Gt1 cells. Right: Quantification of immunoblots. Each dot represents an independent experiment. **P < 0.01; unpaired t‐test. Error bars represent s.e.m.
- G
tga20 COCS were treated with pooled IgG or POM1 (72 h). POM1 suppressed PIKfyve but not FIG4 and VAC14. Right: Quantification of immunoblots. Each dot represents an independent experiment. **P < 0.01; ***P < 0.001; unpaired t‐test. Error bars represent s.e.m.
- H
Immunoblots of human CJD brains (red: sampled region). Gt1Sc: prion‐infected Gt1 cells. Loading controls: actin and Calnexin (Cnx).
- I
Quantification of immunoblots revealed moderate and substantial PIKfyve loss in type 1 and type 2 CJD, respectively (unpaired t‐test). **P < 0.01; ***P < 0.001. Error bars represent s.e.m.
- J
Brain homogenates from panel C were immunoprecipitated with anti‐VAC14 antibodies. FIG4 and PIKfyve did not co‐precipitate in prion‐infected brains at terminal disease.

- A
Time course of eIF2α and PERK phosphorylation in prion‐inoculated C57BL/6 mice. T: terminal disease.
- B
PIKfyve/eIF2α and eIF2α(P)/eIF2α ratios assessed from Western blots as in A (n = 3/group/time point). PIKfyve levels gradually decreased after 60 dpi whereas eIF2α became phosphorylated from 30 dpi until terminal disease. eIF2α phosphorylation and pPIKfyve depletion in POM1‐treated tga20 COCS. **P < 0.01; ***P < 0.001; unpaired t‐test; error bars represent s.e.m.
- C
Treatment of COCS with POM1 reduces the levels of PIKfyve starting 48 h post‐treatment. Each dot represents an individual experiment. Statistics: Unpaired t‐test. **P < 0.01.
- D
Transient PIKfyve suppression in thapsigargin‐treated Gt1 cells with recovery after 6 h. PERK phosphorylation confirmed ER stress.
- E
Gt1 cells were inoculated with NBH or prions (60 dpi), pulsed with [35S]Met/Cys (20 min, 37°C), and immediately lysed or chased without 35S (37°C, ≤3 h). For control, cells were treated with scrambled siRNA or siRNA against PIKfyve. Proteins were immunoprecipitated with antibodies to PIKfyve and subjected to SDS–PAGE and autoradiography (n = 3 individual biological replicates).
- F
Autoradiographic signals expressed as percentage of the initial PIKfyve levels. Prion infection shortened the half‐life of PIKfyve from 144 to 52 min. First‐order kinetics was assumed. Error bars represent s.e.m and were calculated based on three individual biological replicates.
- G
Left: partially restored PIKfyve levels in prion‐infected tga20 mice treated with LIN5044 (LCP) or vehicle. Right: quantification of the Western blot. Each dot represents an individual biological replicate. *P: 0.05; unpaired t‐test. Error bars represent s.e.m.
- H
Left, tga20 COCS were inoculated with RML or NBH, optionally treated with GSK2606414 starting at 21 dpi, and lysed at 35 dpi. Depletion of PIKfyve in prion‐infected samples was largely rescued by GSK2606414 (GSK). Right, quantification of Western blot. Each dot represents an individual biological replicate. Statistics: Unpaired t‐test. **P < 0.01; unpaired t‐test; error bars represent s.e.m.

- A
Acyl‐rac captured hydroxylamine‐cleavable, acylate PIKfyve from mouse brains. Control: TRAPα, a non‐acylated protein. Input: 10% of lysate.
- B
Brain lysates from prion‐inoculated mice (60 dpi) precipitated by Acyl‐rac. PIKfyve, but not Calnexin (Cnx), was deacylated in prion‐infected samples. Each lane represents an individual mouse. Lower panel: lysate used for Acyl‐rac.
- C
Autoradiography of Gt1 cells transfected with PIKfyve‐GFP or PIKfyveΔacyl (24 h), metabolically labeled with 3H‐palmitate (2 h), and immunoprecipitated with anti‐GFP antibodies. Lower panel: Western blot on immunoprecipitates using anti‐GFP antibodies. Error bars represent s.e.m. (n = 3 individual biological replicates).
- D
Gt1 cells transiently expressing PIKfyve‐GFP or PIKfyveΔAcyl (24 h) were subjected to a [35S]Met/Cys pulse (20 min, 37°C) and immediately lysed or chased (60 min). Proteins were immunoprecipitated with anti‐GFP antibody and subjected to SDS–PAGE and autoradiography. Lysates from cells treated with siRNA against PIKfyve were also pulsed and immunoprecipitated and subjected to autoradiography to ensure correct band is detected. Error bars represent s.e.m. (n = 3 individual biological replicates).
- E, F
Acyl‐rac of Gt1 cells subjected to siRNA against zDHHC9, zDHHC21, or both (72 h post‐transfection), showing synergistic decrease of PIKfyve acylation by suppression of zDHHC9 and 21 (quantified in F). Each dot represents a separate experiment (unpaired t‐test). **P < 0.01. Error bars represent s.e.m.
- G
Gt1 cells were transfected with siRNA against zDHHC9+21 and stained with LAMP1. Arrows: vacuoles.
- H, I
Flag‐tagged zDHHC9 or zDHHC21 expressed in Gt1 cells were transfected with plasmids encoding. After 72 h, zDHHC9/21 (magenta) were localized to the Golgi apparatus (GM130+, cyan) in NBH‐exposed cells but not in prion‐infected cells. n = 3 individual biological replicates.

- A
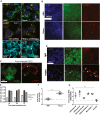
Upper row: prion‐infected Gt1 cells (75 dpi) immunostained for LAMP1 showing prominent vacuoles. Control: NBH‐inoculated cells. Middle row: Gt1 cells transfected with shRNA targeting PIKfyve or luciferase (control) for 5 days and immunostained for LAMP1. Depletion of PIKfyve resulted in LAMP1+ vacuoles (yellow). DAPI: nuclear stain. Lower row: prion‐infected and NBH‐treated cells (75 dpi) contained LAMP2‐ vacuoles. n = 3 individual biological replicates.
- B
Prion‐infected tga20 COCS (45 dpi) immunostained with NeuN and LAMP1. Control: NBH‐exposed COCS. Nuclei: DAPI. Prion infection induced LAMP1 upregulation in neurons (quantification: Appendix Fig S4A; n = 3 individual biological replicates).
- C
Higher magnification showing LAMP1+ vacuoles (arrowheads) in prion‐infected COCS.
- D
tga20 COCS treated with POM1 or control IgG (10 days) and immunostained with NeuN and LAMP1. Nuclei: DAPI. POM1‐treated COCS showed increased LAMP1 expression (quantification: Appendix Fig S4B). NeuN+ cells exhibited vacuoles (arrowheads).
- E
Gt1 cells were transfected with control siRNA (scrambled) or siRNA targeting PIKfyve for up to 72 h and stained with LysoSensor Yellow/Blue. Cells were gated based on emission spectra, and mean fluorescence intensities (MFIs) per sample were quantified. Increased 530/450 MFI ratio indicates enrichment of acidic compartments. No acidic compartment expansion in PIKfyve‐depleted cells. n = 4 individual biological replicates. Error bars represent s.e.m.
- F
β‐Hexosaminidase A activity in brain lysates from terminally scrapie‐sick and NBH‐inoculated mice. Control: NBH‐inoculated mice. Prion‐infected brain lysates showed 2‐ to 2.5‐fold increased activity. Panels show independent triplicates. Statistics: unpaired t‐test. **P < 0.01. Error bars represent s.e.m.
- G
Lysosomal enzymes, but not β‐actin, were elevated in brains of terminally scrapie‐sick mice. Panels show independent triplicates. Statistics: ANOVA. **P < 0.01. Error bars represent s.e.m.

- A
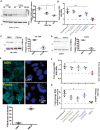
Time course of TFEB phosphorylation in prion‐infected C57BL/6 mice. Total TFEB was unchanged but reduced TFEB phosphorylation was evident at ≥ 90 days. Quantification: Each dot represents an individual biological replicate. Statistics: Unpaired t‐test. *P: 0.05; **P < 0.01. Error bars represent s.e.m.
- B
TFEB‐controlled transcripts in brains of terminally scrapie‐sick C57BL/6 mice were measured by qPCR. Prion infection led to upregulation of these genes, but not of STAT3. Control: NBH‐inoculated mice. ANOVA on independent triplicates. ***P < 0.001. Error bars represent s.e.m.
- C
Prion‐infected Gt1 cells (75 dpi) showed reduced TFEB phosphorylation. Total levels of TFEB remain unchanged. Quantification: Each dot represents an individual biological replicate. Statistics: Unpaired t‐test. **P < 0.01. Error bars represent s.e.m.
- D
COCS prepared from tga20 mice were infected with RML prions and cultured for 5 weeks. Cell lysates were prepared at 4 wpi followed by Western blot analysis using anti‐phospho‐TFEB antibody. Activated (dephosphorylated) TFEB was increased in RML‐infected COCS. Total levels of TFEB remain unchanged. Quantification: Each dot represents an individual biological replicate. Statistics: Unpaired t‐test. Error bars represent s.e.m.
- E
Gt1 cells (as in D) were fixed and stained with anti‐TFEB antibody. Prion‐infected cells showed nuclear translocation of TFEB. DAPI: Blue. Quantification: Each dot represents an individual biological replicate (30 images were quantified per replicate). Statistics: Unpaired t‐test. **P < 0.01. Error bars represent s.e.m.
- F
TFEB‐responsive genes were upregulated in Gt1 cells chronically infected with RML prions (75 dpi). Panels depict independent triplicates. Statistics: ANOVA. *P: 0.05. Error bars represent s.e.m.
- G
TFEB‐responsive genes were upregulated in cells transfected with shPIKfyve for 5 days compared with shCtrl (shRNA against luciferase). Panels depict independent triplicates. Statistics: ANOVA. *P: 0.05. Error bars represent s.e.m.

- A
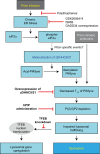
Transient overexpression of Flag‐tagged zDHHC9 + 21 (72 h) restored PIKfyve levels in prion‐infected Gt1 cells. Right: Western blot quantification. Each dot represents an individual experiment (unpaired t‐test). **P < 0.01. Error bars represent s.e.m.
- B
Cotransfection of zDHHC9 + 21 reduced vacuolation in prion‐infected Gt1 cells. Each dot represents a separate experiment (1,000 cells/experiment, χ2: P < 0.001). **P < 0.01; unpaired t‐test. Error bars represent s.e.m.
- C
Prion‐infected Gt1 cells were lentivirally transduced with GADD34 at 75 dpi. Control: empty lentiviral vector. At 79 dpi, GADD34 overexpression had normalized eIF2α phosphorylation and restored PIKfyve levels. Right: Quantification of Western blots (n = 3; unpaired t‐test). Each dot represents an individual experiment. **P < 0.01. Error bars represent s.e.m.
- D
Number of vacuolated cells from the experiment shown in C. GADD34 expression rescued the total number of vacuolated cells (1,000 cells/experiment, χ2: P < 0.001). Each dot represents an individual experiment. **P < 0.01. Error bars represent s.e.m.
- E
tga20 COCS were infected with RML and optionally treated with bPIP (5 µg/ml). At 45 dpi, NeuN morphometry revealed ablation of cerebellar granule layer (CGN) in prion‐infected slices and its rescue by bPIP. Control: NBH‐treated COCS. Each dot represents an individual slice (Statistics: ANOVA). *P < 0.05. ****P < 0.0001.
- F
tga20 COCS were treated with POM1 (optionally pre‐blocked with recPrP) and treated with bPIP (5 µg/ml). At 14 dpi, NeuN morphometry revealed POM1‐induced ablation of cerebellar granule layer (CGL) and rescue by bPIP.
- G
Prion‐infected Gt1 cells were treated with bPIP for 3 days. The number of vacuolated cells was reduced (1,000 cells/experiment, χ2: P < 0.001); Statistics: Chi‐square test. Each dot represents an individual experiment. **P < 0.01. Error bars represent s.e.m.

References
-
- Aguzzi A, Sigurdson C, Heikenwaelder M (2008) Molecular mechanisms of prion pathogenesis. Annu Rev Pathol 3: 11–40 - PubMed
-
- Brandner S, Isenmann S, Raeber A, Fischer M, Sailer A, Kobayashi Y, Marino S, Weissmann C, Aguzzi A (1996) Normal host prion protein necessary for scrapie‐induced neurotoxicity. Nature 379: 339–343 - PubMed
-
- Bueler H, Aguzzi A, Sailer A, Greiner RA, Autenried P, Aguet M, Weissmann C (1993) Mice devoid of PrP are resistant to scrapie. Cell 73: 1339–1347 - PubMed
Publication types
MeSH terms
Substances
LinkOut - more resources
Full Text Sources
Molecular Biology Databases
Research Materials
Miscellaneous

