

Fragmentation patterns and personalized sequencing of cell-free DNA in urine and plasma of glioma patients
- PMID: 34291583
- PMCID: PMC8350897
- DOI: 10.15252/emmm.202012881
Fragmentation patterns and personalized sequencing of cell-free DNA in urine and plasma of glioma patients
Abstract
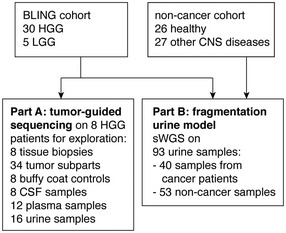
Glioma-derived cell-free DNA (cfDNA) is challenging to detect using liquid biopsy because quantities in body fluids are low. We determined the glioma-derived DNA fraction in cerebrospinal fluid (CSF), plasma, and urine samples from patients using sequencing of personalized capture panels guided by analysis of matched tumor biopsies. By sequencing cfDNA across thousands of mutations, identified individually in each patient's tumor, we detected tumor-derived DNA in the majority of CSF (7/8), plasma (10/12), and urine samples (10/16), with a median tumor fraction of 6.4 × 10⁻³ , 3.1 × 10⁻⁵ , and 4.7 × 10⁻⁵ , respectively. We identified a shift in the size distribution of tumor-derived cfDNA fragments in these body fluids. We further analyzed cfDNA fragment sizes using whole-genome sequencing, in urine samples from 35 glioma patients, 27 individuals with non-malignant brain disorders, and 26 healthy individuals. cfDNA in urine of glioma patients was significantly more fragmented compared to urine from patients with non-malignant brain disorders (P = 1.7 × 10⁻² ) and healthy individuals (P = 5.2 × 10⁻⁹ ). Machine learning models integrating fragment length could differentiate urine samples from glioma patients (AUC = 0.80-0.91) suggesting possibilities for truly non-invasive cancer detection.
Keywords: cell-free DNA; circulating tumor DNA; fragmentomics; gliomas; liquid biopsy.
© 2021 The Authors. Published under the terms of the CC BY 4.0 license.
Conflict of interest statement
N.R. and D.G. are co‐founders, present/former officers or consultants and/or shareholders of Inivata Ltd, a cancer genomics company that commercializes circulating DNA analysis. C.G.S. has consulted for Inivata Ltd. Inivata had no role in the conception, design, data collection, and analysis of the study. Patent applications may be filed describing additional methods described in the manuscript. Other co‐authors have no conflict of interests.
Figures
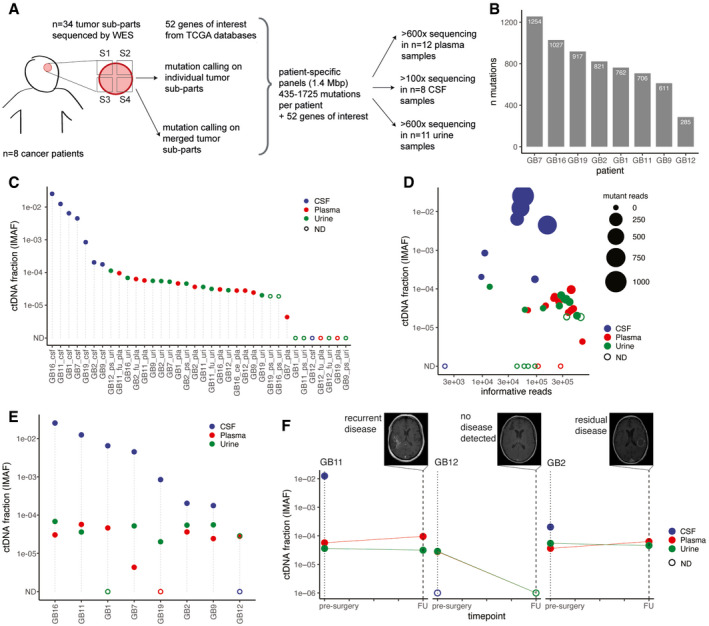
Schematic of ctDNA detection in matched CSF, plasma, and urine samples from glioma patients using INVAR (INtegration of VAriants Reads). Depth of sequencing indicated is the mean across the samples analyzed. S1 to S4 indicate tumor subparts.
Number of tumor tissue DNA mutations passing INVAR filters for the eight patients included.
Estimated ctDNA fractions for the plasma (10/12 detected), CSF (7/8 detected), and urine samples (10/16 detected) collected from 7 patients with primary glioblastoma and one patient (GB12) with anaplastic oligodendroglioma. The ctDNA fraction is expressed as IMAF (Integrated Mutant Allele Fraction). Detected cases are indicated by full circle and non‐detected cases as an open circle. ND: non‐detected.
Estimated tumor DNA DNA fraction (IMAF) in CSF, plasma, and urine depending on the number of mutant reads detected for each samples included and number of informative reads supporting the observation. Detected cases are indicated by full circle and non‐detected cases as an open circle. ND: non‐detected.
Estimated tumor DNA fractions (IMAF) in CSF, plasma, and urine for the matched samples collected at baseline pre‐surgery. Detected cases are indicated by full circle and non‐detected cases as an open circle. ND: non‐detected.
IMAF for the CSF, plasma, and urine of the patients with samples collected at 6‐month follow‐up (n = 3). Matched MRI scans are added for annotation.
- A
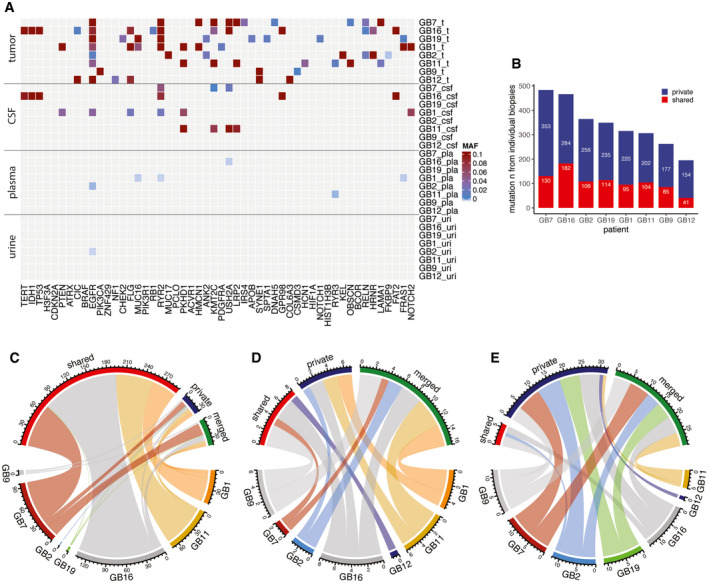
Mutant allele fraction (MAF) measured in tumor, CSF, plasma, and urine samples (on the y axis) for the detected mutations, in the 52 genes that are most frequently mutated in gliomas based on the TCGA databases (on the x‐axis), for the eight patients analyzed by targeted sequencing panels. MAF from tumor is derived from exome sequencing. MAF from CSF, plasma, and urine samples are derived from the capture panels sequencing.
- B
Number of mutations detected in tumor samples that were observed across several individual tumor biopsies (shared) or private to an individual biopsy.
- C–E
Comparison of the number of mutations that were detected in multiple tumor tissue subparts (red), that were private to an individual subpart (blue), or that were rescued by merged calling (green) in CSF (C), plasma (D), and urine (E). Data are shown for samples collected immediately prior to surgery across all eight patients.
- A–C
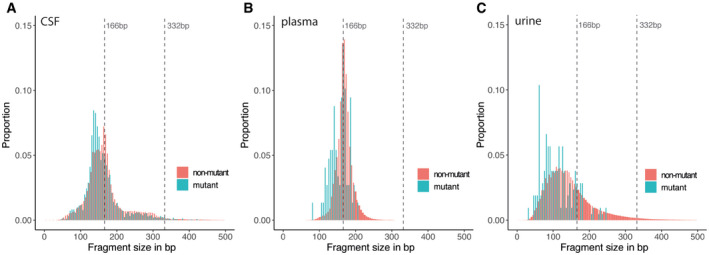
Fragment size distributions for mutant (blue) and non‐mutant (red) cfDNA reads, determined from the capture sequencing data for CSF samples (A), plasma samples, (B) and urine samples (C).
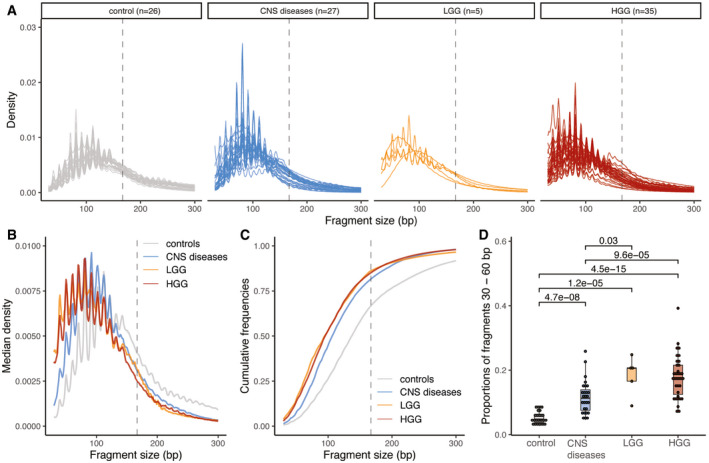
Size distribution of urine cfDNA fragments determined from paired‐end sWGS (< 1× coverage) of 26 healthy controls (in gray), 27 patients with other CNS diseases (cerebral aneurysm, and myeloneuropathy, in blue), five patients with LGG (in orange), and 30 HGG patients (35 samples, in red). Samples from LGG and HGG patients were collected at baseline.
Median size distribution of urine cfDNA fragments determined from paired‐end sWGS (< 1× coverage) for the different patients included in this study (median for each of the groups in part A).
Median of the cumulative distribution function of the urine cfDNA fragment sizes of the patients included in this study.
Proportion of fragment sizes between 30 and 60 bp in the urine of cfDNA from healthy controls (gray), other non‐cancer CNS pathologies (light blue), LGG (orange), and HGG (red). Wilcoxson‐test comparing the boxplots are added. Horizontal line within the bars represents median of the underlying population. Boxplot whiskers show 1.5 interquartile range of highest and lowest quartile.
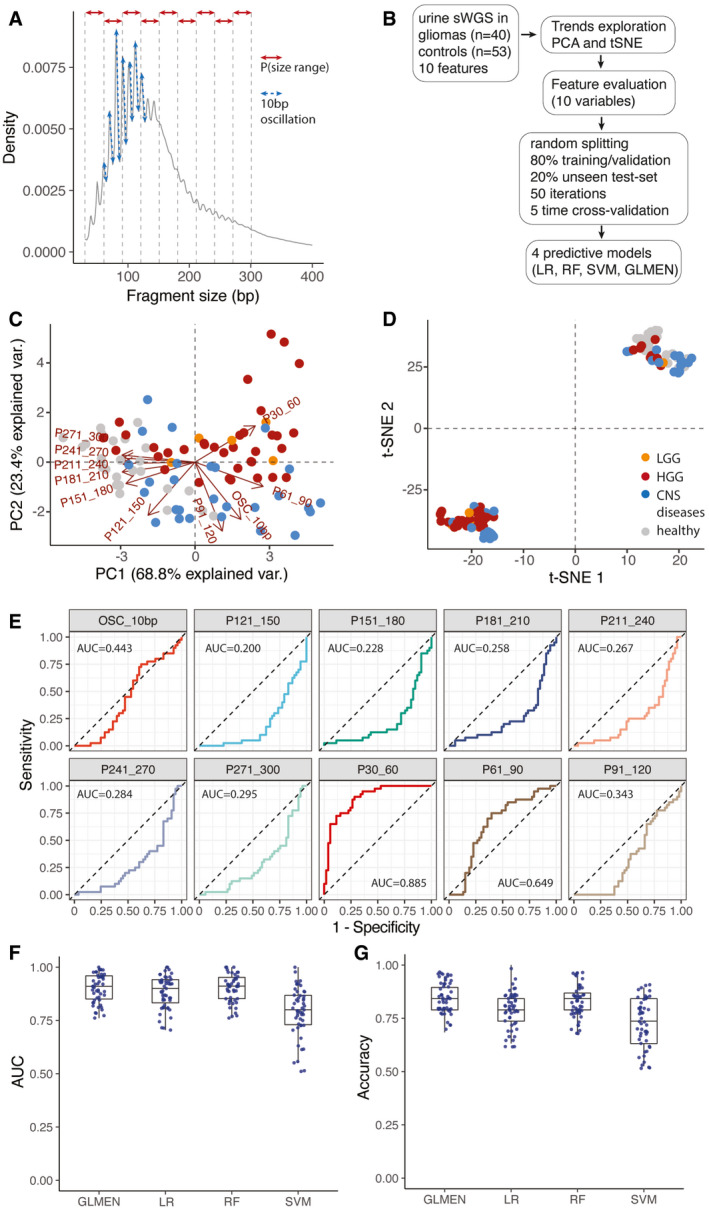
Schematic of the features extracted from the global cfDNA fragmentation patterns of urine samples. 10 features were calculated from the cfDNA fragments size (the proportion of fragments in specific size ranges: P30_60, P61_90, P91_120, P121_150, P151_180, P181_210, P211_240, P241_270, P271_300; and the amplitude of the 10bp oscillations: OSC_10bp).
Workflow for the predictive analysis combining the urine fragment size features via LR, RF, SVM, and GLMEN models. sWGS data from 40 urine samples from patients with gliomas and 53 urine samples from controls were split into five subsets for training/validation (80% of the samples) and testing (20% of the samples), according to a 5‐fold cross‐validation approach and 50 random iterations (see Materials and Methods).
Principal component analysis comparing cancer (HGG and LGG) and control samples (healthy and other CNS diseases) using data from the urine fragmentation features. Red arrows indicate features tested during the predictive analysis.
tSNE analysis comparing cancer and control samples using data from the same urine fragmentation features.
ROC curves for binary classification of cancer and controls for each of the individual fragmentation features analyzed. AUC values are added to the plots.
AUC distribution for the unseen test set (samples from patients with gliomas, 40; controls, 53) for four predictive models (LR, GLMEN, RF, and SVM) trained and optimized following the scheme described in (B) and the Materials and Methods section. For each, models are shown the AUC for the 50 iterations. Horizontal line within the bars represent median of the underlying population. Boxplot whiskers show 1.5 interquartile range of highest and lowest quartile.
Accuracy were compared for the four classifiers and 50 iterations on the unseen test set of baseline and follow‐up samples (19 samples). Horizontal line within the bars represents median of the underlying population. Boxplot whiskers show 1.5 interquartile range of highest and lowest quartile.
References
Publication types
MeSH terms
Substances
Grants and funding
LinkOut - more resources
Full Text Sources
