Review
. 2021 Nov 1;56(11):669-679.
doi: 10.1097/RLI.0000000000000810.

Low-Field Magnetic Resonance Imaging: Its History and Renaissance

Affiliations
Review

Low-Field Magnetic Resonance Imaging: Its History and Renaissance

Masaaki Hori et al. Invest Radiol. .

Abstract

Low-field magnetic resonance imaging (MRI) systems have seen a renaissance recently due to improvements in technology (both hardware and software). Originally, the performance of low-field MRI systems was rated lower than their actual clinical usefulness, and they were viewed as low-cost but poorly performing systems. However, various applications similar to high-field MRI systems (1.5 T and 3 T) have gradually become possible, culminating with high-performance low-field MRI systems and their adaptations now being proposed that have unique advantages over high-field MRI systems in various aspects. This review article describes the physical characteristics of low-field MRI systems and presents both their advantages and disadvantages for clinical use (past to present), along with their cutting-edge clinical applications.


Conflict of interest statement

Conflicts of interest and sources of funding: The authors have no conflicts of interest to declare. This work was supported by JSPS KAKENHI grant number 19K08161, 19K17150, 18H02772, and JP16H06280; a research grant (2017-2020) from the Japanese Society of Neuroradiology; and AMED under grant number JP19lk1010025h9902.

Figures

FIGURE 1
FIGURE 1
Postsurgical operative status for cervical spondylosis. Cervical radiographs show the postsurgical fixation of cervical vertebrae and the presence of metallic fixation devices (A and B). Sagittal transverse (T2) and longitudinal relaxation (T1)-weighted magnetic resonance (MR) images at 1.5 T exhibit focal signal inhomogeneity, signal loss, and artifacts, thus making it difficult to evaluate the spinal cord (C and D). Sagittal T2- and T1-weighted images reconstructed by a 0.2-T permanent magnet MR system show little image distortion or signal loss, and the spinal cord can thus be evaluated.
FIGURE 2
FIGURE 2
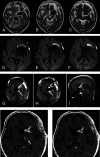
Status of the cerebral aneurysm after a neurosurgical operation. T2-weighted MR images (A–C) and diffusion-weighted images (D–F) at 1.5 T show conspicuous signal loss around the coil and metal artifacts. Evaluation of the surrounding brain parenchyma is difficult. Line-scan diffusion-weighted images (spin echo–based sequence) (G–I) at 0.2 T show an abnormally high intensity in the left caudate nucleus indicative of a recent cerebral infarction. Moreover, postcontrast-enhanced T1-weighted images (J and K) at 0.2 T show abnormal enhancements. These findings also support the assertion for the presence of a recent cerebral infarction.
FIGURE 3
FIGURE 3
Contrast-enhanced MR angiography (MRA) of large vessels in a 0.2-T MRI system. First phase (A) and second phase (B). The sequence is efgre3d (TR/TE = 12.6/3.2 milliseconds). Voxel dimensions were 0.6 × 1.6 × 1.6 mm3, and intravenous gadolinium contrast media were injected at a rate of 5 mL/s.
FIGURE 4
FIGURE 4
Axial images of water and an acetone phantom were obtained via diffusion-weighted imaging with a line-scan diffusion-weighted imaging (LSDWI) sequence with a b-value of 0 s/mm2 (A), fast spin echo sequence (B), and multishot EPI sequence with a b-value of 0 s/mm2 (C) at 0.2 T. Fewer artifacts are observed in image (A). Artifacts generated owing to the sequence design are prominent in (B) (ghosting artifacts) and (C) (image distortions). These images are associated with potential errors (reproduced with permission from Hori et al).
FIGURE 5
FIGURE 5
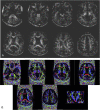
Fractional anisotropy map (A) in axial plane and color schemes (B) used to represent the orientations of anisotropic tissues in axial and coronal images obtained in a healthy volunteer by LSDWI on a 0.2-T MR scanner. The coronal image was obtained by reformatting the axial slice. In the color maps, red denotes right and left, green denotes anterior and posterior, and blue denotes the superior and inferior directions. The image quality is sufficient to estimate white matter in the brain (reproduced with permission from Hori et al).
FIGURE 6
FIGURE 6
A 21-year-old woman with some clinical cervical myelopathy. Sagittal reformatted 3D FIESTA (TR = 13.2 milliseconds, TE = 6.6 milliseconds) image (A), apparent diffusion coefficient (isoADC) map (B), and fractional anisotropy map (C) at 0.2 T. Note that the diameter of the cervical spinal cord on each image is different. Cerebrospinal fluid contamination in the voxel of the spinal cord may induce this phenomenon (reproduced with permission from Hori et al). FIESTA (A) provides high signal-to-noise and good soft tissue image contrast for imaging because it is imaged in 3D, and spin echo–based LSDWI, imaged in the direct sagittal section, can provide distortion-free quantitative maps.
FIGURE 7
FIGURE 7
A mediastinal tumor case of an 80-year-old man. In the transverse computed tomography (CT) image, the lesion of interest is very close to the clavicle, and a safe biopsy approach would be difficult to accomplish on this image (A). Using the sagittal MRI scan, it was possible to perform biopsy with an MRI-guided approach from above with a 0.2-T MR system. The low signal region (along the indicated line) denotes the biopsy needle. Note that with the recent advanced interventional CT tool, the same procedure can be performed, but under MR guidance, ionizing radiation can be avoided.
FIGURE 8
FIGURE 8
Bone scintigraphy shows multiple abnormal accumulations in the bone (not shown), and the STIR image at 0.2 T showed high signal in the intraosseous lesion. Given that it was difficult to identify the position by CT, the biopsy was performed with MRI guidance at 0.2 T using the spin echo T1-weighted sequence. This lesion was later found to be osteomyelitis.
FIGURE 9
FIGURE 9
In the MR Matas test, a neuroradiologist manually compresses the common carotid artery of the affected side during scanning (reproduced with permission from Hori et al).
FIGURE 10
FIGURE 10
A 65-year-old man with hypopharyngeal cancer in the left side, and consequent changes to the left cerebral circulation. The left common carotid artery was compressed manually and sufficiently to stop its blood flow. The MR Matas test at 0.2 T clearly demonstrates the cross-flow from the patient side (right, black arrow) to the occluded side (left, white arrow) via the circle of Willis (reproduced with permission from Hori et al).
FIGURE 11
FIGURE 11
Time-of-flight MRA (A) and minimal intensity projection susceptibility-weighted imaging (B) from the recent advanced 0.55-T MRI system. Voxel dimensions were 0.5 × 0.5 × 0.5 mm3 in time-of-flight MRA and 0.3 × 0.3 × 16.0 mm3 in minimal intensity projection susceptibility-weighted imaging with approximate scan times of 5 and 6 minutes. Courtesy of Hiromori Uneda and Akihiro Manabe, Siemens Healthcare Japan.

References

    1. Marques JP, Simonis FFJ, Webb AG. Low-field MRI: an MR physics perspective. J Magn Reson Imaging. 2019;49:1528–1542. - PMC - PubMed
    1. Sarracanie M, Salameh N. Low-field MRI: how low can we go? A fresh view on an old debate. Front Phys. 2020;8:172.
    1. Bilaniuk LT Zimmerman RA Wehrli FW, et al. . Cerebral magnetic resonance: comparison of high and low field strength imaging. Radiology. 1984;153:409–414. - PubMed
    1. Hittmair K Kramer J Rand T, et al. . Infratentorial brain maturation: a comparison of MRI at 0.5 and 1.5T. Neuroradiology. 1996;38:360–366. - PubMed
    1. Rand T Imhof H Turetschek K, et al. . Comparison of low field (0.2T) and high field (1.5T) MR imaging in the differentiation of torned from intact menisci. Eur J Radiol. 1999;30:22–27. - PubMed

Publication types