. 2021 Sep 6;218(9):e20210615.
doi: 10.1084/jem.20210615. Epub 2021 Jul 22.

Single cell analysis of M. tuberculosis phenotype and macrophage lineages in the infected lung

Affiliations

Single cell analysis of M. tuberculosis phenotype and macrophage lineages in the infected lung

Davide Pisu et al. J Exp Med. .

Abstract

In this study, we detail a novel approach that combines bacterial fitness fluorescent reporter strains with scRNA-seq to simultaneously acquire the host transcriptome, surface marker expression, and bacterial phenotype for each infected cell. This approach facilitates the dissection of the functional heterogeneity of M. tuberculosis-infected alveolar (AMs) and interstitial macrophages (IMs) in vivo. We identify clusters of pro-inflammatory AMs associated with stressed bacteria, in addition to three different populations of IMs with heterogeneous bacterial phenotypes. Finally, we show that the main macrophage populations in the lung are epigenetically constrained in their response to infection, while inter-species comparison reveals that most AMs subsets are conserved between mice and humans. This conceptual approach is readily transferable to other infectious disease agents with the potential for an increased understanding of the roles that different host cell populations play during the course of an infection.


Conflict of interest statement

Disclosures: The authors declare no competing interests exist.

Figures

None
Graphical abstract
Figure 1.
Figure 1.
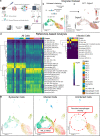
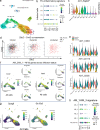
Identification of heterogenous macrophage populations by scRNA-seq in Mtb-infected mouse lungs. Here we show the results from unbiased analysis of the integrated myeloid datasets, leading to the identification of different subsets of infected AMs and IMs. (a) Schematic representation of the experimental protocols. Bl/6 mice were infected with either hspx′::GFP/smyc′::mCherry or smyc′::mCherry Erdman for 3 wk. Single-cell suspensions were generated and infected (mCherry+, hspx′::GFPhigh/low), bystander (mCherry CD45+), and uninfected (CD45+) cells were flow-sorted. Samples have then been stained with HTO (sample identity) or ADT (surface markers expression) antibodies and methanol-fixed, and 10X Genomics/Cite-Seq libraries were generated. (b) Umap plot showing unbiased clustering of the myeloid cell populations in the integrated dataset. All statistically significant (as defined by the jackstraw method; Chung and Storey, 2015) PC components have been used for clustering and downstream analysis. (c) Umap plot showing ADT staining levels (in log-normalized values) for the SiglecF protein. Two main macrophage populations, SiglecF+ and SiglecF, are identifiable. Higher staining values are displayed in dark red, while lower staining values are shown in gray. (d) Heatmaps showing the results of reference-based analysis for either all cells in the integrated dataset against the Immgen database alone, or infected cells against a custom joined reference dataset that includes both general populations (Immgen) and Mtb-infected and uninfected lung AMs and IMs (Gibbings et al., 2017; Pisu et al., 2020a). Higher similarity scores among the transcriptional profiles of query and reference datasets are showed in yellow. (e) Umap plot showing a split view (based on infection status) of the unbiased clustering of the myeloid cell subsets. As described in the main text, recruited myeloid cells are absent from uninfected mice, while AM_2 cells are shifted and close to the IM_1 subset in the infected population. n = 5 for the infected population, n = 2 for the uninfected population.
Figure S1.
Figure S1.
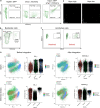
Flow cytometry gating and scRNA normalization strategies used in the generation of the integrated dataset. (a) Flow cytometry gating strategy for the sorting of the hspx′::GFP/smyc′::mCherry infected mice lungs. hspx′::GFPhigh and hspx′::GFPlow infected host populations have been sorted based on the level of expression of a bacterial protein (Hspx), which is a well-known indicator of bacterial stress responses in Mtb. Mice infected with ::GFP Erdman (constitutive expression of GFP driven by hsp60 promoter) and smyc′::mCherry (constitutive expression of mCherry driven by smyc promoter) have been used as gating controls. (b) Flow cytometry gating strategy for the sorting of the bystander cells. mCherry/CD45+ cells from mice infected with smyc′::mCherry Erdman have been sorted and processed for scRNA-seq. A mouse infected with WT Erdman (not fluorescent) has been used as a gating control for the mCherry signal (data not shown). (c) Flow cytometry gating strategy for the sorting of the uninfected cells. CD45+ cells from uninfected mice have been sorted and processed for scRNA-seq. An unstained sample has been used as a gating control. SSC-A, side scatter area. (d) Confocal microscopy images of the sorted populations: hspx′::GFPhigh and hspx′::GFPlow. (e) PCA and violin plots visualizing the merged myeloid datasets before and after integration with Harmony for the two covariates: infection status and batch. As visualized in the figure, data integration with Harmony allowed us to correctly identify shared cell identities from cells of different batches and infection statuses. n = 5 for the infected population, n = 2 for the uninfected population.
Figure S2.
Figure S2.
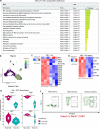
Pathway enrichment analysis and assessment of genes associated with an iron signature for the IM_2 and IM_3 subsets. (a) Flow cytometry analysis of the two ontologically distinct macrophage populations from infected (at 3 w.p.i.) and uninfected mice lungs. Macrophages (MerTK+ CD64+) have been gated from other immune cells, and expression of the surface marker SiglecF has been used to separate the two main populations (AMs and IMs). As evidenced in the text, recruited populations of macrophages are present in lower numbers in uninfected mice compared with infected tissues. FSC-A, forward scatter area. (b) Umap plot showing expression levels (in log-normalized counts) for the Ly6a/Sca-1 marker gene. IM_2 and IM_3 subpopulations both express this marker, although only IM_3 shows a pro-inflammatory phenotype. Higher expression values are displayed in yellow/green, while low expression values are shown in blue. (c) Pathway enrichment analysis results for the transcriptional profile of IM_3 and IM_2 infected macrophages. The reactome database has been used as the main data source. (d) Umap plots showing gene expression levels (in log-normalized counts) for some of the genes (Hp, Slc48a1, Sod2, and Slc11a1) involved in the heme-iron response in IMs. Higher expression values are displayed in yellow/green, while low expression values are shown in blue. (e) Umap plots (split-view) showing gene expression levels (in log-normalized counts) for the ferritin genes (Ftl1 and Fth1) across different infection conditions. Higher expression values are shown in blue, while low expression values are displayed in gray. n = 5 for the infected population, n = 2 for the uninfected population. All the genes highlighted in the different figures show statistically significant greater expression in their clusters compared with cells in different clusters (FDR < 0.05; Wilcoxon rank-sum test; see Materials and methods). For pathway enrichment analysis, only pathways with FDR < 0.05 are shown (g:SCS method for multiple testing correction; See Materials and methods).
Figure 2.
Figure 2.
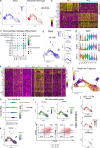
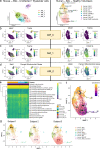
Analysis of the IM subsets with respect of their impact on bacterial phenotype. Here we probe deeper into the transcriptomes of those IM subsets that appear best adapted to control Mtb growth. (a) Umap plots showing a side-by-side comparison of the RNA expression levels for Nos2 (in log-normalized counts) and associated bacterial phenotype across infected host cells. The data demonstrates that up-regulation of Nos2 in infected cells (highlighted in blue) is associated with stressed bacteria (hspx′::GFPhigh, in red). (b) Heatmap showing the different gene signatures that characterize IM_2 and IM_3 subsets in infected cells. Higher expression levels are shown in yellow, lower expression levels in purple. Each row represents a gene, while each column represents a cell. (c) Dot plot showing scaled expression values for monocyte to macrophage differentiation marker genes among the different clusters of the integrated dataset. As evidenced in the text, the IM_3 subset shows the highest levels of expression of monocyte markers, suggesting that these cells are not yet fully differentiated into macrophages. Higher expression levels are represented in yellow/green, while lower expression levels are shown in blue. The size of the dot corresponds to the percentage of cells that express each gene in each cluster. (d) Umap plots (split-view) showing expression levels (in log-normalized counts) for Zeb2 among the different infection conditions. IM_1 and AM_2 are the subsets characterized by the expression of this marker gene. Cells with high levels of expression are highlighted in blue. (e) Heatmap showing scaled gene expression levels in the AM and IM clusters for the transcriptional signature that characterizes the IM_1 subset. Higher expression levels are shown in yellow, lower expression levels in purple. Each row represents a gene, while each column represents a cell. (f) Umap plot showing single-cell trajectory and pseudotime analysis of the macrophage populations in the integrated dataset. Gray circles represent cell fates, while black circles are defined as branching points through which cells transition in the trajectory. For pseudotime distance, cells farthest away from the root are colored in yellow, while cells close to the root are colored in blue. (g) Stacked violin plots showing staining levels (in log-normalized values) for the ADT antibodies CD38, CD11b, and CD11c across IM and AM clusters of the integrated dataset. In general, IM subsets are characterized by higher staining levels for CD38 and CD11b antibodies, while expression of the surface marker CD11c is higher in AMs. (h) Dot plot showing scaled expression values for the iron gene signature among the infected IM subsets. Higher expression levels are represented in yellow/green, while lower expression levels are shown in blue. The size of the dot corresponds to the percentage of cells that express each gene in each cluster. (i) a: Umap plots showing expression levels (in log-normalized counts) for the Slc7a2 and Clec4e genes, involved in NO-mediated responses to infection in macrophages. Cells with high levels of expression are displayed in yellow. b: Scatter plots showing coexpression levels of Nos2 with either Clec4e and Slc7a2 genes (in log-normalized counts) and associated bacterial phenotype for each cell (hspx′::GFPhigh and hspx′::GFPlow in red and light blue, respectively). A subjective threshold of 2 log-normalized counts has been chosen to define high and low populations based on prior analysis of the distribution of expression for each gene among the different macrophage populations (a and i, top panel a). Percentage values indicate the amount of hspx′::GFPhigh cells in each quadrant from the entire population of hspx′::GFPhigh cells displayed in the plot. (j) Umap plots (split-view) showing ADT staining values for the TLR4 surface marker (in log-normalized counts) across the different infection conditions. Higher staining values are displayed in dark red, lower staining values in gray. (k) Umap plot showing expression values (in log-normalized counts) for the Nfe2l2 (Nrf2) gene. The plot shows that this NO-associated gene is mainly expressed by IM_2 macrophages, as evidenced in the text, and some subpopulations of AMs, as previously described (Rothchild et al., 2019). Higher expression values are displayed in yellow, and lower expression values are shown in blue. n = 5 for the infected population, n = 2 for the uninfected population. All the genes highlighted in the different figures show statistically significant greater expression in their clusters compared with cells in different clusters (FDR < 0.05; Wilcoxon rank-sum test; see Materials and methods).
Figure S3.
Figure S3.
Umap plots (split-view) showing both gene expression (RNA) and antibody staining levels (ADT) for the surface markers CD14, CD11b, CD11c, and CD38 across different infection conditions.n = 5 for the infected population, n = 2 for the uninfected population.
Figure S4.
Figure S4.
AM1_Pro-infl subset gene signatures and Mtb transcriptional profile. (a) Pathway enrichment analysis results for the transcriptional profile of the AM_Pro-Infl population. The reactome database has been used as the main data source. (b) Umap plot showing gene expression levels (in log-normalized counts) for the Marco PRR. Higher expression values are displayed in yellow/green, while low expression values are shown in blue. (c) Heatmap showing relative expression levels for the iron gene signature in Mtb. (d) Heatmap showing relative expression levels for the suf operon in Mtb. (e) Violin plots showing expression levels (in log-normalized counts) for the genes part of the ergothioneine biosynthesis pathway in Mtb. (f) Flow cytometry gating strategy for the sorting of CD11clow and CD11chigh macrophage populations (MerTK+CD64+). Fluorescence Minus One (FMO) controls for both CD11c and mCherry signals have been used as gating controls. n = 5 for the infected population, n = 2 for the uninfected population, n = 3 for the bacterial transcriptome. The statistical significance for the genes part of the bacterial transcriptome has been calculated using the Wald test as implemented in the DESeq2 package (FDR < 0.05; see Materials and methods; Love et al., 2014). For pathway enrichment analysis, only pathways with FDR < 0.05 are shown (g:SCS method for multiple testing correction; see Materials and methods) Unless otherwise specified, the statistical significance is provided when appropriate for each plot (*, p-adj. < 0.05; **, p-adj. < 0.01).
Figure 3.
Figure 3.
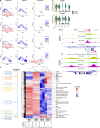
Analysis of the pro-inflammatory AM subsets. The AM subsets also include host cell populations that have an inflammatory phenotype and appear capable of inducing stress in Mtb. (a) Umap plot showing the clustering of the myeloid cell populations in the integrated dataset. The AM_Pro-Infl population, a subset of the AM_1 cluster, is highlighted. (b) Dot plot showing scaled expression values for the pro-inflammatory gene signature related to infected AMs. Higher expression levels are represented in yellow/green, while lower expression levels are shown in blue. The size of the dot corresponds to the percentage of cells that express each gene in each cluster. (c) Violin plot showing ADT staining levels (in log-normalized counts) for the SiglecF surface marker among the different subpopulations of infected macrophages. (d) Scatter plots (split-view) showing coexpression levels (in log-normalized counts) for Zeb2 and Cxcl2 marker genes in AM_2, IM_1, and AM_Pro-Infl subpopulations across different infection states. (e) Stacked violin plots showing staining levels (in log-normalized values) for the ADT antibodies CD63, CD11b, and CD38 in different clusters of macrophages and across the different infection conditions. As evidenced in the text, the infected and bystander AM_Pro-Infl populations show higher expression levels for these surface markers. (f) Umap plots (split view) showing expression values (in log-normalized counts) for the Cxcl2 and Malt1 genes (part of the AM_2 NF-κB signature) across the different infection conditions. Higher expression values are displayed in yellow, while low expression values are shown in blue. (g) Umap plots showing expression values (in log-normalized counts) for the Spag9 and Slc15a3 genes in the integrated dataset. Higher expression values are displayed in yellow, while low expression values are shown in blue. (h) Dot plot showing scaled expression values among subsets of AMs for genes whose expression is associated with the AM_1 and AM_3 clusters in the integrated dataset. Higher expression levels are represented in yellow/green, while lower expression levels are shown in blue. The size of the dot corresponds to the percentage of cells that express each gene in each cluster. n = 5 for the infected population, n = 2 for the uninfected population. All the genes highlighted in the different figures show statistically significant greater expression in their clusters compared with cells in different clusters (FDR < 0.05; Wilcoxon rank-sum test; see Materials and methods).
Figure 4.
Figure 4.
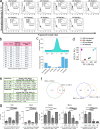
Diverse bacterial transcriptomes and drug tolerance phenotypes are associated with expression of CD11c in the host cell. Flow sorting of infected macrophages on the basis of Mtb GFP expression before dual RNA-seq analysis of the bacterial transcriptomes establishes links between bacterial stress, induction of drug tolerance, and the expression levels of the macrophage surface marker CD11c. (a) PCA of the Mtb transcriptome for the four different samples: hspx′::GFPhigh, hspx′::GFPlow (this manuscript), and Mtb in AM and IM (Pisu et al., 2020a). PCA reveals that both activation (hspx′::GFPhigh, hspx′::GFPlow samples) and ontogeny of the host immune cell (Mtb in AM, Mtb in IM) play a role in shaping bacterial responses during infection. (b) Heatmap showing relative expression levels for the Mtb drug tolerance gene signature. (c) Heatmap showing relative expression levels for the DosR regulon in Mtb. (d) Boxplots showing expression levels (in log-normalized counts) for the genes related to the heme-iron signature in Mtb. hspx′::GFPhigh bacteria overexpress a set of genes involved in heme-iron uptake and catabolism in agreement with the finding that most hspx′::GFPhigh bacteria are contained in macrophages that are heme-loaded. (e) Violin plots showing expression levels (in log-normalized counts) of the genes part of the hspx operon. (f) Scatter plots showing staining levels (in log-normalized values) for the surface markers CD11c and SiglecF in infected cells. Host cells containing hspx′::GFPhigh bacteria are visualized in red, while cells containing hspx′::GFPlow Mtb are displayed in light blue. Four different populations of host cells (SiglecF+/CD11clow, SiglecF+/CD11chigh, SiglecF/CD11cint, and SiglecF/CD11clow), each containing different proportions of associated hspx′::GFPhigh bacteria, are identifiable. The data clearly show that expression of the surface marker CD11c is inversely correlated with the bacterial phenotype in both AMs and IMs. (g) Violin plot showing staining levels (in log-normalized values) for the surface marker CD11c in hspx′::GFPhigh- and hspx′::GFPlow- infected host cells. (h) Flow cytometry analysis of infected macrophages (MerTK+ CD64+ mCherry+) at 3 w.p.i. from hspx′::GFP/smyc′::mCherry infected mice. The same populations we identified by scRNA-seq (f) are also visible by flow cytometry. SSC-A, side scatter area. (i) Flow cytometry analysis of the MFI for the GFP signal across the different subpopulations of infected macrophages (AM CD11chigh, AM CD11clow, IM CD11clow, and IM CD11chigh). (j) Quantification of the amount of Mtb that survived exposure to 1 μg/ml of either INH or RIF in CD11chigh and CD11clow macrophages. Values have been normalized for 100,000 bacteria in the untreated group. An 83% and 47% increase in the number of bacteria that survived drug treatment in CD11clow macrophages was observed for INH and RIF, respectively. n = 5 for the infected population, n = 2 for the uninfected population, n = 3 for the bacterial transcriptome. The statistical significance for the genes part of the bacterial transcriptome has been calculated using the Wald test as implemented in the DESeq2 package (FDR < 0.05; see Materials and methods; Love et al., 2014). The statistical significance is provided for the remaining plots part of the flow cytometry and drug tolerance experiments (*, p-adj. < 0.05; **, p-adj. < 0.01; ***, p-adj. < 0.001; and ****, p-adj. < 0.0001; one-way ANOVA with Tukey test and unpaired t test; see Materials and methods).
Figure 5.
Figure 5.
Human–mouse comparison of the different AM subsets. scRNA-seq of human lung macrophage populations from healthy volunteers identifies resident macrophage subsets that share transcriptional signatures of biological significance with murine macrophages. (a) Umap plots showing unbiased clustering of non–Mtb-infected AMs (uninfected + bystander cells) in mice and myeloid populations from BAL of healthy volunteers in humans. (b) Umap plots showing gene expression values (in log-normalized counts) for the marker genes (Top2a and Mki67) of the AM_4 population in both mice and humans. Higher expression values are displayed in yellow, while low expression values are shown in blue. (c) Umap plots showing gene expression values (in log-normalized counts) for the marker genes (CD63 and Fcer1g) of the AM_1 population in both mice and humans. Higher expression values are displayed in yellow, while low expression values are shown in blue. (d) Umap plots showing gene expression values (in log-normalized counts) for the marker gene Zeb2, as well as the percentage of mitochondrial reads of the AM_2 population in both mice and humans. Higher expression values are displayed in yellow, while low expression values are shown in blue. (e) Heatmap showing the results of reference-based analysis for the human integrated dataset against the Human Primary Cell Atlas database. Higher similarity scores among the transcriptional profiles of query and reference datasets are showed in yellow. (f) Umap plot showing single-cell trajectory and pseudotime analysis of macrophage populations in the human integrated dataset. Gray circles represent cell fates, while black circles are defined as branching points through which cells transition in the trajectory. For pseudotime, cells farthest away from the root are colored in yellow, while cells close to the root are colored in blue. (g) Umap plot showing a split-view (by subject) of the unbiased clustering of the human dataset. As evidenced in the text, the proportions of the main AMs subsets vary considerably among different individuals. Values indicate the number of cells belonging to each cluster as a percentage of the total amount of cells recovered from each individual. n = 3 for the human BAL samples.
Figure 6.
Figure 6.
Identification of open chromatin regions shared between the different subsets of macrophages in both Mtb and BCG infection. Transcriptomic data from Mtb-infected mice, when compared with ATAC-seq data from mice following i.v. immunization with BCG, identify common patterns of epigenetic regulation shared by the IM and AM macrophage subsets in response to mycobacterial stimulation. (a) Umap plots (split-view) showing expression levels (in log-normalized counts) for the C1qa, Nos2, Clec4e, and Lyz2 genes among the different infection conditions. As evidenced in the text, many of the pro-inflammatory genes are expressed even before infection (in both bystander and uninfected cells) by the same clusters that are associated with hspx′::GFPhigh bacteria in the infected population. Cells with high levels of expression are highlighted in blue. (b) Violin plots showing expression levels (in log-normalized counts) for the CD68 and Fabp5 genes among different infection conditions. As noted in the text, both genes are uniquely overexpressed by the AM_Pro-Infl subpopulation even in the uninfected cells. (c) Heatmap showing relative differential peak intensity among BCG-infected and -uninfected AMs and IMs for the 7,815 chromatin promoter regions identified as DA by ATAC-seq. Seven different clusters were identified, the chromatin accessibility of which is changed depending on infection status and ontology of the host cell. (d) UCSC Genome Browser tracks for two of the genes of the AM_Pro-Infl signature, CD63 and CD68. We detected the chromatin open state of the region for the active promoters in uninfected AMs, indicating that cells from this population are epigenetically constrained in their response to infection. n = 5 for the infected population, n = 2 for the uninfected population, n = 3 for the BCG-infected and uninfected ATAC-seq experiments. All the genes highlighted in a and b show statistically significant greater expression in their clusters compared with cells in different clusters (FDR < 0.05; Wilcoxon rank-sum test; see Materials and methods). Genes highlighted in panels c and d show statistically significant greater expression in each sample compared with all other samples (FDR < 0.05; quasi-likelihood F-test method; Lun et al., 2016; see Materials and methods). AM-I, AM infected; AM-U, AM uninfected; IM-I, IM infected; IM-U, IM uninfected.
Figure S5.
Figure S5.
ATAC-seq QC plots and DA peak average CPM mapped reads at the promoter regions for genes that characterize the major macrophage subpopulations. (a) Histograms showing the distribution of fragment lengths for each of the replicates. (b) Table showing the number of called peaks (FDR < 0.05) and IDR peaks (IDR < 0.05) for each of the replicates. (c) Distribution of called peaks based on the distance from the TSS (top) and percentages of called peaks among different genetic regions (bottom). (d) PCA plot of the ATAC-seq peak tag counts data, segregated samples by infection status (PC1) and cell type (PC2). (e) Tables showing the total number of DA peaks (FC more than twofold; FDR < 0.05; CPM > 5; top), and the number of DA peaks (FC more than twofold; FDR < 0.05; CPM > 5) in the promoter regions (± 2 kb from TSS) across different comparisons (bottom). (f) Venn diagrams showing the number of DA peaks in the promoter regions when comparing cell types (left) or infection status (right). (g) Bar plots showing the average CPM at the promoter region for the Nos2, Ccl5, Clec4e, Marco, and Chil3 genes. n = 3 for the BCG-infected and uninfected ATAC-seq experiments. Unless otherwise specified, the statistical significance is provided when appropriate for each plot (*, p-adj. < 0.05; **, p-adj. < 0.01; ***, p-adj. < 0.001; and ****, p-adj. < 0.0001; quasi-likelihood F-test method; Lun et al., 2016; see Materials and methods). Avg., average; UTR, untranslated region; AM-I, AM infected; AM-U, AM uninfected; IM-I, IM infected; IM-U, IM uninfected.

References

    1. Abramovitch, R.B., Rohde K.H., Hsu F.F., and Russell D.G.. 2011. aprABC: a Mycobacterium tuberculosis complex-specific locus that modulates pH-driven adaptation to the macrophage phagosome. Mol. Microbiol. 80:678–694. 10.1111/j.1365-2958.2011.07601.x - DOI - PMC - PubMed
    1. Amaral, E.P., Costa D.L., Namasivayam S., Riteau N., Kamenyeva O., Mittereder L., Mayer-Barber K.D., Andrade B.B., and Sher A.. 2019. A major role for ferroptosis in Mycobacterium tuberculosis-induced cell death and tissue necrosis. J. Exp. Med. 216:556–570. 10.1084/jem.20181776 - DOI - PMC - PubMed
    1. Anders, S., and Huber W.. 2010. Differential expression analysis for sequence count data. Genome Biol. 11:R106. 10.1186/gb-2010-11-10-r106 - DOI - PMC - PubMed
    1. Anders, S., Pyl P.T., and Huber W.. 2015. HTSeq--a Python framework to work with high-throughput sequencing data. Bioinformatics. 31:166–169. 10.1093/bioinformatics/btu638 - DOI - PMC - PubMed
    1. Angelidis, I., Simon L.M., Fernandez I.E., Strunz M., Mayr C.H., Greiffo F.R., Tsitsiridis G., Ansari M., Graf E., Strom T.-M., et al. . 2019. An atlas of the aging lung mapped by single cell transcriptomics and deep tissue proteomics. Nat. Commun. 10:963. 10.1038/s41467-019-08831-9 - DOI - PMC - PubMed

Publication types

MeSH terms