. 2021 Sep 6;218(9):e20210580.
doi: 10.1084/jem.20210580. Epub 2021 Jul 22.

The immunodominant antibody response to Zika virus NS1 protein is characterized by cross-reactivity to self

Affiliations

The immunodominant antibody response to Zika virus NS1 protein is characterized by cross-reactivity to self

Cecilia B Cavazzoni et al. J Exp Med. .

Abstract

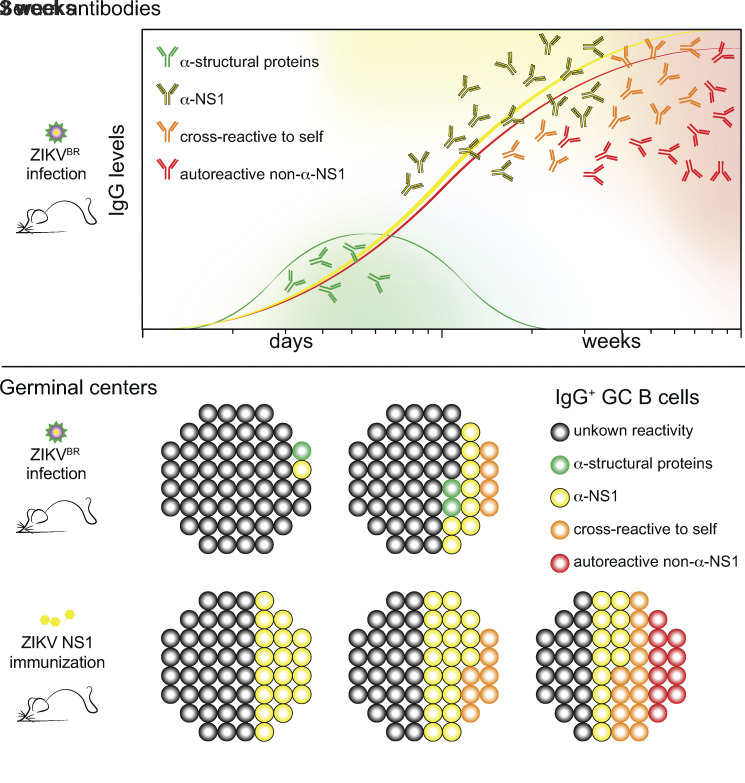
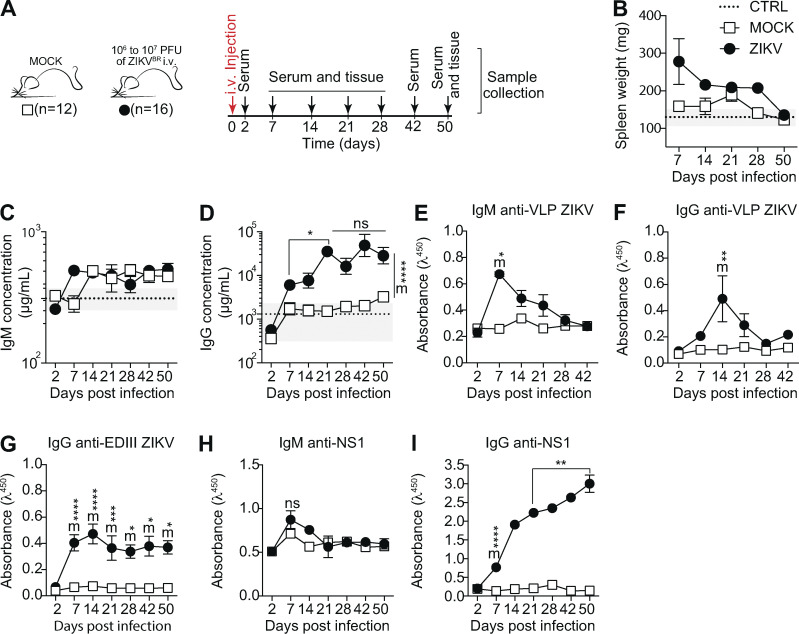
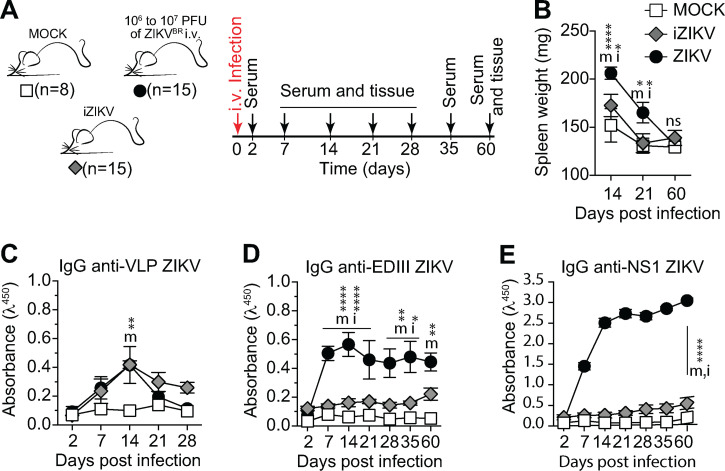
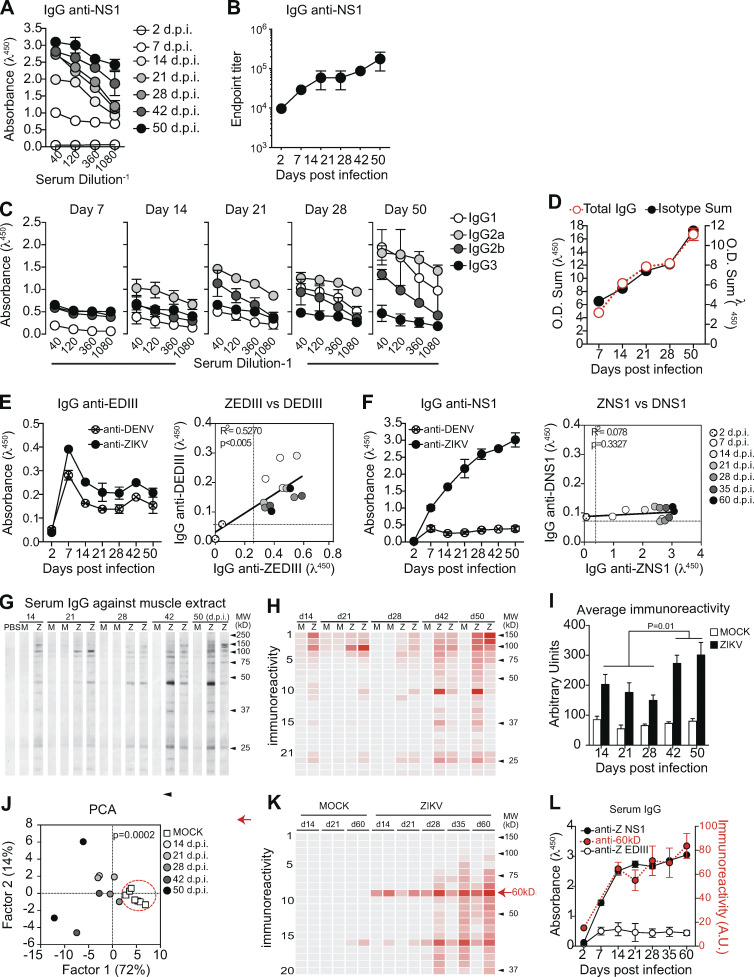
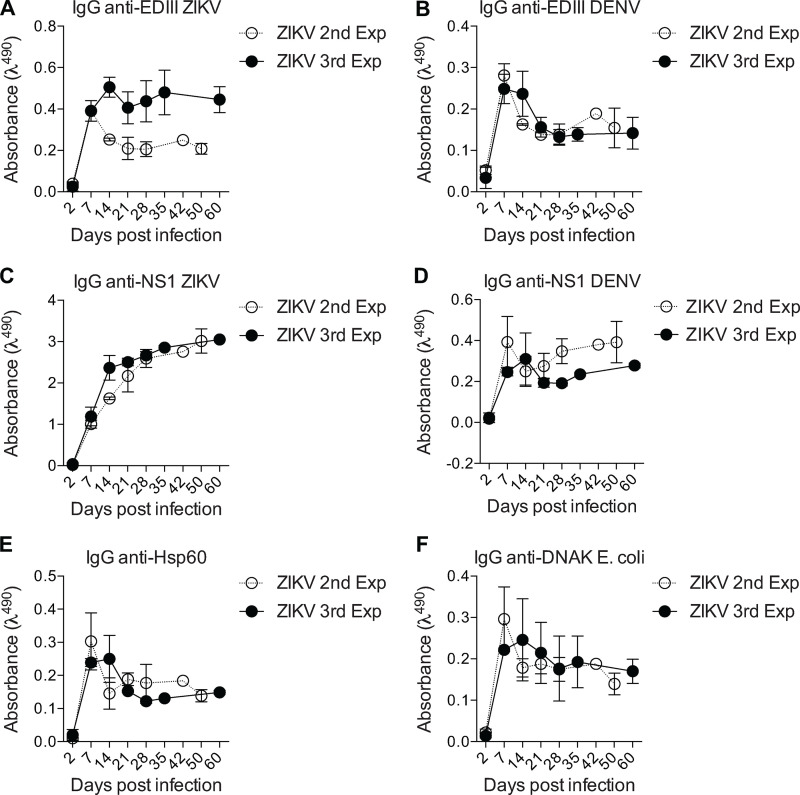
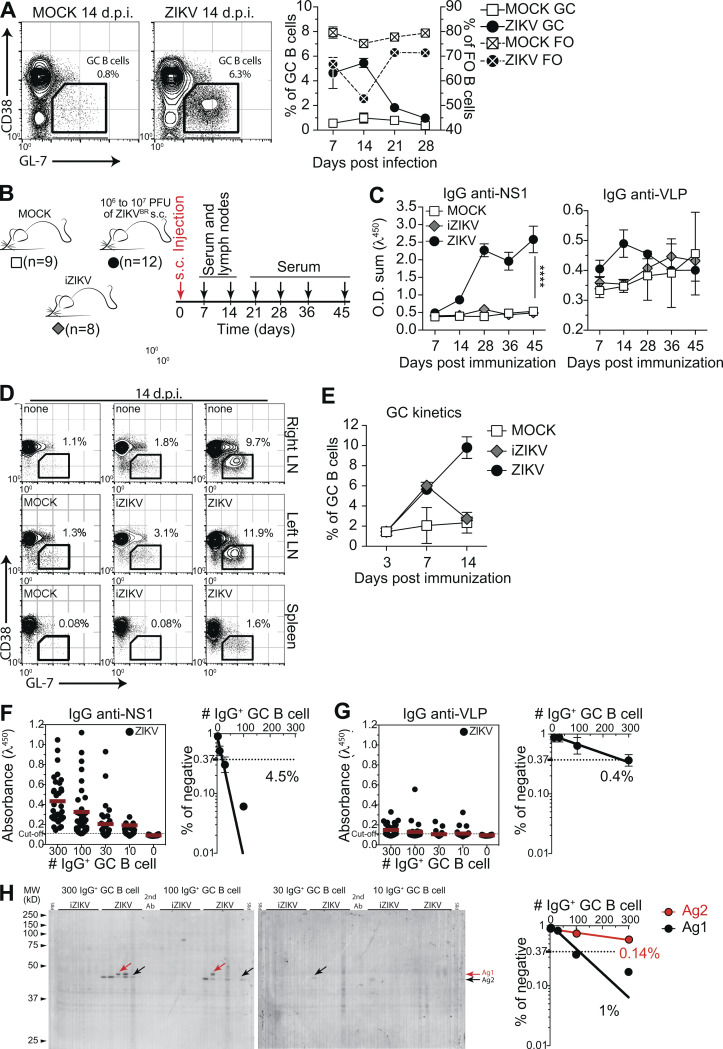
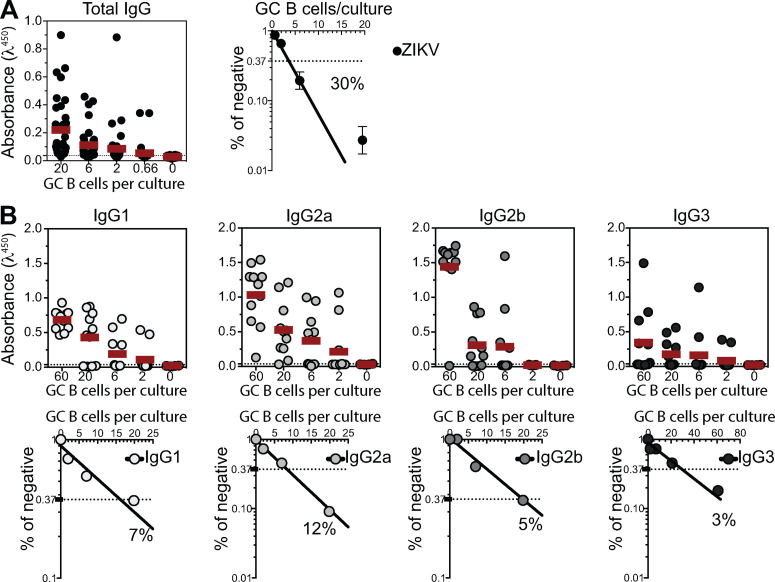
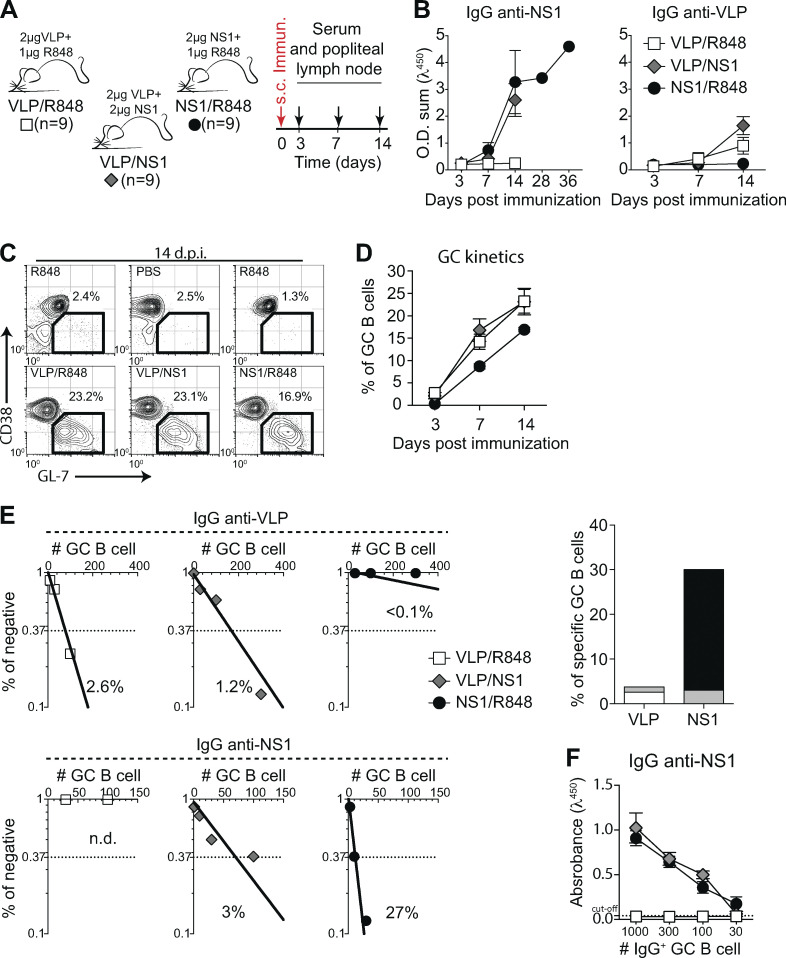
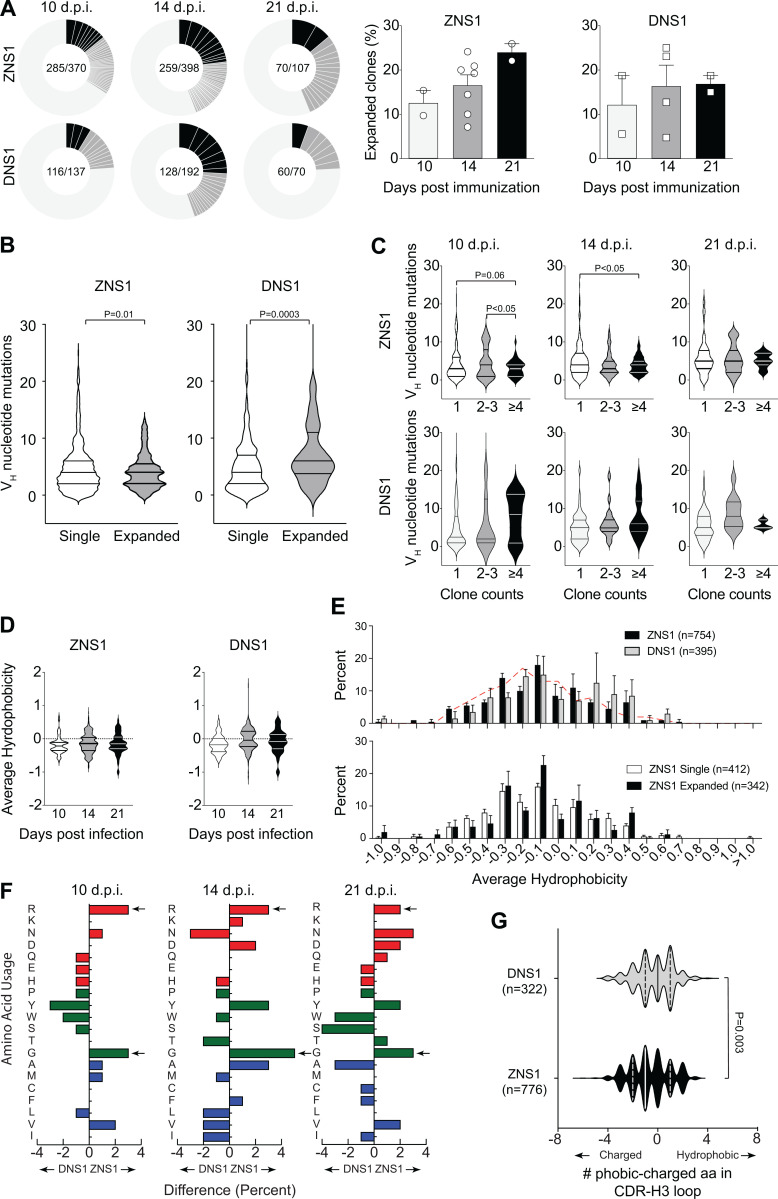
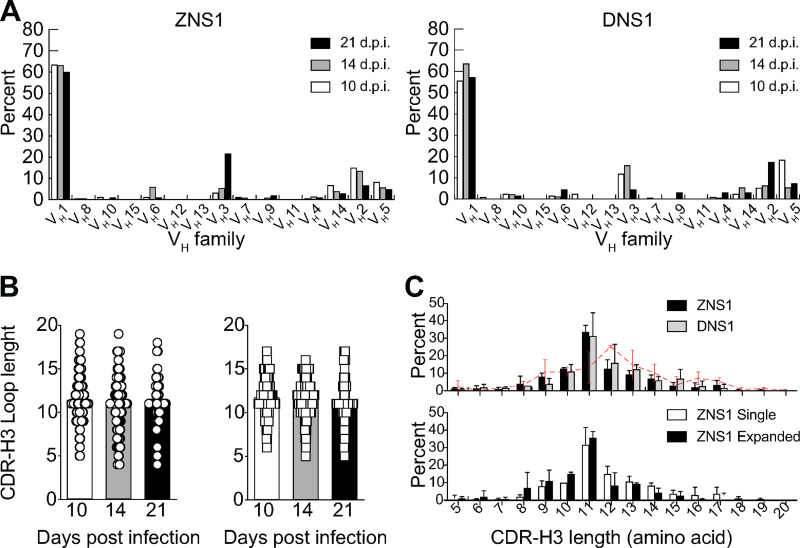
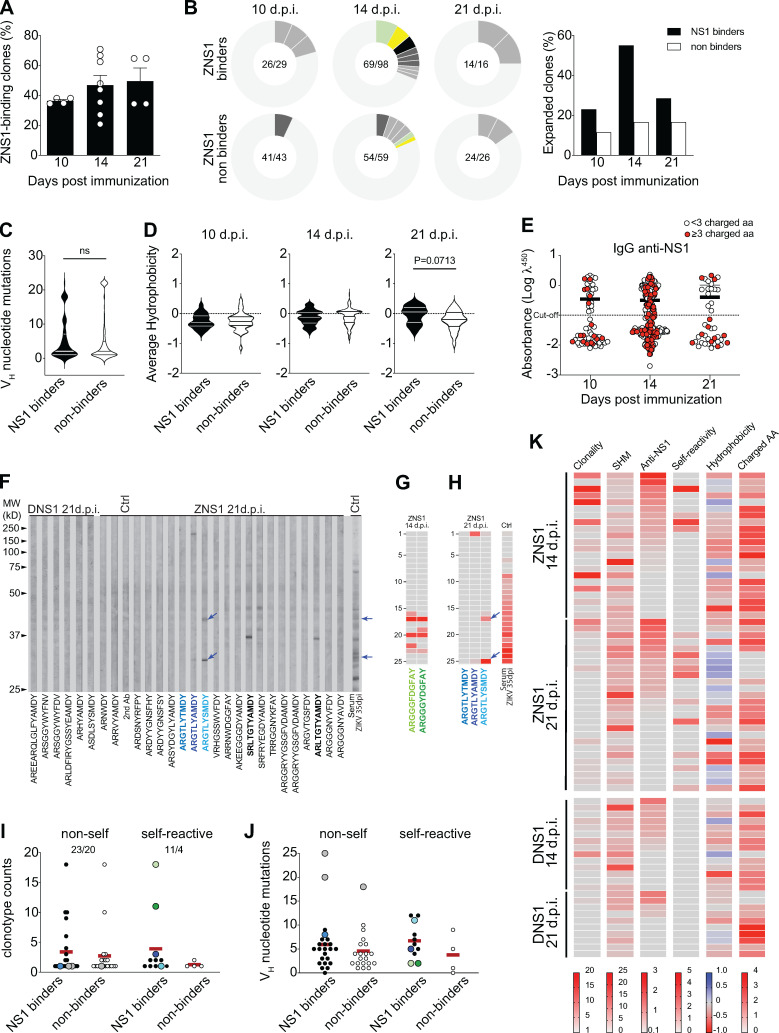
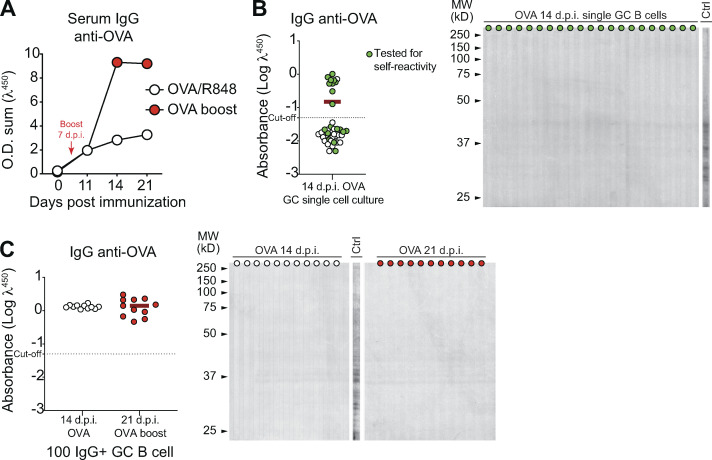
Besides antigen-specific responses to viral antigens, humoral immune response in virus infection can generate polyreactive and autoreactive antibodies. Dengue and Zika virus infections have been linked to antibody-mediated autoimmune disorders, including Guillain-Barré syndrome. A unique feature of flaviviruses is the secretion of nonstructural protein 1 (NS1) by infected cells. NS1 is highly immunogenic, and antibodies targeting NS1 can have both protective and pathogenic roles. In the present study, we investigated the humoral immune response to Zika virus NS1 and found NS1 to be an immunodominant viral antigen associated with the presence of autoreactive antibodies. Through single B cell cultures, we coupled binding assays and BCR sequencing, confirming the immunodominance of NS1. We demonstrate the presence of self-reactive clones in germinal centers after both infection and immunization, some of which present cross-reactivity with NS1. Sequence analysis of anti-NS1 B cell clones showed sequence features associated with pathogenic autoreactive antibodies. Our findings demonstrate NS1 immunodominance at the cellular level as well as a potential role for NS1 in ZIKV-associated autoimmune manifestations.


Conflict of interest statement

Disclosures: The authors declare no competing financial interests.

Figures

None
Graphical abstract
Figure 1.
Figure 1.
Characterization of ZIKV infection in immunocompetent BALB/c mice. (A) Experimental design indicating the time points of serum samples and lymphoid tissue collections. (B) Spleen weight measured at the time of collection, as indicated. (C and D) Total serum IgM (C) and IgG (D) from infected (ZIKV) and control (MOCK) mice, measured by ELISA. (E–G) Levels of IgM and IgG specific for viral surface antigens were measured by ELISA (1:120 dilution) using VLPs and recombinant domain III of ZIKV envelope protein (EDIII). (H and I) Levels of IgM (H) and IgG (I) specific for NS1 protein were measured by ELISA (1:120 dilution) using recombinant ZIKV NS1. Data are representative of three independent experiments with 8–16 mice per group. Statistical analyses were performed using the paired two-tailed Student’s t test. *, P ≤ 0.05; **, P ≤ 0.01. Mice from different groups were compared using the unpaired two-tailed Student’s t test. ZIKV significantly different from MOCK: m*, P ≤ 0.05; m**, P ≤ 0.01; m***, P ≤ 0.001; m****, P ≤ 0.0001. Error bars represent SEM.
Figure S1.
Figure S1.
Characterization of humoral immune response to UV-iZIKV. (A) Experimental design indicating the time points of serum samples and lymphoid tissue collections from control mice (MOCK), mice immunized with UV-inactivated virus (iZIKV), and infected mice (ZIKV). (B) Spleen weight measured at the time of collection, as indicated. (C–E) Serum levels of IgG specific to VLP (C), domain III of ZIKV envelope protein (D), and NS1 (E). Measured by ELISA at 1:120 dilution. One experiment was performed with the indicated number of mice per group. Statistical analyses were performed using the unpaired two-tailed Student’s t test. Significantly different from mock: m*, P ≤ 0.05; m**, P ≤ 0.01; m****, P ≤ 0.0001. Significantly different from iZIKV: i*, P ≤ 0.05; i****, P ≤ 0.0001. Error bars represent SEM.
Figure 2.
Figure 2.
Humoral immune response to NS1 during ZIKV infection correlates with autoreactive antibodies. (A) Binding of serum IgG to ZIKV NS1 protein during infection detected by ELISA. (B) Endpoint titer of serum IgG specific to ZIKV NS1 protein after infection. (C) NS1-specific serum IgG isotype composition during experimental infection were detected by antigen-specific ELISA. (D) Total NS1-specific IgG in serum corresponds to the sum of IgG isotypes, present in distinct proportions after infection. O.D., optical density. (E and F) Sera from ZIKV-infected mice (1:120 dilution) were tested by ELISA for binding to ZIKV and DENV antigens EDIII (E) and NS1 (F). Correlation coefficients show cross-reactivity of EDIII-specific IgG, but not of NS1-specific IgG. Correlations were computed as Pearson’s correlation coefficients. (G) Self-reactivities present in serum IgG (diluted 1:100) from control (M) and infected (Z) mice using muscle extract from BALB/c mice as source of self-antigens. (H) Intensity of bands was quantified and plotted as a heat map. (I) Total immunoreactivity (sum of all bands intensities) present in the sera of infected (ZIKV) and control (MOCK) mice for each time point after infection. Statistical analyses were performed using two-tailed Student’s t test. (J) Principal-component analysis (PCA) of all self-reactivities at all time points. Circle indicates the segregation of the control group. Statistical analyses were performed using two-tailed Student’s t test to compare factor 1 scores of MOCK vs ZIKV. (K) Intensity of reactivities present in serum IgG (diluted 1:100) from control (MOCK) and infected mice (ZIKV) using HEp-2 cell extract as source of self-antigens. (L) Intensity of the reactivity to a selected 60-kD self-antigen throughout time after infection correlates with levels of serum IgG specific to ZIKV NS1 protein, but not with levels of IgG specific to domain III of ZIKV envelope protein (ZEDIII). A.U., arbitrary units. Data for A and B are from one experiment with three mice per group. Data for C and D are from one experiment representative of two independent experiments with 5–16 mice per group. Data for E, F, K, and L are from one experiment representative of two independent experiments with two to three mice per group. Data for G–J are from one experiment representative of two independent experiments (two representative samples per group are shown). Error bars represent SEM.
Figure S2.
Figure S2.
Cross-reactivity with unrelated antigens.(A–F) Sera from ZIKV-infected mice (1:120 dilution) from two independent experiments were tested by ELISA for binding to ZIKV and DENV antigens EDIII (A and B) and NS1 (C and D) as well as unrelated antigens heat shock protein (E and F) Hsp60 and bacterial DNAK from E. coli at different time points. The second experiment ended at 50 d and the third experiment at 60 d. Error bars represent SEM.
Figure 3.
Figure 3.
GC B cells produce both virus-specific and autoreactive antibodies. (A) GC B cells (CD38lo/− GL-7+ gated on B220+ CD138) in the spleen of ZIKV-infected mice at 14 d.p.i. (left). Kinetics of frequencies of FO and GC B cells after infection (right). (B) s.c. infection experimental design indicating the time points of serum samples and lymphoid tissue collections from control mice (MOCK), mice immunized with UV-iZIKV, and infected mice (ZIKV). (C) Kinetics of serum IgG specific to ZIKV NS1 and VLPs. O.D. sum is the summation of ODs of four serum dilutions (1:40, 1:120, 1:360, and 1:1,080). Statistical analyses were performed using two-tailed Student’s t test. ****, P ≤ 0.0001. (D) Representative plots of GC B cells (CD38lo/− GL-7+ gated on B220+ CD138) at day 14 after infection. Mice were injected in the left footpad. (E) Kinetics of frequency of GC B cells in left popliteal LNs after infection (ZIKV) or immunization (iZIKV). (F–H) GC B cells from popliteal LNs of infected mice were sorted, pooled, and cultured in decreasing numbers per well (300, 100, 30, and 10 cells per well). Supernatants were collected on day 7 and screened for IgG secretion by ELISA. Supernatants that revealed the presence of IgG were tested for antigen specificity by ELISA (F and G) or immunoblot against mouse brain tissue as source of self-antigens (H). Frequencies of IgG+ GC B cells that bound NS1 (F), VLP (G), or self-antigens (H) were calculated using Poisson distribution. Self-antigen reactivities used for frequency determination are indicated by arrows (antigen 1, black; antigen 2, red). Cell culture was performed on a monolayer of gamma-irradiated (20 Gy) NB21 feeder cells (Kuraoka et al., 2016; 3 × 10³ cells/well) and LPS (30 µg/ml). Ab, antibody; AG, antigen; MW, molecular weight. Data for A are from one experiment representative of two independent experiments with 8–16 mice per group. Data for D and E are from one experiment representative of two independent experiments with six to nine mice per group. Data for F and G are from one experiment representative of two independent experiments with three mice per group. Data for H are from a single experiment with three mice per group. GC B cells were pooled in culture. Error bars represent SEM.
Figure S3.
Figure S3.
Quantification of the number of responding GC B cell clones per culture. GC B cells from popliteal LNs of ZIKV-infected mice were sorted and cultured in decreasing average number of cells per well (60, 20, 6, 2, and 0.66 cells/well). Supernatants were collected on day 7 and screened for IgG secretion by ELISA. (A) Frequency of GC B cell clones secreting total IgG per culture in response to polyclonal stimuli were calculated using Poisson distribution. (B) Culture supernatants were used to estimate the frequency of GC B cell clones secreting each BALB/c IgG subclass (IgG1, IgG2a, IgG2b, and IgG3). Cell culture was performed on a monolayer of gamma-irradiated (20 Gy) NB21 feeder cells (Kuraoka et al., 2016; 3 × 10³ cells/well) and LPS (30 µg/ml). Data from one experiment with three mice per group. GC B cells from all mice in each group were pooled in culture.
Figure 4.
Figure 4.
Antigen specificity of B cells in GCs after immunization with ZIKV VLP and NS1. (A) Experimental design indicating the time points of serum samples and popliteal LNs collections after immunization with NS1 (2 μg/mouse), VLP (2 μg/mouse) or both (2 μg of NS1 and 2 μg of VLP/mouse). Immunizations were adjuvanted with R848 (1 μg/mouse). (B) Kinetics of serum levels of IgG binding to ZIKV NS1 recombinant protein or ZIKV VLP, measured by ELISA. O.D. sum is the sum of ODs of four serum dilutions (1:40, 1:120, 1:360, and 1:1,080). (C) Representative plots of GC B cells (CD38lo/− GL-7+ gated on B220+ CD138) at day 14 after immunization. Mice were immunized on the left footpad. (D) Kinetics of frequency of GC B cells in left popliteal LNs after immunization. (E) GC B cells from popliteal LNs of immunized mice were sorted and cultured in decreasing numbers per well (300, 100, 30, and 10 cells per well). Supernatants were collected on day 7 and screened for IgG secretion by ELISA. Supernatants that revealed the presence of IgG were tested for antigen specificity by ELISA. Frequencies of IgG+ GC B cells that bound VLP (upper panel) or NS1 (lower panel) were calculated using Poisson distribution and are summarized on the right graph. n.d., not detected. Cell culture was performed on a monolayer of gamma-irradiated (20 Gy) NB21 feeder cells (Kuraoka et al., 2016; 3 × 10³ cells/well) and LPS (30 µg/ml). (F) OD of IgG+ supernatants of different cell numbers/well binding to ZIKV NS1, measured by ELISA. Data are representative of two independent experiments with nine mice per group. Error bars represent SEM.
Figure 5.
Figure 5.
Characterization of B cell repertoire present in GCs after ZIKV NS1 immunization. (A) Single GC B cells from mice immunized s.c. with recombinant ZIKV NS1 or DENV NS1 were sorted at indicated time points after immunization, and Igh gene was sequenced. Pie charts represent clonal diversity found in all LNs analyzed. Slices represent clonotypes assigned based on VH and JH usage and CDR-H3 length and sequence. Slice size is proportional to the frequency of each clone. Black slices indicate clone counts higher than four. Dark gray slices indicate clone counts of two or three. Light gray where slices are not delimited represents single clones. Proportion of expanded clones is indicated on the right. (B) Number of somatic mutations found in VH segments separated by singletons versus expanded clones. (C) Number of somatic mutations found in VH segments at different time points separated by clone count. (D) CDR-H3 average hydrophobicity index variation among all sequences at indicated time points after immunization. (E) Comparison of CDR-H3 average hydrophobicity index distribution among all sequences from mice immunized with ZIKV NS1 or DENV NS1 (upper panel) and comparison between expanded (clonotypes found more than once in the same LN) and single clones from mice immunized with ZIKV NS1 (lower panel). Dashed red line indicates the distribution of CDR-H3 average hydrophobicity in FO B cells from WT BALB/c mice. The normalized Kyte–Doolittle hydrophobicity scale (Kyte and Doolittle, 1982) was used to calculate average hydrophobicity. (F) Divergence in the distribution of individual amino acid usage in the CDR-H3 loop between ZNS1- and DNS1-immunized mice at each time point. Red bars indicate charged amino acids, green bars represent neutral amino acids, and blue bars represent hydrophobic amino acids. Arrows indicate enrichment in arginine (R) and glycine (G) in ZIKV NS1 CDR-H3 loops. (G) Difference in number of hydrophobic and charged amino acids among all sequences from DENV NS1–immunized mice (gray) and ZIKV NS1–immunized mice (black). GC B cells were sorted and sequenced from individual LNs and pooled for analyses (two to four mice per group from two independent experiments).Statistical analyses were performed using the unpaired two-tailed Student’s t test. Error bars represent SEM.
Figure S4.
Figure S4.
Analysis of VH family usage and CDR-H3 length of Igh transcripts from B cells present in GCs after ZIKV NS1 or DENV NS1 immunization.(A) Expression of each VH family as a percentage of total functional transcripts from GC B cells at each time point after immunization with ZIKV NS1 or DENV NS1. (B) CDR-H3 loop length variation at each time point after immunization with ZIKV NS1 or DENV NS1. (C) CDR-H3 loop length distribution of all sequences at all time points (upper panel) and comparison between clonal (clonotypes found more than once in the same LN) and single clones from mice immunized with ZIKV NS1 (lower panel). Dashed red line indicates the distribution of CDR-H3 length in FO B cells from WT BALB/c mice. GC B cells were sorted and sequenced from individual LNs and pooled for analyses (two to four mice per group from two independent experiments). Error bars represent SEM.
Figure 6.
Figure 6.
Self-reactivity of GC B cells after ZIKV NS1 immunization. Single GC B cells were sorted and cultured on a monolayer of gamma-irradiated NB21 feeder cells (103 cells/well; Kuraoka et al., 2016). After 7 d, supernatants were collected for binding assays, and cells were harvested for Igh sequencing. (A) Frequency of IgG+ single GC B cell culture supernatants that bound to ZIKV NS1 per LN. IgG+ wells were tested for binding to ZIKV NS1 protein by ELISA. (B) Clonal distribution of GC B cells found to bind to NS1 (upper panel) or that did not bind to NS1 (lower panel). Size of the slice is proportional to the clone frequency. Colored slices represent variants of clones that were found both as binders and nonbinders. Right panel represents the frequency of expanded clones among binders and nonbinders at specific time points after immunization. (C) Number of somatic mutations found in VH segments from each GC B cell sequenced grouped based on binding to NS1. (D) CDR-H3 average hydrophobicity index variation at different time points grouped by binding to NS1. Statistical analyses were performed using the unpaired two-tailed Student’s t test. (E) NS1 binding by ELISA OD related to the presence of charged amino acids. Red dots indicate the presence of three or more charged amino acids in CDR-H3 at different time points. (F–I) Single GC B cell culture supernatants were tested for binding to self-antigens by immunoblot. (F) Representatives immunoblot profiles of monoclonal IgG from single GC B cell culture supernatants binding to mouse brain extract. Arrows indicate immunoreactivities highlighted in the main text. (G) Immunoreactivity profile of two poly-reactive variants from the clonal family bearing “glycine-enriched CDR-H3” (ARGGGYDGFAY) found among GC B cells from mice 14 d.p.i. with ZIKV NS1. (H) Immunoreactivity profile of the autoreactive clonotype ARGTLYAMDY and its two more mutated variants, ARGTLYTMDY (nonautoreactive) and ARGTLYSMDY (autoreactive). (I) Clonotype counts of NS1 binders (black dots) and NS1 non binders (white dots) separated by self-reactivity. Color-coded dots represent variants of clones described in the main text. (J) Number of somatic mutations found in VH segments grouped by binding to NS1 and self-reactivity. Color coded dots represent variants of clones described in the main text. (K) Clonality, SHM, binding to NS1, self-reactivity, hydrophobicity, and charged amino acid usage by time after immunization. Clonality corresponds to the number of variants of each clonotype found in the dataset. SHM is represented by the number of VH mutations found in each sequence. Anti-ZNS1 indicates the OD obtained by ELISA. Self-reactivity corresponds to the number of bands found for each supernatant in mouse tissue extracts (brain and/or muscle). Hydrophobicity corresponds to the average hydrophobicity of the CDR-H3 loop, and hydrophobic and charged CDR-H3 sequences are shown in blue and red, respectively. Charged AA indicates the number of charged amino acids found in the CDR-H3 loop. GC B cells were sorted and sequenced from individual LNs and pooled for analyses (two to four mice per group from two independent experiments). Error bars represent SEM.
Figure S5.
Figure S5.
Antigen specificity of B cells in GCs after immunization with OVA. BALB/c mice were immunized s.c. with OVA (2 μg/mouse) combined with R848 (1 μg/mouse). When indicated, a booster immunization was performed on day 7 after prime. (A) Kinetics of serum levels of IgG binding to OVA, measured by ELISA. O.D. sum is the summation of ODs of four serum dilutions (1:40, 1:120, 1:360, and 1:1,080). (B and C) Single GC B cell (B) or pooled GC B cells (C) were sorted and cultured on a monolayer of gamma-irradiated NB21 feeder cells (103 cells/well; Kuraoka et al., 2016). After 7 d, supernatants were collected for binding assays. Supernatants were screened for IgG production and IgG+ wells were tested for binding to OVA protein by ELISA or immunoblot against mouse brain tissue as source of self-antigens. Ctrl, serum from ZIKV infected mice. One experiment was performed with three mice.

Comment in

  • A dark side to NS1 antibodies?
    Robbiani DF, Růžek D. Robbiani DF, et al. J Exp Med. 2021 Sep 6;218(9):e20211348. doi: 10.1084/jem.20211348. Epub 2021 Jul 28. J Exp Med. 2021. PMID: 34319348 Free PMC article.

References

    1. Akey, D.L., Brown W.C., Dutta S., Konwerski J., Jose J., Jurkiw T.J., DelProposto J., Ogata C.M., Skiniotis G., Kuhn R.J., and Smith J.L.. 2014. Flavivirus NS1 structures reveal surfaces for associations with membranes and the immune system. Science. 343:881–885. 10.1126/science.1247749 - DOI - PMC - PubMed
    1. Akkaya, M., Akkaya B., Kim A.S., Miozzo P., Sohn H., Pena M., Roesler A.S., Theall B.P., Henke T., Kabat J., et al. . 2018. Toll-like receptor 9 antagonizes antibody affinity maturation. Nat. Immunol. 19:255–266. 10.1038/s41590-018-0052-z - DOI - PMC - PubMed
    1. Alvim, R.G.F., Itabaiana I. Jr., and Castilho L.R.. 2019. Zika virus-like particles (VLPs): Stable cell lines and continuous perfusion processes as a new potential vaccine manufacturing platform. Vaccine. 37:6970–6977. 10.1016/j.vaccine.2019.05.064 - DOI - PubMed
    1. Andersson, J., Coutinho A., Lernhardt W., and Melchers F.. 1977. Clonal growth and maturation to immunoglobulin secretion in vitro of every growth-inducible B lymphocyte. Cell. 10:27–34. 10.1016/0092-8674(77)90136-2 - DOI - PubMed
    1. Andreano, E., and Rappuoli R.. 2021. Immunodominant antibody germlines in COVID-19. J. Exp. Med. 218:e20210281. 10.1084/jem.20210281 - DOI - PMC - PubMed

Publication types