. 2021 Jul 22;138(3):234-245.
doi: 10.1182/blood.2020009081.

Venetoclax enhances T cell-mediated antileukemic activity by increasing ROS production

Affiliations

Venetoclax enhances T cell-mediated antileukemic activity by increasing ROS production

Jong Bok Lee et al. Blood. .

Erratum in

Abstract

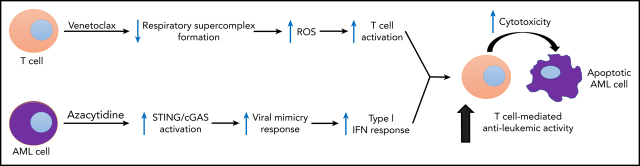
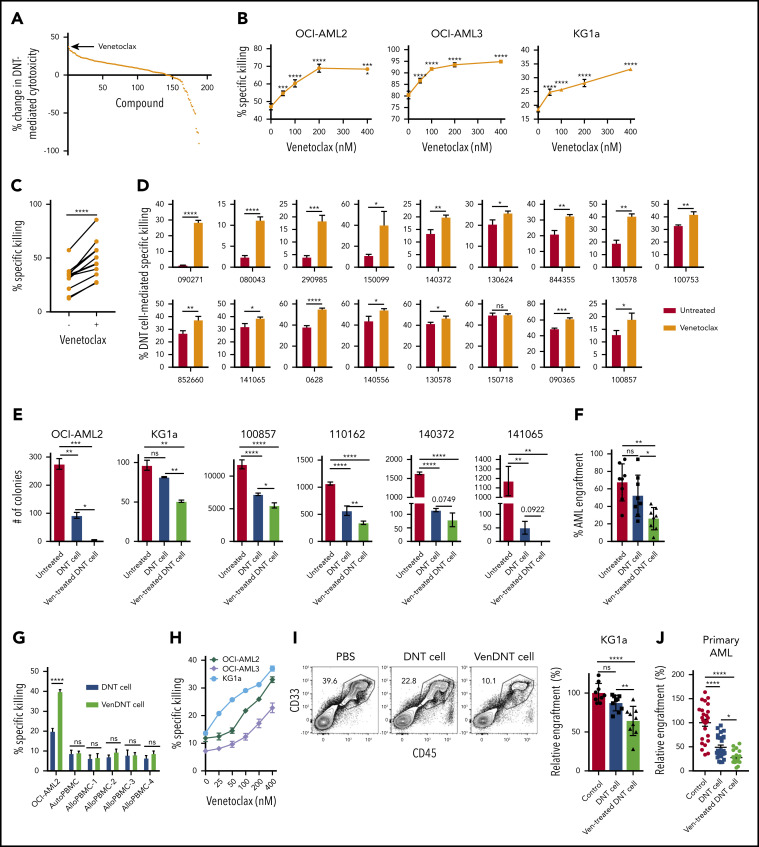
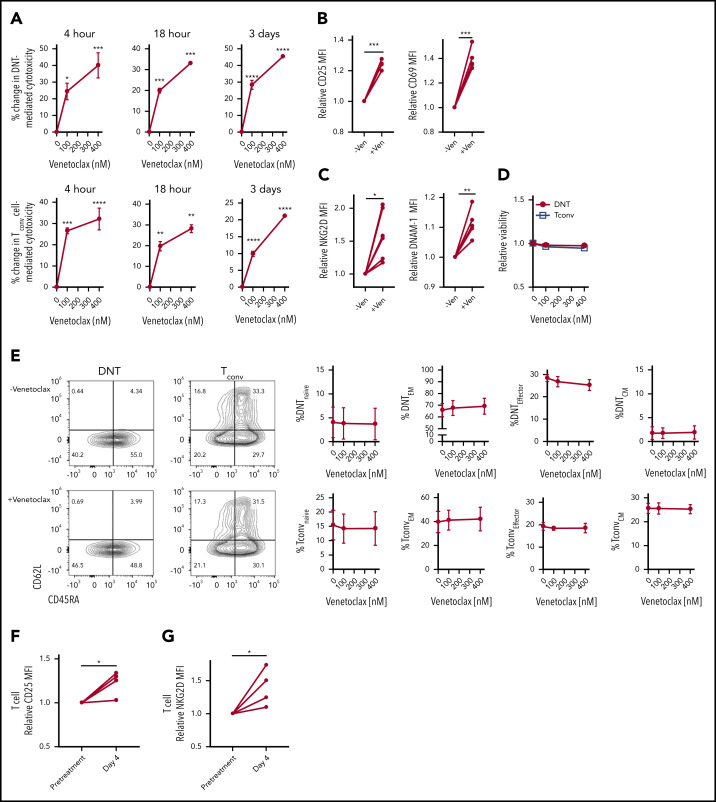
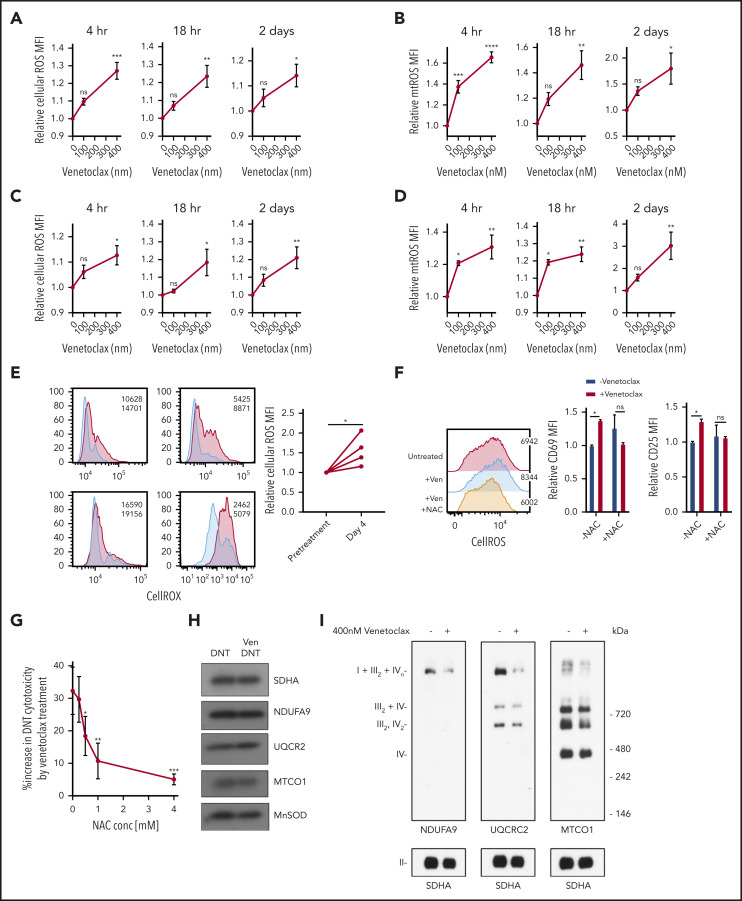
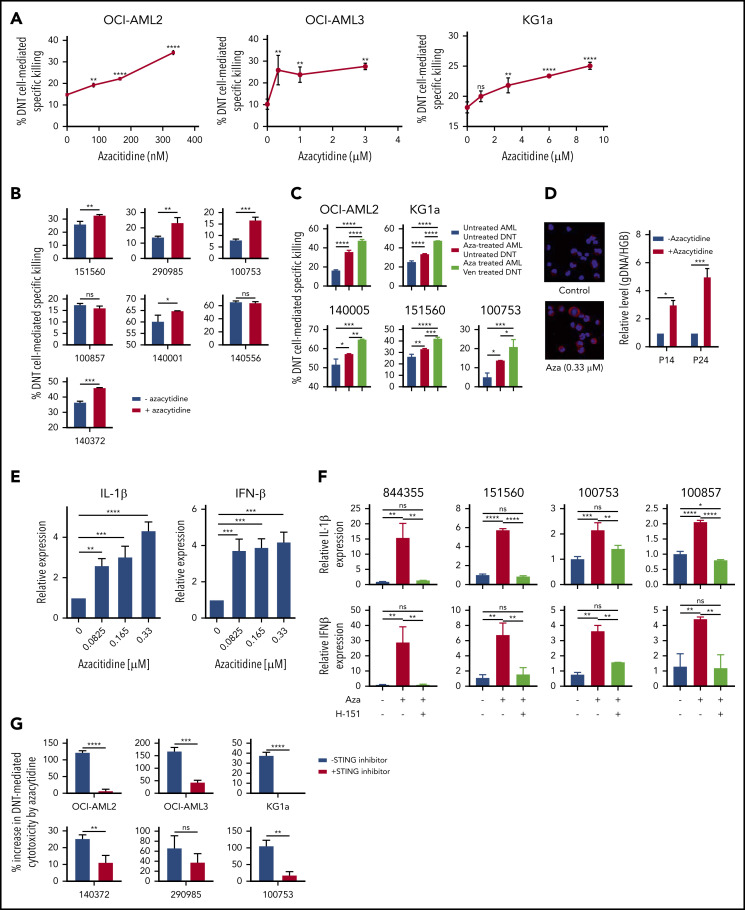
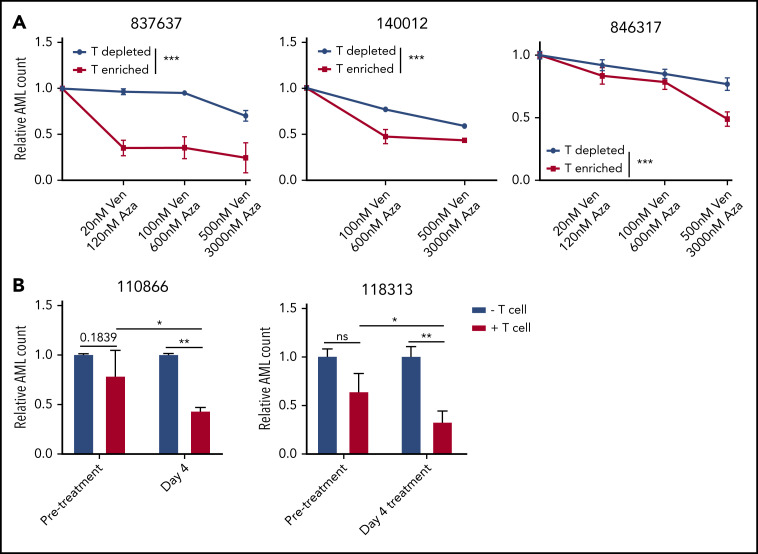
Venetoclax, a Bcl-2 inhibitor, in combination with the hypomethylating agent azacytidine, achieves complete remission with or without count recovery in ∼70% of treatment-naive elderly patients unfit for conventional intensive chemotherapy. However, the mechanism of action of this drug combination is not fully understood. We discovered that venetoclax directly activated T cells to increase their cytotoxicity against acute myeloid leukemia (AML) in vitro and in vivo. Venetoclax enhanced T-cell effector function by increasing reactive oxygen species generation through inhibition of respiratory chain supercomplexes formation. In addition, azacytidine induced a viral mimicry response in AML cells by activating the STING/cGAS pathway, thereby rendering the AML cells more susceptible to T cell-mediated cytotoxicity. Similar findings were seen in patients treated with venetoclax, as this treatment increased reactive oxygen species generation and activated T cells. Collectively, this study presents a new immune-mediated mechanism of action for venetoclax and azacytidine in the treatment of AML and highlights a potential combination of venetoclax and adoptive cell therapy for patients with AML.


Figures

None
Graphical abstract
Figure 1.
Figure 1.
Venetoclax increases antileukemic activity of T cells. (A) A total of 189 drugs were added to ex vivo expanded DNTs (50 000 cells per well) in 96 well plates at a final concentration of 400 nM for 18 hours. The compound-treated DNTs were washed and incubated with OCI-AML2 at a 2:1 ratio for 2 hours. AML cell viability was determined by Annexin V using flow cytometry. Data represent the change in cytotoxicity relative to untreated DNT control. (B) DNTs were treated with increasing concentrations of venetoclax for 18 hours followed by coculture for 2 hours with OCI-AML2 and OCI-AML3 at a 2:1 and KG1a at an 8:1 DNT to AML ratio. The viability of AML cells (CD3 CD33+ or CD34+) was determined as described in panel A. Each experiment was done in triplicate, and data represent the mean ± SD specific killing from 1 of 5 independent experiments conducted by using DNTs from different donors. (C) DNTs expanded from 11 donors were untreated or treated with 400 nM venetoclax for 18 hours. Subsequently, they were cultured with OCI-AML2 at a 1:1, 2:1, or 4:1 DNT:AML ratio, and the viability of AML cells was measured by Annexin V staining and flow cytometry. Each paired symbol represents DNTs from an individual donor. (D) Venetoclax 400 nM treated or untreated DNTs were cocultured with primary AML samples (n = 17) at a 2:1 ratio for 2 hours. After incubation, cell viability was measured as described in panel A. Each sample was measured in triplicate, and data represent the changes in AML cell death in the presence of venetoclax-treated DNTs relative to untreated DNTs. DNTs from 6 different donors were used for the screening. (E) OCI-AML2, KG1a, or primary AML cells (100857) were treated with DNT or venetoclax-treated (Ven-treated) DNTs for 18 hours. Equal volumes (105 cells per mL per dish) of cells were seeded in colony-forming assays, and the colonies were counted. Data represent mean ± SD of number of colonies formed. The results for OCI-AML2 and KG1a are representative of 3 independent experiments conducted by using DNTs from 2 different donors. (F) Primary AML cells (ID: 130607) untreated or treated with DNTs or venetoclax-treated DNTs for 2 hours at a 2:1 DNT:AML ratio were injected intrafemorally into NOD/SCID mice (1.6 × 10⁶ cells per mouse; n = 6 per group). Six weeks after injection, the percentage of AML engraftment (human CD45+ CD33+ cells) in the bone marrow from each group was determined by flow cytometry. (G) OCI-AML2, autologous PBMCs, or allogeneic PBMCs (n = 4) were used as targets and cultured with DNTs or venetoclax-treated DNTs for 2 hours at a 2:1 DNT to AML ratio or 8:1 DNT to PBMC ratio. The viability of AML cells and PBMCs was determined by Annexin V. Data represent the mean ± SD specific killing. The results are representative of 2 independent experiments. (H) Ex vivo expanded polyclonally activated CD4+/CD8+ Tconv cells were treated with increasing concentrations of venetoclax for 18 hours. Tconv cells were added as effectors against OCI-AML2, OCI-AML3, and KG1a at a 4:1 target ratio. Two hours after incubation, AML cell viability was determined by Annexin V. Data represent the mean ± SD specific killing from 1 of 5 independent experiments. (I) Sublethally irradiated (250 cGy) NSG mice were injected intravenously with KG1a cells (2 × 10⁶ cells per mouse). Two weeks post-KG1a infusion, mice were treated with 3 infusions of vehicle control (phosphate-buffered saline [PBS]) or 1.5 to 2 × 10⁷ cells per infusion of DNTs or venetoclax-treated DNTs 3 to 4 days apart. Five weeks post–AML injection, bone marrow engraftment of KG1a (human CD45+ CD34+) was determined by using flow cytometry. The result shown is representative of 2 independent experiments conducted by using 2 different donor-derived DNTs. (J) Sublethally irradiated NSG mice were intravenously injected with primary AML cells (n = 4; 2-5 × 10⁶ per mouse). Two weeks later, mice were treated with 3 infusions of vehicle control or 1.5 to 2 × 10⁷ cells per infusion of DNTs or venetoclax-treated DNTs, 3 to 4 days apart. Five weeks post–AML injection, bone marrow engraftment of primary AML cells (human CD45low CD33+ with or without CD34 expression) was determined by flow cytometry. Left: representative contour plot of bone marrow cells from each group stained with CD45 and CD33. Right: summarized results from patient-derived xenograft experiments performed by using 4 different primary AML patient samples. Horizontal bar represents the mean of bone marrow AML engraftment level normalized to vehicle control group; each symbol represents an individual mouse, and error bars represent SD. Data represent the mean ± SEM reduction in bone marrow leukemia level relative to the PBS group. Student t test or 1-way analysis of variance was used for statistics. *P < .05; **P < .01; ***P < .001; ****P < .0001. ns, not significant.
Figure 2.
Figure 2.
Venetoclax rapidly and directly increases cytotoxicity of T cells against AML. (A) DNT (top panels) and Tconv cells (bottom panels) were untreated or treated with venetoclax (100 nM and 400 nM) for 4 hours, 18 hours, and 3 days. Subsequently, their cytotoxicity against OCI-AML2 was determined. Data represent the mean ± standard error of the mean of results from 4 different donor T cells. (B-C) Median fluorescence intensity (MFI) of T-cell activation markers, CD25 and CD69 (B), activation molecules, NKG2D and DNAM-1 (C) measured on DNTs untreated or treated with venetoclax (400 nM) for 18 hours. (D-E) DNT and Tconv cells untreated or treated with venetoclax (100 nM or 400 nM) for 4 hours. Subsequently, their viability (D) and frequency of T-cell memory subsets (E) were determined. Data represent the mean ± SEM of results from 4 different donor T cells. (F-G) Expression of CD25 (F) and NKG2D (G) of T cells obtained from 4 patients with AML before and at day 4 of venetoclax and azacytidine treatment. Student t test or 1-way analysis of variance was used for statistics. *P < .05; **P < .01; ***P < .001; ****P < .0001.
Figure 3.
Figure 3.
Venetoclax increases ROS level to enhance T-cell effector function. (A-D) DNT (A-B) or Tconv cells (C-D) were treated with 0 nM, 100 nM, or 400 nM venetoclax for 4 hours, 18 hours, and 2 days. Cells were stained with CellROX (A,C) or MitoSOX (B,D). Median fluorescence intensity (MFI) of cellular or mitochondrial (mt) ROS was measured by using flow cytometry. Data represent the mean ± SEM of results from 4 different donor T cells. (E) Cellular ROS level in T cells obtained from 4 patients with AML before and during venetoclax and azacytidine treatment were determined by using flow cytometry. Flow histogram shows the CellROX staining for each patient’s T cells. Blue represents cellular ROS level in T cells from pretreatment samples and red represents those from day 4 of treatment. (F) DNTs treated with 400 nM venetoclax with or without 2 mM NAC for 18 hours. Flow histogram shows the cellular ROS level measured by using flow cytometry. MFI of CD25 and CD69 were measured by flow cytometry. Experiments were done in triplicate, and the data shown are representative of 2 independent experiments conducted by using DNTs from 2 donors. (G) DNTs treated with 400 nM venetoclax in the presence of increasing concentrations of NAC for 18 hours followed by coculture with OCI-AML2 for 2 hours at a 2:1 DNT:AML ratio. Experiments were done in triplicate, and data represent the percent increase in DNT-mediated cytotoxicity by venetoclax ± SD specific killing from 1 of 3 independent experiments done using DNTs from 3 different donors. (H) DNT cells were treated with 400 nM venetoclax for 18 hours. After treatment, mitochondria were isolated and levels of respiratory chain complex subunits were measured by sodium dodecyl sulfate–polyacrylamide gel electrophoresis gels and immunoblotting with antibodies against NDUFB8 (complex I), SDHA (complex II), UQCRC2 (complex III), and MTCO1 (complex IV). (I) Mitochondrial fractions were isolated after DNTs were treated with 400 nM venetoclax for 18 hours. Complex and respiratory chain supercomplex assembly were measured by blue native–polyacrylamide gel electrophoresis with antibodies against NDUFB8 (complex I), SDHA (complex II), UQCRC2 (complex III), and MTCO1 (complex IV). The results shown are representative of 3 independent experiments conducted by using DNTs from 3 different donors. Student t test or 1-way analysis of variance was used for statistics. *P < .05; **P < .01; ***P < .001; ****P < .0001.
Figure 4.
Figure 4.
Azacytidine sensitizes AML to DNT-mediated cytotoxicity and produces a viral mimicry response. (A-B) AML cell lines (A; OCI-AML2, OCI-AML3, and KG1a) and primary AML samples (B; n = 7) were treated with azacytidine for 5 days followed by coculture with DNTs at a 2:1 DNT:AML ratio for OCI-AML2, OCI-AML3, and primary AML samples or an 8:1 DNT:AML ratio for KG1a. Two hours after coincubation, percent specific killing of AML cells by DNTs was determined by flow cytometry. (C) AML cell lines (OCI-AML2 and KG1a) and primary AML cells (n = 3) were untreated or treated with azacytidine (0.3-9 μM) for 5 days, followed by coculture with untreated or venetoclax-treated (400 nM for 18 hours) DNTs for 2 hours. AML cell viability was measured by Annexin V and flow cytometry. (D) Left panel: OCI-AML2 cells were untreated or treated with azacytidine (0.33 μM) for 5 days. After the treatment period, cells were cytospun, fixed with 4% paraformaldehyde, and immunostained with anti-dsDNA antibody. DNA was stained by 4′,6-diamidino-2-phenylindole. Right panel: DNA was isolated from the cytoplasmic fraction of the OCI-AML2 cells treated with or without azacytidine. The relative level of cytosolic genomic DNA of transposon origin was analyzed by quantitative polymerase chain reaction by using transposon DNA 14 (P14) and 24 (P24) specific primers and nuclear human globulin gene (HGB). Data represent the mean ± SD relative to untreated cells. (E) OCI-AML2 cells were untreated or treated with azacytidine (0.08-0.33 μM) for 5 days. The relative expression of IL-1β and IFN-1β was analyzed by quantitative reverse transcription polymerase chain reaction. Data are relative mean ± SD (n = 3; untreated = 1.0). (F) Primary AML cells were untreated or treated with azacytidine (3 or 9 μM) for 5 days in the presence or absence of the STING inhibitor H-151. The relative expression of 1L-1β (top) and IFN-1β (bottom) were analyzed by quantitative reverse transcription polymerase chain reaction. The experiments were conducted by using DNTs from 4 different donors. (G) AML cell lines (OCI-AML2, OCI-AML3, and KG1a) and primary AML cells (n = 3) were treated with azacytidine (0.3-3 μM) for 5 days with or without the STING inhibitor (H-151). Data represent the mean ± SD increase in DNT-mediated cytotoxicity by azacytidine-treated AML relative to the untreated control. Student t test or 1-way analysis of variance was used for statistics. *P < .05; **P < .01; ***P < .001; ****P < .0001.
Figure 5.
Figure 5.
T cells influence cytotoxicity of venetoclax and azacytidine in AML. (A) PBMCs obtained from 3 patients with AML (837637, 140012, and 846317) were depleted or enriched for autologous T cells, followed by treatment with increasing concentrations of venetoclax (0-500 nM) and azacytidine (0-3000 nM) (1 day for 140012 or 2 days for 837637 and 846317). The cells were stained with Annexin V, and the relative number of viable AML cells was determined by flow cytometry. (B) AML cells obtained from patients (110866 and 118313) before venetoclax and azacytidine treatment were cultured with or without autologous T cells isolated from the same patient with AML before or on day 4 of venetoclax and azacytidine treatment (day 4). The cells were stained with Annexin V, and the relative numbers of viable AML cells was determined by flow cytometry. Student t test or 2-way analysis of variance was used for statistics. *P < .05; **P < .01; ***P < .001.

References

    1. Park JH, Rivière I, Gonen M, et al. Long-term follow-up of CD19 CAR therapy in acute lymphoblastic leukemia. N Engl J Med. 2018;378(5):449-459. - PMC - PubMed
    1. Ruella M, Barrett DM, Kenderian SS, et al. Dual CD19 and CD123 targeting prevents antigen-loss relapses after CD19-directed immunotherapies. J Clin Invest. 2016;126(10):3814-3826. - PMC - PubMed
    1. Lee JB, Chen B, Vasic D, Law AD, Zhang L. Cellular immunotherapy for acute myeloid leukemia: How specific should it be? Blood Rev. 2019;35:18-31. - PubMed
    1. Pollyea DA, Stevens BM, Jones CL, et al. Venetoclax with azacitidine disrupts energy metabolism and targets leukemia stem cells in patients with acute myeloid leukemia. Nat Med. 2018;24(12):1859-1866. - PMC - PubMed
    1. DiNardo CD, Pratz K, Pullarkat V, et al. Venetoclax combined with decitabine or azacitidine in treatment-naive, elderly patients with acute myeloid leukemia. Blood. 2019;133(1):7-17. - PMC - PubMed

Publication types

MeSH terms