. 2021 Sep;8(18):e2101619.
doi: 10.1002/advs.202101619. Epub 2021 Jul 22.

Colon-Targeted Adhesive Hydrogel Microsphere for Regulation of Gut Immunity and Flora

Affiliations

Colon-Targeted Adhesive Hydrogel Microsphere for Regulation of Gut Immunity and Flora

Hua Liu et al. Adv Sci (Weinh). 2021 Sep.

Abstract

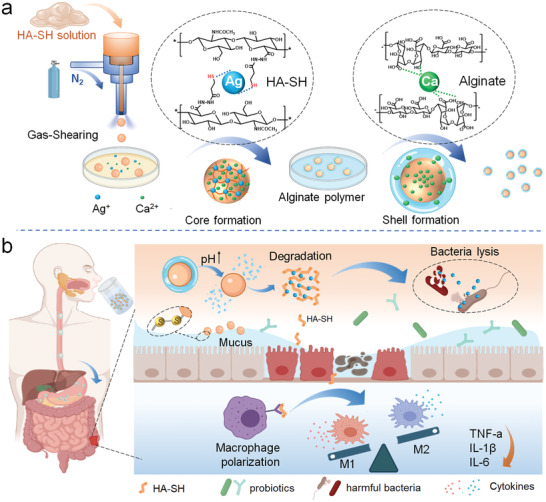
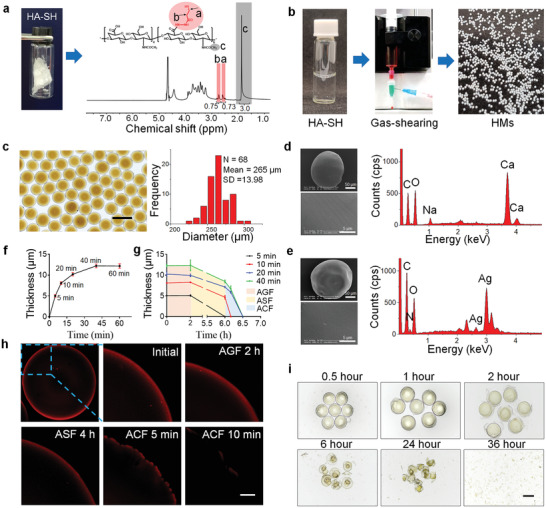
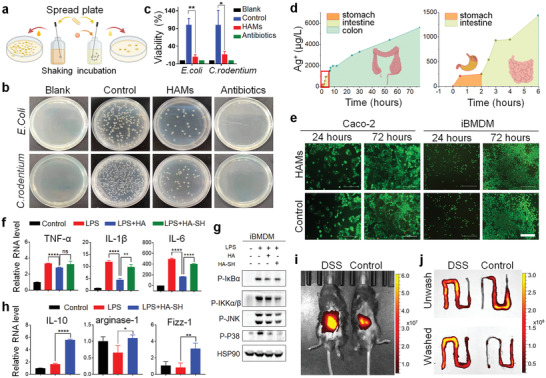
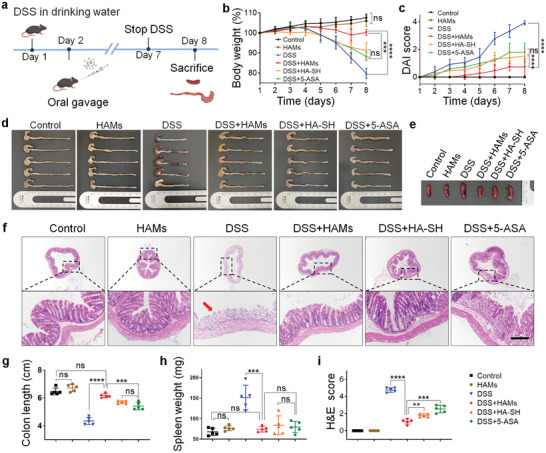
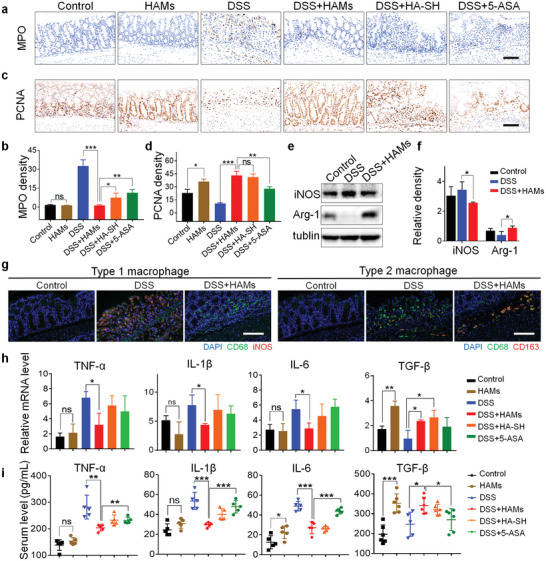
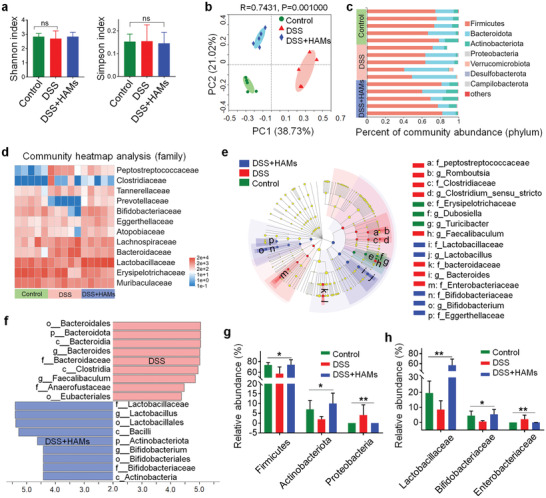
Intestinal immune homeostasis and microbiome structure play a critical role in the pathogenesis and progress of inflammatory bowel disease (IBD), whereas IBD treatment remains a challenge as the first-line drugs show limited therapeutic efficiency and great side effect. In this study, a colon-targeted adhesive core-shell hydrogel microsphere is designed and fabricated by the ingenious combination of advanced gas-shearing technology and ionic diffusion method, which can congregate on colon tissue regulating the gut immune-microbiota microenvironment in IBD treatment. The degradation experiment indicates the anti-acid and colon-targeted property of the alginate hydrogel shell, and the in vivo imaging shows the mucoadhesive ability of the thiolated-hyaluronic acid hydrogel core of the microsphere, which reduces the systematic exposure and prolongs the local drug dwell time. In addition, both in vitro and in vivo study demonstrate that the microsphere significantly reduces the secretion of pro-inflammatory cytokines, induces specific type 2 macrophage differentiation, and remarkably alleviates colitis in the mice model. Moreover, 16S ribosomal RNA sequencing reveals an optimized gut flora composition, probiotics including Bifidobacterium and Lactobacillus significantly augment, while the detrimental communities are inhibited, which benefits the intestinal homeostasis. This finding provides an ideal clinical candidate for IBD treatment.

Keywords: colitis; colon-targeted drug delivery; gut microbiota; hydrogel microsphere; oral administration.


Conflict of interest statement

The authors declare no conflict of interest.

Figures

Scheme 1
Scheme 1
Hydrogel microsphere with core‐shell structure for the colon‐targeted treatment of colitis. a) The gas‐shearing technology was applied to fabricate the HA‐SH‐Ag hydrogel microsphere (HMs) with uniform size, while calcium diffusion from the inside of the microspheres to the surface crosslinks alginate and thus encapsulate core microsphere. b) Oral administrated HA‐SH‐Ag/Alginate‐Ca microspheres (HAMs) target colon to collapse and release HMs. HMs accumulate in inflamed colon mucosa, regulate gut inflammation by suppressing the secretion of pro‐inflammatory cytokines and inducing type 2 (M2) macrophage differentiation dominated immune response, and optimize the composition of gut flora through augmenting probiotics abundance and restraining the detrimental bacterial community.
Figure 1
Figure 1
Synthesis of HA‐SH and Preparation of HAMs. a) A photograph (left) and a proton nuclear magnetic resonance spectrum (right) of HA‐SH. The substitution degree of the sulfhydryl group (≈37%) was determined by the integration of the methylene peaks (a and b, red shading) relative to the methyl group of HA (c, grey shading). b) The HA‐SH aqueous solution (left) was fabricated into the HMs (right) by utilizing a gas‐shearing device (middle). c) Optical image of the obtained HMs (top) and the size distribution of the microspheres (bottom). Scale bar 400 µm. d) Representative image of scanning electron microscopy and the elemental analysis of HMs. e) Representative image of scanning electron microscopy and the elemental analysis of HAMs. f) The thickness of the shell that formed by crosslinking alginate with calcium ion (Ca2+) changes with the length of dwell time (5, 10, 20, 40, and 60) in sodium alginate solution. g) The changes of shell thickness of microspheres in artificial gastric fluid (AGF, pH 1.0), artificial small intestine fluids (ASF, pH 6.8), and artificial colon fluid (ACF, pH 7.8). h) Representative images of the degradation process of alginate hydrogel shell (red) in AGF, ASF, and ACF successively. Scale bar 20 µm. i) HMs degrade slowly in the presence of hyaluronidase. Scale bar 200 µm.
Figure 2
Figure 2
Characteristics of HAMs. a) Schematic illustration of the anti‐bacterial experiment. b) The anti‐bacterial activity of HAMs was shown by the spread plate method. c) The bacterial viability of Escherichia coli (E. coli) and Citrobacter rodentium (C. rodentium) in (b) were measured by colony count. The experiment was repeated three times. d) The silver ion (Ag+) release from 100 mg HAMs in 1 mL artificial gastric, intestinal, and colon fluids was detected by inductively coupled plasma mass spectrometer. e) The cytotoxicity of HAMs was examined in Caco‐2 and immortalized bone marrow‐derived macrophage (iBMDM) by using the calcein acetoxymethyl ester/propidium iodide cell viability kit. Scale bar 500 µm. f) mRNA expression of the cytokines including interleukin‐6 (IL‐6), interleukin‐1β (IL‐1β), and tumor necrosis factor‐α (TNF‐α). g) Western blot analysis of protein level of phosphorylated inhibitor of nuclear factor κB (P‐IκBα) and phosphorylated inhibitory kappa B kinase α/β (P‐IKKα/β), phosphorylated‐P38 and phosphorylated c‐Jun N‐terminal kinase (P‐JNK) in iBMDM with different treatment. h) mRNA levels of M2 macrophage‐related genes, including interleukin‐10 (IL‐10), arginase‐1, and found in inflammatory zone‐1 (Fizz‐1). i,j) Healthy mice and mice with dextran sulfate sodium (DSS)‐induced colitis were imaged by in vivo imaging system after the oral gavage of indocyanine green (ICG)‐HAMs, and the intestine with strong signals was removed and then imaged before and after washing. The experiments were repeated three times. Significance between every two groups was assessed by using Mann–Whitney U‐test. ns, not significant; * p < 0.05, ** p < 0.01, **** p < 0.0001.
Figure 3
Figure 3
Excellent therapeutic efficacy of HAMs in the mice model with DSS‐induced colitis. a) Experimental design. The mice were provided with sterile water or water containing 3% DSS for 7 days. Oral administration of treatments was given from the second day. All mice were sacrificed two days after DSS drinking stopped. b) Daily changes of body weight were recorded in detail and analyzed, n = 5. c) Everyday disease activity index (DAI) scores were calculated and analyzed, n = 5. d) Macroscopic colon appearance of each group was shown, n = 5 per group. e) Representative macroscopic spleen appearance of each group. f) Representative hematoxylin and eosin (H&E) staining images of colon tissue of each group. Scale bar is 200 µm. g) Colon length was measured and analyzed, n = 5. h) Spleen weight was measured and analyzed, n = 5. i) Colonic damage scores according to H&E staining were analyzed in each group. Significance between every two group was assessed by using Mann–Whitney U‐test; ns, not significant; * p < 0.05, ** p < 0.01, *** p < 0.001, **** p < 0.0001.
Figure 4
Figure 4
HAMs inhibit intestinal inflammation and prompt tissue repair. a) Representative immunohistochemical staining of myeloperoxidase (MPO); scale bar is 100 µm. b) The semi‐quantitative analysis of immunohistochemistry staining of MPO. c) Representative immunohistochemical staining of proliferating cell nuclear antigen (PCNA); scale bar is 100 µm. d) The semi‐quantitative analysis of immunohistochemistry staining of PCNA. e) Representative image of western blot analysis of inducible nitric oxide synthase (iNOS) and arginase‐1 (Arg‐1) level in mice colon tissue. f) Relative iNOS and Arg‐1 levels were quantified by ImageJ software. g) Immunofluorescence analysis of type 1 macrophage (iNOS red, CD68 green, and 4′,6‐diamidino‐2‐phenylindole [DAPI] blue) and type 2 macrophage (CD163 red, CD68 green, and DAPI blue) in colon tissue visualized under confocal microscopy' scale bar is 100 µm. h) Colonic mRNA levels of TNF‐α, IL‐1β, IL‐6, and transforming growth factor‐β (TGF‐β). i) The serum concentration of IL‐6, IL‐1β, TNF‐α, and TGF‐β. Significance between every two groups was assessed by using Mann–Whitney U‐test. ns, not significant; * p < 0.05, ** p < 0.01, *** p < 0.001.
Figure 5
Figure 5
16S ribosomal RNA (rRNA) sequencing analysis of gut microbiota regulated by HAMs. a) Shannon and Simpson index of observed operational taxonomic units showed the α‐diversity of the microbial community. b) Principal co‐ordinates analysis showed the β‐diversity of the gut microbiome. Each point represents each mouse and n = 5 for each group. The significance of clustering was determined using analysis of similarities (ANOSIM). c) Community histogram showed the microbial compositional profiling at the phylum level. Each row represents each mouse and n = 5 for each group. d) Heatmap exhibited the relative abundance of microbial compositional profiling at a family level. Each column represents each mouse and n = 5 for each group. e) A cladogram showed the difference in richness and the group with a significant difference in abundance. The brightness of each dot is proportional to its effect. f) Linear discriminant analysis (LDA) identifies the significantly abundant genus in different groups. Taxa that meeting an LDA significant threshold of 4 are shown. g) Relative abundance of microbiota that is significantly altered at the phylum level. The Kruskal–Wallis test was utilized for statistical analysis. h) Relative abundance of microbiota that is significantly altered at the family level. The Kruskal–Wallis test was applied for statistical analysis. ns, not significant; * p < 0.05, ** p < 0.01.

References

    1. Doherty G., Katsanos K. H., Burisch J., Allez M., Papamichael K., Stallmach A., Mao R., Berset I. P., Gisbert J. P., Sebastian S., Kierkus J., Lopetuso L., Szymanska E., Louis E., J. Crohns Colitis 2018, 12, 17. - PubMed
    1. Bain C. C., Mowat A. M., Immunol. Rev. 2014, 260, 102. - PMC - PubMed
    1. Ng S. C., Shi H. Y., Hamidi N., Underwood F. E., Tang W., Benchimol E. I., Panaccione R., Ghosh S., Wu J. C. Y., Chan F. K. L., Sung J. J. Y., Kaplan G. G., Lancet 2018, 390, 2769. - PubMed
    1. Zhang Q., Tao H., Lin Y., Hu Y., An H., Zhang D., Feng S., Hu H., Wang R., Li X., Zhang J., Biomaterials 2016, 105, 206. - PubMed
    1. Hirten R. P., Iacucci M., Shah S., Ghosh S., Colombel J. F., Clin. Gastroenterol. Hepatol. 2018, 16, 1374. - PubMed

Publication types

LinkOut - more resources