. 2021 Sep 10;39(26):2948-2958.
doi: 10.1200/JCO.21.00476. Epub 2021 Jul 22.

US Trends in Opioid Access Among Patients With Poor Prognosis Cancer Near the End-of-Life

Affiliations

US Trends in Opioid Access Among Patients With Poor Prognosis Cancer Near the End-of-Life

Andrea C Enzinger et al. J Clin Oncol. .

Abstract

Purpose: Heightened regulations have decreased opioid prescribing across the United States, yet little is known about trends in opioid access among patients dying of cancer.

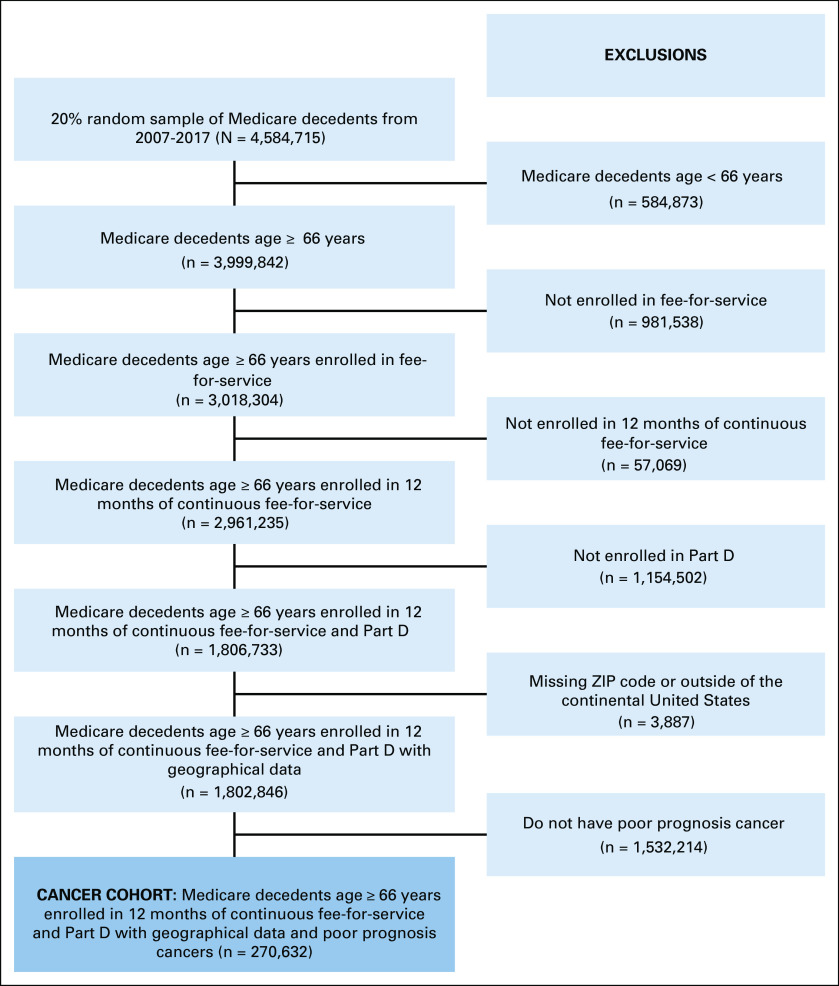
Methods: Among 270,632 Medicare fee-for-service decedents with poor prognosis cancers, we used part D data to examine trends from 2007 to 2017 in opioid prescription fills and opioid potency (morphine milligram equivalents per day [MMED]) near the end-of-life (EOL), defined as the 30 days before death or hospice enrollment. We used administrative claims to evaluate trends in pain-related emergency department (ED) visits near EOL.

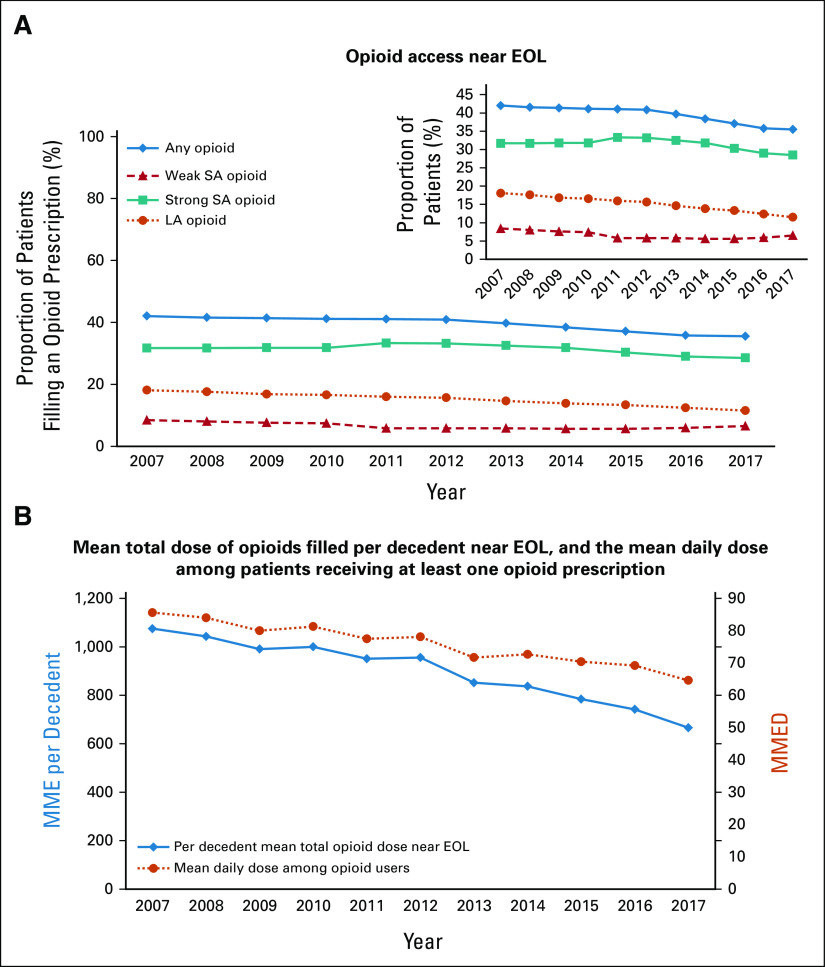
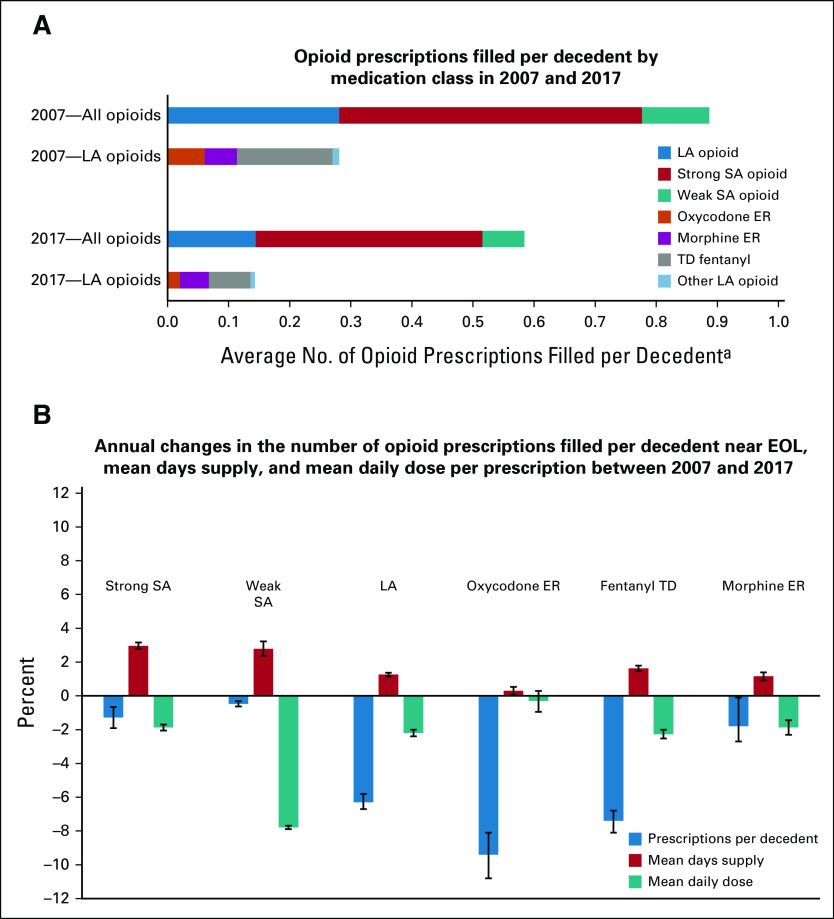
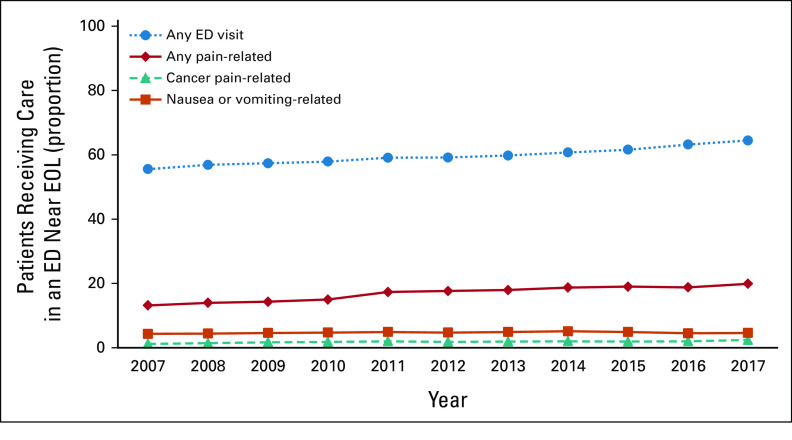
Results: Between 2007 and 2017, the proportion of decedents with poor prognosis cancers receiving ≥ 1 opioid prescription near EOL declined 15.5% (relative percent difference [RPD]), from 42.0% (95% CI, 41.4 to 42.7) to 35.5% (95% CI, 34.9 to 36.0) and the proportion receiving ≥ 1 long-acting opioid prescription declined 36.5% (RPD), from 18.1% (95% CI, 17.6 to 18.6) to 11.5% (95% CI, 11.1 to 11.9). Among decedents receiving opioids near EOL, the mean daily dose fell 24.5%, from 85.6 MMED (95% CI, 82.9 to 88.3) to 64.6 (95% CI, 62.7 to 66.6) MMED. Overall, the total amount of opioids prescribed per decedent near EOL (averaged across those who did and did not receive an opioid) fell 38.0%, from 1,075 morphine milligram equivalents per decedent (95% CI, 1,042 to 1,109) to 666 morphine milligram equivalents per decedent (95% CI, 646 to 686). Simultaneously, the proportion of patients with pain-related ED visits increased 50.8% (RPD), from 13.2% (95% CI, 12.7 to 13.6) to 19.9% (95% CI, 19.4 to 20.4). Sensitivity analyses demonstrated similar declines in opioid utilization in the 60 and 90 days before death or hospice, and suggested that trends in opioid access were not confounded by secular trends in hospice utilization.

Conclusion: Opioid use among patients dying of cancer has declined substantially from 2007 to 2017. Rising pain-related ED visits suggests that EOL cancer pain management may be worsening.


Conflict of interest statement

Andrea C. EnzingerConsulting or Advisory Role: Five Prime Therapeutics (I), Merck (I), Astellas Pharma (I), Lilly (I), Loxo (I), Taiho Pharmaceutical (I), Daiichi Sankyo (I), AstraZeneca (I), Zymeworks (I), Takeda (I), Zymeworks (I), Istari (I), Ono Pharmaceutical (I), Xencor (I), ALX Oncology (I), Bristol-Meyers Squibb (I) David M. CutlerExpert Testimony: MDL—Opioids, MDL—JUUL Alexi A. WrightConsulting or Advisory Role: GlaxoSmithKlineResearch Funding: NCCN/AstraZenecaNo other potential conflicts of interest were reported.

Figures

FIG 1.
FIG 1.
Flow diagram of study cohort: Medicare decedents with poor prognosis cancers (2007-2017). The study cohort was derived from administrative data from the Centers for Medicare & Medicaid Services 20% random sample of beneficiaries. Our final cohort included decedents age > 66 years with poor prognosis cancers who died between January 1, 2007, and December 31, 2017, with continuous fee-for-service Medicare part A, B, and D coverage ≥ 12 months before death. Patients living outside the United States or missing geographical data were excluded.
FIG 2.
FIG 2.
Annual trends from 2007 to 2017 in opioid prescription fills, opioid potency, and the total dose of opioids filled by decedents with poor prognosis cancers near the EOL. (A) The proportion of patients filling any opioid prescription, including weak short-acting opioids, strong short-acting opioids, and long-acting opioids in the 30 days before death or hospice enrollment. The inset shows the same data, on an enlarged y-axis. (B) The red line represents the mean total dose of opioids (in MMEs) provided to patients with poor prognosis cancers near EOL. This was calculated by summing the morphine equivalent dose of all opioid prescriptions filled by decedents near EOL in a given year, and dividing it by the number of decedents that year. The blue line represents the population mean daily opioid dose in MMED received by patients who filled ≥ 1 opioid prescription near EOL. Near EOL is defined as the last 30 days before death or hospice enrollment. EOL, end-of-life; LA, long-acting; MME, morphine milligram equivalents; MMED, morphine milligram equivalents per day; SA, short-acting.
FIG 3.
FIG 3.
2007-2017 changes in the number of opioid prescriptions filled per poor prognosis cancer decedent near EOL, and the mean days-supply and mean daily dose per prescription. (A) The first two columns show the distribution of 25,006 opioid prescriptions filled by 22,003 patients near the EOL in 2007; the last two columns show the distribution of 22,974 opioid prescriptions filled by 27,345 patients near the EOL in 2017. aThe x-axis represents the average number of opioid prescriptions filled per decedent (number of prescriptions filled by patients with poor prognosis cancers in the last 30 days, divided by the number of decedents with poor prognosis cancers in that year). (B) Blue bars represent the unadjusted annual change in rate in the number of opioid prescriptions filled per decedent; orange bars represent the unadjusted annual growth rate in the mean days-supply per prescription; gray bars represent the unadjusted annual change in rate in the mean daily dose per prescription, all calculated from 2007 to 2017. Error bars represent 95% CIs derived from linear regression models. EOL, end-of-life; ER, extended release; LA, long-acting; SA, short-acting; TD, transdermal.
FIG 4.
FIG 4.
Annual trends in the proportion of patients with poor prognosis cancers receiving care in an ED near the EOL overall, and for pain. The blue line represents annual trends in the proportion of patients having ≥ 1 ED visit near EOL; the red line represents trends in the proportion of patients having ≥ 1 ED visit for pain near EOL using the CMS OP-35 definition; the green line represents trends in the proportion of patients having ≥ 1 ED visit with an International Classification of Diseases Ninth Revision or Tenth Revision code for malignancy associated pain near EOL; the purple line represents trends in the proportion of patients having ≥ 1 ED visit for nausea or vomiting near EOL using the CMS OP-35 definition. Outcomes were examined in the last 30 days before death or hospice enrollment. CMS, Centers for Medicare & Medicaid Services; ED, emergency department; EOL, end-of-life.

Comment in

References

    1. Barnett ML, Olenski AR, Jena AB:Opioid-prescribing patterns of emergency physicians and risk of long-term use. N Engl J Med 376:663-673, 2017 - PMC - PubMed
    1. Dart RC, Surratt HL, Cicero TJ, et al. :Trends in opioid analgesic abuse and mortality in the United States. N Engl J Med 372:241-248, 2015 - PubMed
    1. Bohnert AS, Valenstein M, Bair MJ, et al. :Association between opioid prescribing patterns and opioid overdose-related deaths. JAMA 305:1315-1321, 2011 - PubMed
    1. Guy GP Jr, Zhang K, Bohm MK, et al. :Vital signs: Changes in opioid prescribing in the United States, 2006-2015. MMWR Morb Mortal Wkly Rep 66:697-704, 2017 - PMC - PubMed
    1. Dowell D, Haegerich TM, Chou R:CDC guideline for prescribing opioids for chronic pain—United States, 2016. JAMA 315:1624-1645, 2016 - PMC - PubMed

Publication types

MeSH terms

Substances