. 2021 Jul 20;118(29):e2104241118.
doi: 10.1073/pnas.2104241118. Epub 2021 Jul 2.

Ongoing global and regional adaptive evolution of SARS-CoV-2

Affiliations

Ongoing global and regional adaptive evolution of SARS-CoV-2

Nash D Rochman et al. Proc Natl Acad Sci U S A. .

Abstract

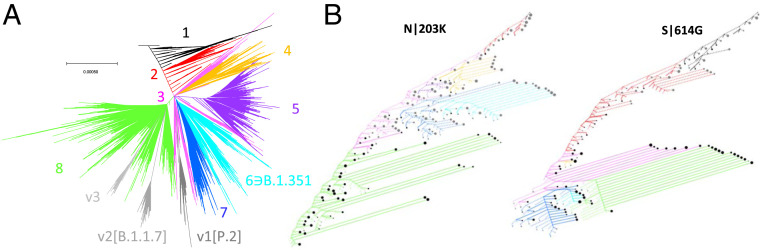
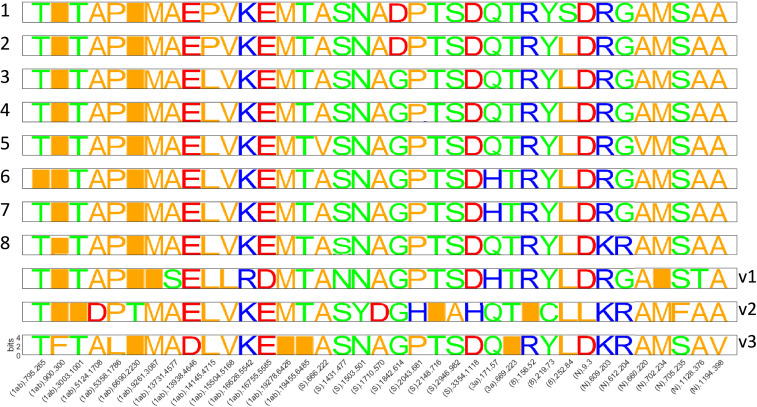
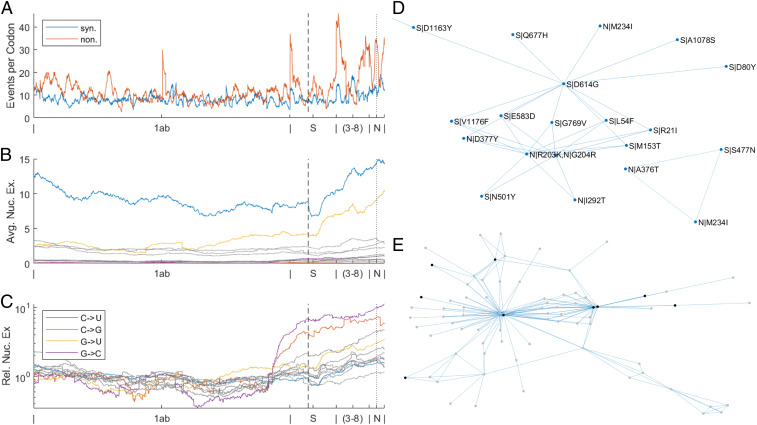
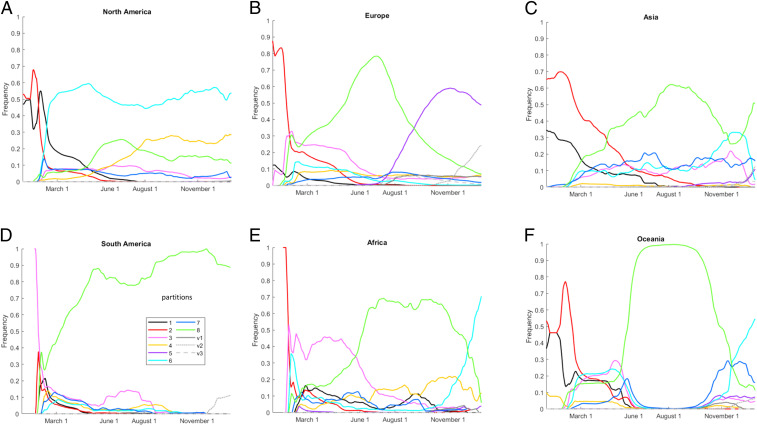
Understanding the trends in severe acute respiratory syndrome coronavirus 2 (SARS-CoV-2) evolution is paramount to control the COVID-19 pandemic. We analyzed more than 300,000 high-quality genome sequences of SARS-CoV-2 variants available as of January 2021. The results show that the ongoing evolution of SARS-CoV-2 during the pandemic is characterized primarily by purifying selection, but a small set of sites appear to evolve under positive selection. The receptor-binding domain of the spike protein and the region of the nucleocapsid protein associated with nuclear localization signals (NLS) are enriched with positively selected amino acid replacements. These replacements form a strongly connected network of apparent epistatic interactions and are signatures of major partitions in the SARS-CoV-2 phylogeny. Virus diversity within each geographic region has been steadily growing for the entirety of the pandemic, but analysis of the phylogenetic distances between pairs of regions reveals four distinct periods based on global partitioning of the tree and the emergence of key mutations. The initial period of rapid diversification into region-specific phylogenies that ended in February 2020 was followed by a major extinction event and global homogenization concomitant with the spread of D614G in the spike protein, ending in March 2020. The NLS-associated variants across multiple partitions rose to global prominence in March to July, during a period of stasis in terms of interregional diversity. Finally, beginning in July 2020, multiple mutations, some of which have since been demonstrated to enable antibody evasion, began to emerge associated with ongoing regional diversification, which might be indicative of speciation.

Keywords: SARS-Cov-2; ancestral reconstruction; epistasis; globalization; phylogeny.


Conflict of interest statement

The authors declare no competing interest.

Figures

Fig. 1.
Fig. 1.
Global phylogeny of SARS-CoV-2. (A) Global tree reconstruction with eight principal partitions and three variant clades enumerated and color coded. (B) Site history trees for spike 614 and nucleocapsid 203 positions. Nodes were included in this reduced tree based on the following criteria: those immediately succeeding a substitution; those representing the last common ancestor of at least two substitutions; or terminal nodes representing branches of five sequences or more (approximately, based on tree weight). Edges are colored according to their position in the main partitions, and the line type corresponds to the target mutation (solid) or any other state (dashed). Synonymous mutations are not shown. These sites are largely binary, as are most sites in the genome. The terminal node sizes are proportional to the log of the weight descendent from that node beyond which no substitutions in the site occurred. Node color corresponds to target mutation (black) or any other state (gray).
Fig. 2.
Fig. 2.
SARS-CoV-2 signature mutations. Signatures of amino acid replacements for each partition. Sites are ordered as they appear in the genome. The proteins, along with the nucleotide and amino acid numbers, are indicated underneath each column.
Fig. 3.
Fig. 3.
Global phylogeny of SARS-CoV-2. (A) Moving averages, respecting segment boundaries, across a 100-codon window for synonymous and nonsynonymous substitutions per site. There are several regions in the genome with an apparent dramatic excess of synonymous substitutions, including 5′ end of orf1ab gene, most of the M gene, and 3′ half of the N gene. There are also regions with substantially elevated rate of amino acid substitutions, including most of the orf3a gene, most of the orf7a gene, most of the orf8 gene, and several regions in the N gene. (B) Moving average over a window of 1,000 codons, not respecting segment boundaries, of the total number of nucleotide substitutions n1→n2 summed over all substitutions. (C) Moving average over a window of 1,000 codons, not respecting segment boundaries, of the total number of nucleotide substitutions n1→n2 summed over all substitutions (as in B) normalized by the median over all windows. (D) Network of putative epistatic interactions for likely positively selected residues in the N and S proteins. (E) Network of putative epistatic interactions for mutations meeting all other criteria for positive selection, regardless of the NCN context. Mutations in the polyprotein are not displayed. Black nodes correspond to key amino acid substitutions S|L18F, S|A222V, S|S477N, S|N501Y, S|D614G, S|P681H, S|T716I, N|R203K, and N|G204R. See SI Appendix, Fig. S10 for labeled graph.
Fig. 4.
Fig. 4.
Regional SARS-CoV-2 partition dynamics during the COVID-19 pandemic: (A) North America, (B) Europe, (C) Asia, (D) South America, (E) Africa, and (F) Oceania. Probability distributions shown; for the absolute number of sequences, see SI Appendix, Fig. S15. Different colors within this figure denote regions and not partitions as they had in Figs. 1–3.
Fig. 5.
Fig. 5.
Global and regional trends in SARS-CoV-2 evolution. (A) Global distribution of sequences with sequencing locations in each of the six regions considered. Color scheme is for visual distinction only. (B) Intraregional diversity measured by the mean tree distance for pairs of isolates. (C) (Top) The Hellinger distance for all pairs of regions over the 11 partition/clade distribution; 25th, 50th, and 75th percentiles are shown. (Bottom) The ratio of the mean tree distance for pairs of isolates between regions vs. isolates within regions; 25th, 50th, and 75th percentiles are shown. (D) The frequency of S|614G, at least one NLS-associated variant (N|194L, N119L, N203K, N205I, and N220V), and at least one emerging spike variant (SI Appendix, Fig. S23, excluding S|477N). Different colors within this figure denote regions and not partitions.

Update of

References

    1. Drake J. W., Holland J. J., Mutation rates among RNA viruses. Proc. Natl. Acad. Sci. U.S.A. 96, 13910–13913 (1999). - PMC - PubMed
    1. Sanjuán R., From molecular genetics to phylodynamics: Evolutionary relevance of mutation rates across viruses. PLoS Pathog. 8, e1002685 (2012). - PMC - PubMed
    1. Simmonds P., Aiewsakun P., Katzourakis A., Prisoners of war—Host adaptation and its constraints on virus evolution. Nat. Rev. Microbiol. 17, 321–328 (2019). - PMC - PubMed
    1. Elena S. F., Sanjuán R., Adaptive value of high mutation rates of RNA viruses: Separating causes from consequences. J. Virol. 79, 11555–11558 (2005). - PMC - PubMed
    1. Wertheim J. O., Kosakovsky Pond S. L., Purifying selection can obscure the ancient age of viral lineages. Mol. Biol. Evol. 28, 3355–3365 (2011). - PMC - PubMed

Publication types

MeSH terms

Substances

LinkOut - more resources