. 2021 Sep 2;108(9):1631-1646.
doi: 10.1016/j.ajhg.2021.06.018. Epub 2021 Jul 21.

Cell-type-specific meQTLs extend melanoma GWAS annotation beyond eQTLs and inform melanocyte gene-regulatory mechanisms

Affiliations

Cell-type-specific meQTLs extend melanoma GWAS annotation beyond eQTLs and inform melanocyte gene-regulatory mechanisms

Tongwu Zhang et al. Am J Hum Genet. .

Abstract

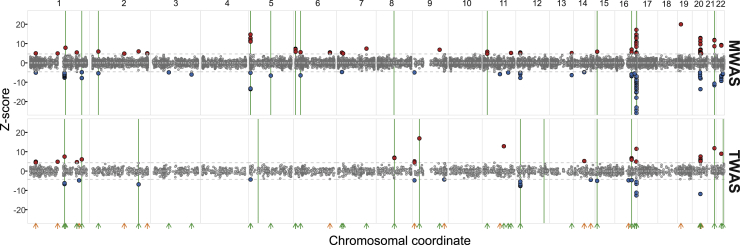
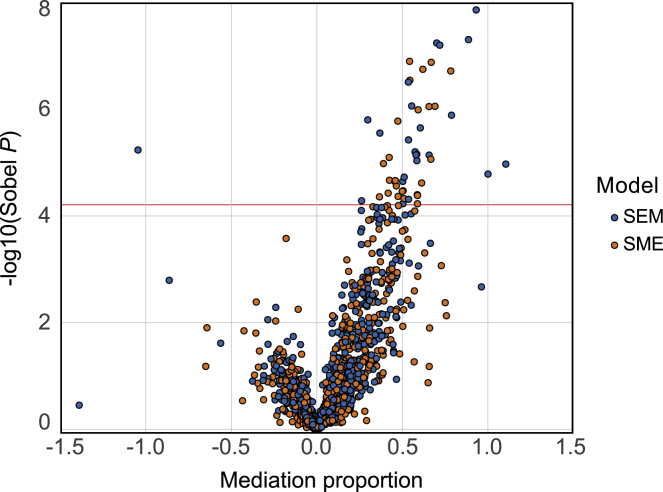
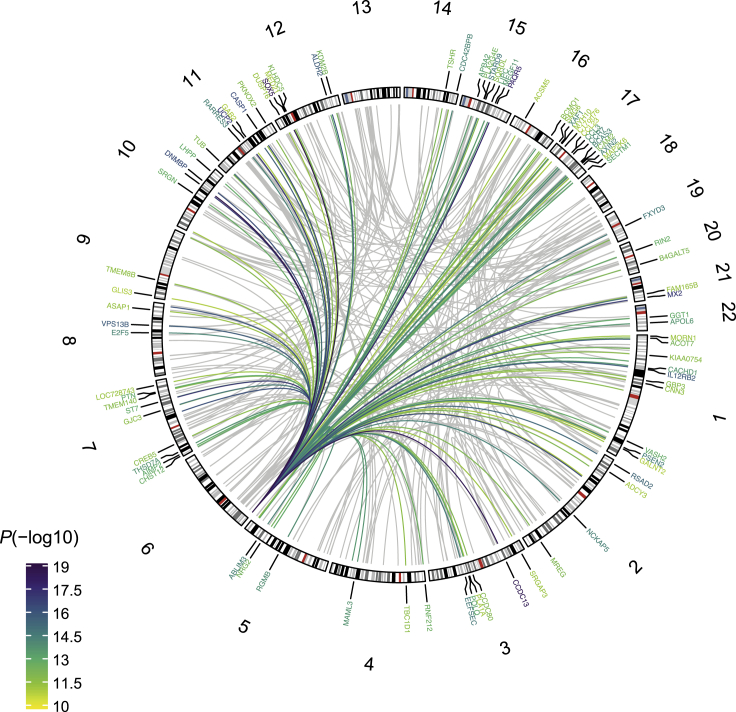
Although expression quantitative trait loci (eQTLs) have been powerful in identifying susceptibility genes from genome-wide association study (GWAS) findings, most trait-associated loci are not explained by eQTLs alone. Alternative QTLs, including DNA methylation QTLs (meQTLs), are emerging, but cell-type-specific meQTLs using cells of disease origin have been lacking. Here, we established an meQTL dataset by using primary melanocytes from 106 individuals and identified 1,497,502 significant cis-meQTLs. Multi-QTL colocalization with meQTLs, eQTLs, and mRNA splice-junction QTLs from the same individuals together with imputed methylome-wide and transcriptome-wide association studies identified candidate susceptibility genes at 63% of melanoma GWAS loci. Among the three molecular QTLs, meQTLs were the single largest contributor. To compare melanocyte meQTLs with those from malignant melanomas, we performed meQTL analysis on skin cutaneous melanomas from The Cancer Genome Atlas (n = 444). A substantial proportion of meQTL probes (45.9%) in primary melanocytes is preserved in melanomas, while a smaller fraction of eQTL genes is preserved (12.7%). Integration of melanocyte multi-QTLs and melanoma meQTLs identified candidate susceptibility genes at 72% of melanoma GWAS loci. Beyond GWAS annotation, meQTL-eQTL colocalization in melanocytes suggested that 841 unique genes potentially share a causal variant with a nearby methylation probe in melanocytes. Finally, melanocyte trans-meQTLs identified a hotspot for rs12203592, a cis-eQTL of a transcription factor, IRF4, with 131 candidate target CpGs. Motif enrichment and IRF4 ChIP-seq analysis demonstrated that these target CpGs are enriched in IRF4 binding sites, suggesting an IRF4-mediated regulatory network. Our study highlights the utility of cell-type-specific meQTLs.

Keywords: DNA methylation; GWAS; IRF4; MWAS; QTL; colocalization; genome-wide association study; mediation analysis; melanocyte; melanoma; methylome-wide association study; quantitative trait loci; trans-QTL.


Conflict of interest statement

Declaration of interests The authors declare no competing interests.

Figures

Figure 1
Figure 1
Melanocyte meQTL and multi-QTL colocalization improved melanoma GWAS annotation Circos plot shows significant colocalization of melanoma GWAS loci (top) with eQTLs (right), sQTLs (bottom), and meQTLs (left). Colocalization between individual GWAS loci with multiple QTL traits is depicted by thicker, colored lines. GWAS loci are sorted by genomic coordinate and labeled with GWAS lead SNPs with different colors; GWAS loci without any colocalizing QTLs are shown in black. QTL-associated gene symbols are also labeled with the same color as the GWAS loci they correspond to. Gene symbols are assigned on the basis of eQTLs/sQTLs for multi-QTL loci.
Figure 2
Figure 2
Manhattan plots of melanocyte TWAS and MWAS results combined with findings from eQTL and meQTL colocalization Each circle represents the TWAS or MWAS Z score of a gene (TWAS) or a CpG probe (MWAS) reflecting significance and the direction of effect relative to melanoma risk (red, higher level correlates with melanoma risk; blue, lower level correlates with melanoma risk). Z scores are shown on the y-axis, and chromosomal positions are on the x-axis. Green arrows, overlapping melanoma GWAS loci; orange arrows, new loci detected by TWAS or MWAS; green lines, colocalization of eQTLs or meQTLs with melanoma GWAS loci; gray dashed horizontal lines, significance threshold defined by 0.05/number of probes or genes tested.
Figure 3
Figure 3
Summary of melanoma GWAS annotation with melanocyte multi-QTLs and TCGA-melanoma meQTLs Known melanoma-associated loci (green circles) are defined by the findings from the newest melanoma meta-analysis. The new melanoma-associated loci (orange circles) are identified on the basis of TWAS or MWAS analysis. Known and new GWAS loci are sorted by genomic coordinate. The top bar plot shows the total number of annotations per locus by multi-QTL colocalization (shown by QTL types) or TWAS/MWAS from melanocyte and TCGA datasets. The right marginal bar plot shows the percentage of GWAS loci annotated by each approach (the percentage of the known loci is labeled in green).
Figure 4
Figure 4
Mediation analysis of potentially colocalizing SNP-eGene-meProbes The volcano plot shows the mediation analysis results for both the SEM (blue) and SME (orange) models. Sobel p indicates the significance of the mediation analyses, where the red horizontal line indicates FDR = 0.05 cutoff. The mediation proportion shows the proportion of the total effect (cis-meQTL) mediated by a cis-gene (SEM) or the proportion of the total effect (cis-eQTL) mediated by cis-probes (SME). Mediation proportion can go in either direction depending on the directions of the effects of the confounders with the cis-mediator, the confounder on the cis-gene or cis-probes, and the non-reference allele on the cis-probes or cis-gene.
Figure 5
Figure 5
Melanocyte trans-meQTLs Circos plot shows genome-wide significant trans-meQTLs at FDR < 0.01. The yellow-green gradient spikes show a hotspot trans-meQTL SNP, rs12203592, located at 6p25.3 that is associated with 131 CpG sites. Nearby genes of trans-meQTL-associated CpG sites are labeled outside of the circos plot.

References

    1. GTEx Consortium The GTEx Consortium atlas of genetic regulatory effects across human tissues. Science. 2020;369:1318–1330. - PMC - PubMed
    1. Kim-Hellmuth S., Aguet F., Oliva M., Muñoz-Aguirre M., Kasela S., Wucher V., Castel S.E., Hamel A.R., Viñuela A., Roberts A.L. Cell type–specific genetic regulation of gene expression across human tissues. Science. 2020;369:eaaz8528. - PMC - PubMed
    1. Donovan M.K.R., D’Antonio-Chronowska A., D’Antonio M., Frazer K.A. Cellular deconvolution of GTEx tissues powers discovery of disease and cell-type associated regulatory variants. Nat. Commun. 2020;11:955. - PMC - PubMed
    1. Landi M.T., Bishop D.T., MacGregor S., Machiela M.J., Stratigos A.J., Ghiorzo P., Brossard M., Calista D., Choi J., Fargnoli M.C. Genome-wide association meta-analyses combining multiple risk phenotypes provide insights into the genetic architecture of cutaneous melanoma susceptibility. Nat. Genet. 2020;52:494–504. - PMC - PubMed
    1. Law M.H., Bishop D.T., Lee J.E., Brossard M., Martin N.G., Moses E.K., Song F., Barrett J.H., Kumar R., Easton D.F. Genome-wide meta-analysis identifies five new susceptibility loci for cutaneous malignant melanoma. Nat. Genet. 2015;47:987–995. - PMC - PubMed

Publication types

MeSH terms

Substances