. 2021 Aug;596(7873):590-596.
doi: 10.1038/s41586-021-03828-1. Epub 2021 Jul 22.

Highly accurate protein structure prediction for the human proteome

Affiliations

Highly accurate protein structure prediction for the human proteome

Kathryn Tunyasuvunakool et al. Nature. 2021 Aug.

Abstract

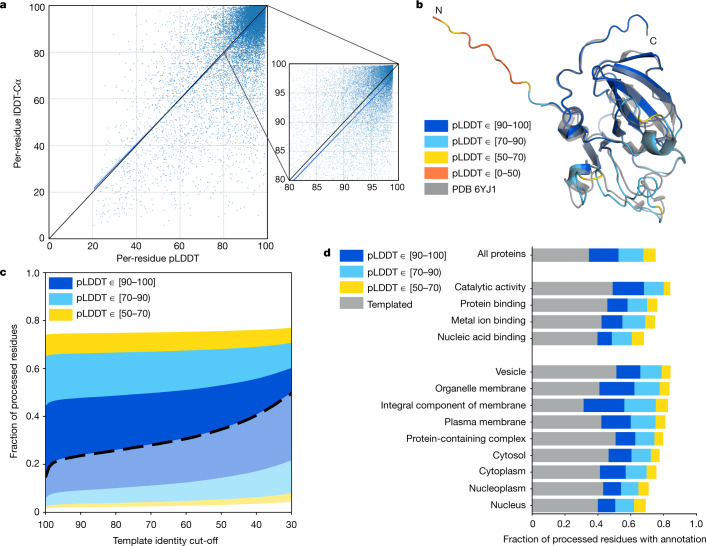
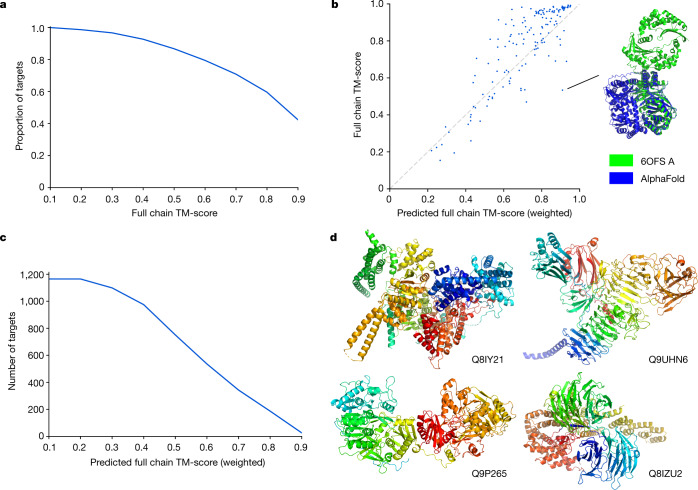
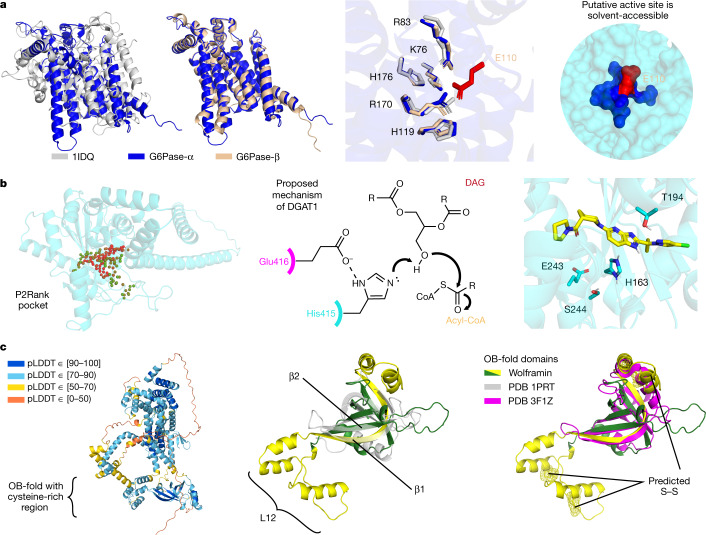
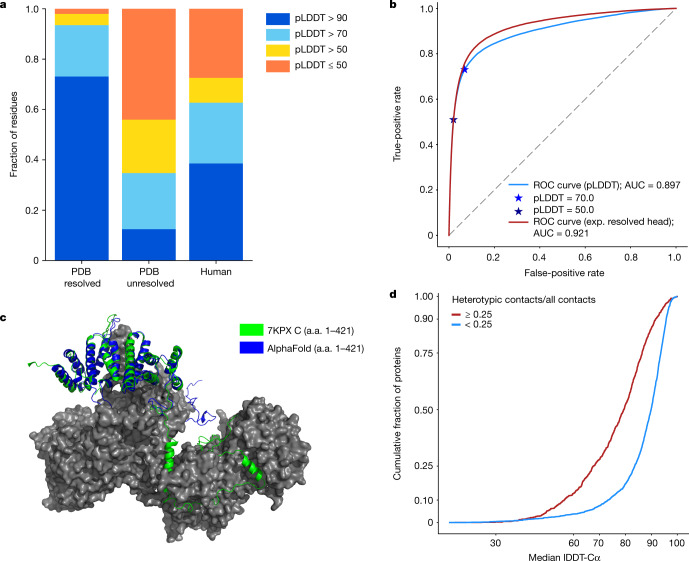
Protein structures can provide invaluable information, both for reasoning about biological processes and for enabling interventions such as structure-based drug development or targeted mutagenesis. After decades of effort, 17% of the total residues in human protein sequences are covered by an experimentally determined structure1. Here we markedly expand the structural coverage of the proteome by applying the state-of-the-art machine learning method, AlphaFold2, at a scale that covers almost the entire human proteome (98.5% of human proteins). The resulting dataset covers 58% of residues with a confident prediction, of which a subset (36% of all residues) have very high confidence. We introduce several metrics developed by building on the AlphaFold model and use them to interpret the dataset, identifying strong multi-domain predictions as well as regions that are likely to be disordered. Finally, we provide some case studies to illustrate how high-quality predictions could be used to generate biological hypotheses. We are making our predictions freely available to the community and anticipate that routine large-scale and high-accuracy structure prediction will become an important tool that will allow new questions to be addressed from a structural perspective.


Conflict of interest statement

J.J., R.E., A. Pritzel, T.G., M.F., O.R., R.B., A. Bridgland, S.A.A.K., D.R. and A.W.S. have filed non-provisional patent applications 16/701,070, PCT/EP2020/084238, and provisional patent applications 63/107,362, 63/118,917, 63/118,918, 63/118,921 and 63/118,919, each in the name of DeepMind Technologies Limited, each pending, relating to machine learning for predicting protein structures. E.B. is a paid consultant to Oxford Nanopore and Dovetail Inc, which are genomics companies. The other authors declare no competing interests.

Figures

Fig. 1
Fig. 1. Model confidence and added coverage.
a, Correlation between per-residue pLDDT and lDDT-Cα. Data are based on a held-out set of recent PDB chains (Methods) filtered to those with a reported resolution of <3.5 Å (n = 10,215 chains and 2,756,569 residues). The scatterplot shows a subsample (1% of residues), with the blue line showing a least-squares linear fit and the shaded region a 95% confidence interval estimated with 1,000 bootstrap samples. The black line shows x = y, for comparison. The smaller plot is a magnified region of the larger one. On the full dataset, the Pearson’s r = 0.73 and the least-squares linear fit is y = (0.967 ± 0.001) × x + (1.9 ± 0.1). b, AlphaFold prediction and experimental structure for a CASP14 target (PDB: 6YJ1). The prediction is coloured by model confidence band, and the N terminus is an expression tag included in CASP but unresolved in the PDB structure. c, AlphaFold model confidence on all residues for which a prediction was produced (n = 10,537,122 residues). Residues covered by a template at the specified identity level are shown in a lighter colour and a heavy dashed line separates these from residues without a template. d, Added residue-level coverage of the proteome for high-level GO terms, on top of residues covered by a template with sequence identity of more than 50%. Based on the same human proteome dataset as in c (n = 10,537,122 residues).
Fig. 2
Fig. 2. Full chain structure prediction.
a, TM-score distribution for AlphaFold evaluated on a held-out set of template-filtered, long PDB chains (n = 151 chains). Includes recent PDB proteins with more than 800 resolved residues and best 50% coverage template below 30% identity. b, Correlation between full chain TM-score and pTM on the same set (n = 151 chains), Pearson’s r = 0.84. The ground truth and predicted structure are shown for the most over-optimistic outlier (PDB: 6OFS, chain A). c, pTM distribution on a subset of the human proteome that we expect to be enriched for structurally novel multidomain proteins (n = 1,165 chains). Human proteome predictions comprise more than 600 confident residues (more than 50% coverage) and no proteins with 50% coverage templates. d, Four of the top hits from the set shown in c, filtering by pTM > 0.8 and sorting by number of confident residues. Proteins are labelled by their UniProt accession. For clarity, regions with pLDDT < 50 are hidden, as are isolated smaller regions that were left after this cropping.
Fig. 3
Fig. 3. Highlighted structure predictions.
a, Left, comparison of the active sites of two G6Pases (G6Pase-α and G6Pase-β) and a chloroperoxidase (PDB 1IDQ). The G6Pases are glucose-forming enzymes that contain a conserved, solvent-accessible glutamate (red; right) opposite the shared active-site residues (middle). b, Left, pocket prediction (P2Rank) identifies a putative binding pocket for DGAT2, which is involved in body-fat synthesis. Red and green spheres represent the ligandability scores by P2Rank of 1 and 0, respectively. Middle, a proposed mechanism for DGAT1 activates the substrate with Glu416 and His415, which have analogous residues in the DGAT2 pocket. The docked inhibitor is well placed for polar interactions with His163 and Thr194 (right). The chemical structure (middle) is adapted from ref. . c, Predicted structure of wolframin, mutations in which cause Wolfram syndrome. Although there are regions in wolframin with low pLDDT (left), we could identify an OB-fold region (green/yellow), with a comparable core to a prototypical OB-fold (grey; middle). However, the most similar PDB chain (magenta; right) lacks the conserved cysteine-rich region (yellow) of our prediction. This region forms the characteristic β1 strand and an extended L12 loop, and is predicted to contain three disulfide bridges (yellow mesh).
Fig. 4
Fig. 4. Low-confidence regions.
a, pLDDT distribution of the resolved parts of PDB sequences (n = 3,440,359 residues), the unresolved parts of PDB sequences (n = 589,079 residues) and the human proteome (n = 10,537,122 residues). b, Performance of pLDDT and the experimentally resolved head of AlphaFold as disorder predictors on the CAID Disprot-PDB benchmark dataset (n = 178,124 residues). c, An example low-confidence prediction aligned to the corresponding PDB submission (7KPX chain C). The globular domain is well-predicted but the extended interface exhibits low pLDDT and is incorrect apart from some of the secondary structure. a.a., amino acid. d, A high ratio of heterotypic contacts is associated with a lower AlphaFold accuracy on the recent PDB dataset, restricted to proteins with fewer than 40% of residues with template identity above 30% (n = 3,007 chains) (Methods). The ratio of heterotypic contacts is defined as: heterotypic/(intra-chain + homomeric + heterotypic).
Extended Data Fig. 1
Extended Data Fig. 1. Example full chain outputs containing both high- and low-confidence regions.
Q06787 (synaptic functional regulator FMR1) and P54725 (UV excision repair protein RAD23 homologue A) are predicted to be disordered outside the experimentally determined regions by MobiDB. Q92664 (transcription factor IIIA) has been described as ‘beads on a string’, consisting of zinc-finger domains joined by flexible linkers.
Extended Data Fig. 2
Extended Data Fig. 2. Distribution of per-residue lDDT-Cα within eight pLDDT bins.
This represents an alternative visualization to Fig. 1a that does not sample the data. It uses the recent PDB dataset (Methods), which is restricted to structures with a reported resolution of <3.5 Å (n = 2,756,569 residues). Residues were assigned to bins of width 10 based on their pLDDT (minimum, 20; maximum, 100). Markers show the mean lDDT-Cα within each bin, while the lDDT-Cα distribution is visualized as a Matplotlib violin plot (kernel density estimate bandwidth, 0.2). The smallest sample size for the corresponding violin is 5,655 residues for the left-most bin.
Extended Data Fig. 3
Extended Data Fig. 3. Relationship between pLDDT and side-chain χ1 correctness.
Evaluated on the recent PDB dataset (Methods), which is restricted to structures with a reported resolution of <2.5 Å (n = 5,983 chains) and residues with a B-factor of <30 Å2 (n = 609,623 residues). Residues are binned by pLDDT, with bin width 5 between 20 and 70 pLDDT and bin width 2 above 70 pLDDT. A χ1 angle is considered correct if it is within 40° of its value in the PDB structure. Markers show the proportion of correct χ1 angles within each bin; error bars indicate the 95% confidence interval (two-sided Student’s t-test). The smallest sample size for the error bars is 193 residues for the left-most bin.
Extended Data Fig. 4
Extended Data Fig. 4. AlphaFold performance at a range of template sequence identities.
lDDT-Cα for AlphaFold and BestSingleStructuralTemplate on 1 year of CAMEO targets. Targets are binned according to the sequence identity of the best template covering at least 70% of the target, and a box plot is shown for each bin. The horizontal line indicates the median, boxes range from the lower to the upper quartile, and the whiskers extend from the minimum to the maximum. In total, 428 targets are included (see Source Data); the smallest number of targets in any bin is 18 Source data.
Extended Data Fig. 5
Extended Data Fig. 5. Docking poses for a DGAT1-specific inhibitor in DGAT2.
a, Top binding pose from Autodock Vina for a DGAT1-specific inhibitor in DGAT2, which does not match the predicted binding pocket for a DGAT2-specific inhibitor. b, Next best binding pose, which matches the binding pocket for the DGAT2-specific inhibitor, but does not contain components that satisfy the polar side chains His163 and Thr194. c, Relative positions of both binding poses.
Extended Data Fig. 6
Extended Data Fig. 6. Relationship between sequence length and inference time.
On the basis of logs from our human proteome set. All of the processed proteins are shown (n = 20,296). Each point indicates the mean inference time for the protein over the models produced. Vertical lines show the length cut-offs above which sequences were processed by multi-GPU workers.
Extended Data Fig. 7
Extended Data Fig. 7. Relationship between sequence length and run time for the non-inference stages of the pipeline.
On the basis of 240 human protein sequences, chosen by stratified sampling from the length buckets: [16, 500), [500, 1,000), [1,000, 1,500), [1,500, 2,000), [2,000, 2,500) and [2,500, 2,700]. The relax plot shows five times more points, since five relaxed models are generated per protein. Coefficients for the quadratic lines of best fit were computed with Numpy polyfit.

Comment in

References

    1. SWISS-MODEL. Homo sapiens (human). https://swissmodel.expasy.org/repository/species/9606 (2021).
    1. Jumper, J. et al. Highly accurate protein structure prediction with AlphaFold. Nature10.1038/s41586-021-03819-2 (2021). - PMC - PubMed
    1. International Human Genome Sequencing Consortium. Initial sequencing and analysis of the human genome. Nature. 2001;409:860–921. doi: 10.1038/35057062. - DOI - PubMed
    1. Venter JC, et al. The sequence of the human genome. Science. 2001;291:1304–1351. doi: 10.1126/science.1058040. - DOI - PubMed
    1. wwPDB Consortium. Protein Data Bank: the single global archive for 3D macromolecular structure data. Nucleic Acids Res. 2018;47:D520–D528. doi: 10.1093/nar/gky949. - DOI - PMC - PubMed