

The signal transducer CD24 suppresses the germ cell program and promotes an ectodermal rather than mesodermal cell fate in embryonal carcinomas
- PMID: 34293822
- PMCID: PMC8847992
- DOI: 10.1002/1878-0261.13066
The signal transducer CD24 suppresses the germ cell program and promotes an ectodermal rather than mesodermal cell fate in embryonal carcinomas
Abstract
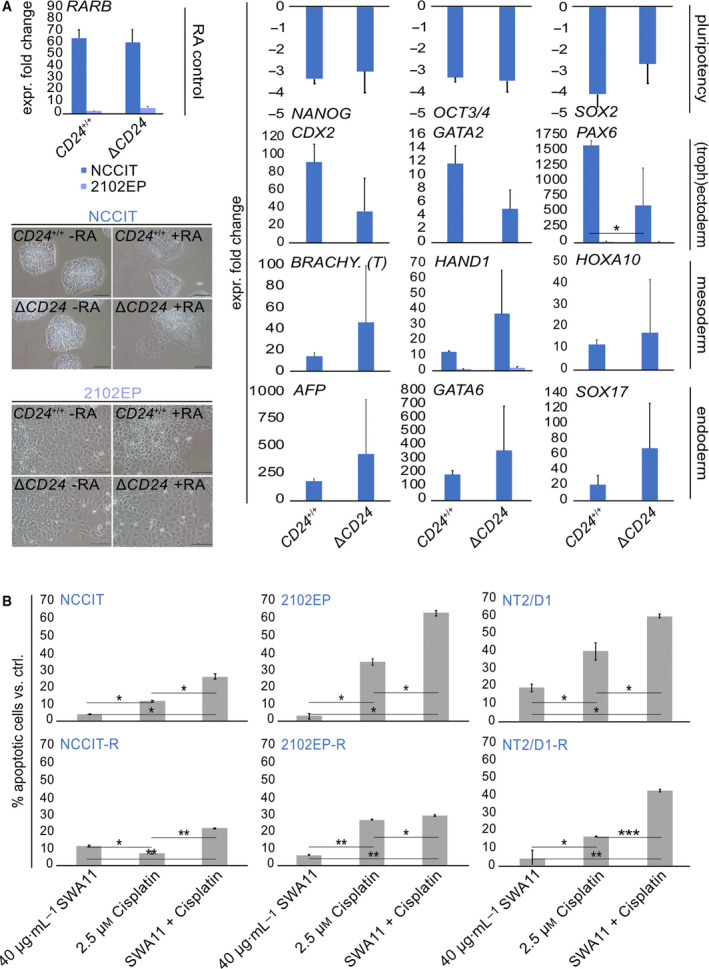
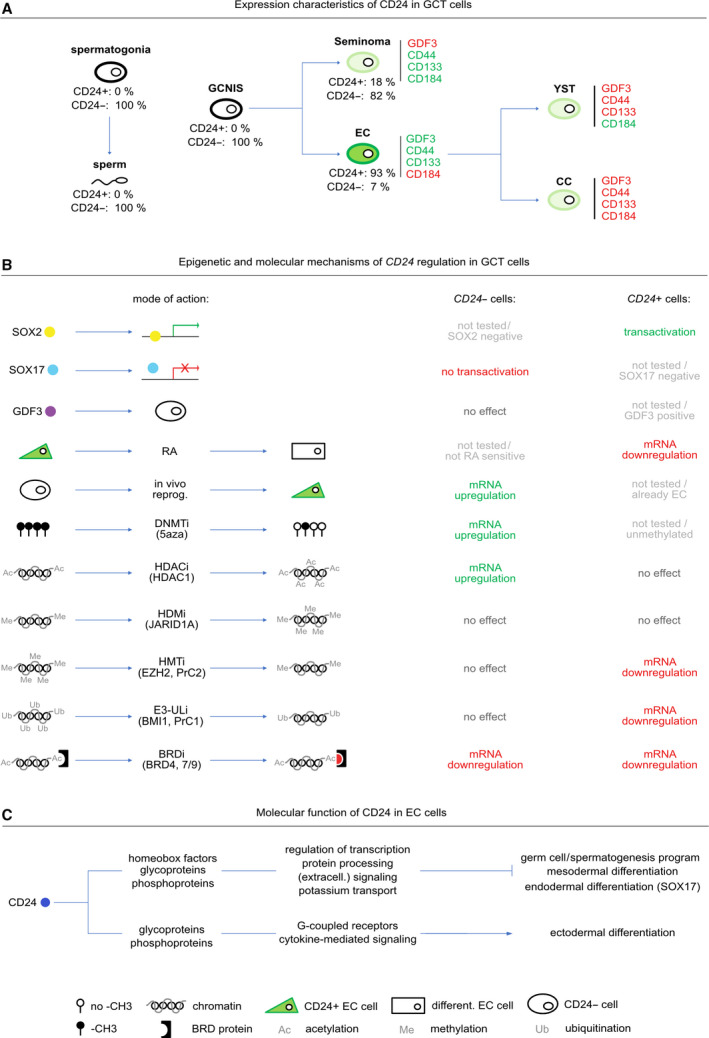
Testicular germ cell tumors (GCTs) are stratified into seminomas and nonseminomas. Seminomas share many histological and molecular features with primordial germ cells, whereas the nonseminoma stem cell population-embryonal carcinoma (EC)-is pluripotent and thus able to differentiate into cells of all three germ layers (teratomas). Furthermore, ECs are capable of differentiating into extra-embryonic lineages (yolk sac tumors, choriocarcinomas). In this study, we deciphered the molecular and (epi)genetic mechanisms regulating expression of CD24, a highly glycosylated signaling molecule upregulated in many cancers. CD24 is overexpressed in ECs compared with other GCT entities and can be associated with an undifferentiated pluripotent cell fate. We demonstrate that CD24 can be transactivated by the pluripotency factor SOX2, which binds in proximity to the CD24 promoter. In GCTs, CD24 expression is controlled by epigenetic mechanisms, that is, histone acetylation, since CD24 can be induced by the application histone deacetylase inhibitors. Vice versa, CD24 expression is downregulated upon inhibition of histone methyltransferases, E3 ubiquitin ligases, or bromodomain (BRD) proteins. Additionally, three-dimensional (3D) co-cultivation of EC cells with microenvironmental cells, such as fibroblasts, and endothelial or immune cells, reduced CD24 expression, suggesting that crosstalk with the somatic microenvironment influences CD24 expression. In a CRISPR/Cas9 deficiency model, we demonstrate that CD24 fulfills a bivalent role in differentiation via regulation of homeobox, and phospho- and glycoproteins; that is, it is involved in suppressing the germ cell/spermatogenesis program and mesodermal/endodermal differentiation, while poising the cells for ectodermal differentiation. Finally, blocking CD24 by a monoclonal antibody enhanced sensitivity toward cisplatin in EC cells, including cisplatin-resistant subclones, highlighting CD24 as a putative target in combination with cisplatin.
Keywords: CD24; differentiation; embryonal carcinoma; epigenetics; germ cell tumors; microenvironment.
© 2021 The Authors. Molecular Oncology published by John Wiley & Sons Ltd on behalf of Federation of European Biochemical Societies.
Conflict of interest statement
The authors declare no conflict of interest.
Figures


Similar articles
-
Unique and redundant roles of SOX2 and SOX17 in regulating the germ cell tumor fate.Int J Cancer. 2020 Mar 15;146(6):1592-1605. doi: 10.1002/ijc.32714. Epub 2019 Nov 1. Int J Cancer. 2020. PMID: 31583686
-
Down-regulation of stem cell genes, including those in a 200-kb gene cluster at 12p13.31, is associated with in vivo differentiation of human male germ cell tumors.Cancer Res. 2006 Jan 15;66(2):820-7. doi: 10.1158/0008-5472.CAN-05-2445. Cancer Res. 2006. PMID: 16424014
-
Expression and interdependencies of pluripotency factors LIN28, OCT3/4, NANOG and SOX2 in human testicular germ cells and tumours of the testis.Int J Androl. 2011 Aug;34(4 Pt 2):e160-74. doi: 10.1111/j.1365-2605.2011.01148.x. Epub 2011 Jun 2. Int J Androl. 2011. PMID: 21631526
-
The plasticity of germ cell cancers and its dependence on the cellular microenvironment.J Cell Mol Med. 2017 Aug;21(8):1463-1467. doi: 10.1111/jcmm.13082. Epub 2017 Feb 28. J Cell Mol Med. 2017. PMID: 28244655 Free PMC article. Review.
-
Chromosomes and expression in human testicular germ-cell tumors: insight into their cell of origin and pathogenesis.Ann N Y Acad Sci. 2007 Dec;1120:187-214. doi: 10.1196/annals.1411.000. Epub 2007 Oct 2. Ann N Y Acad Sci. 2007. PMID: 17911410 Review.
Cited by
-
Profiling the 3D interaction between germ cell tumors and microenvironmental cells at the transcriptome and secretome level.Mol Oncol. 2022 Sep;16(17):3107-3127. doi: 10.1002/1878-0261.13282. Epub 2022 Jul 26. Mol Oncol. 2022. PMID: 35811571 Free PMC article.
-
Targeting CLDN6 in germ cell tumors by an antibody-drug-conjugate and studying therapy resistance of yolk-sac tumors to identify and screen specific therapeutic options.Mol Med. 2023 Mar 29;29(1):40. doi: 10.1186/s10020-023-00636-3. Mol Med. 2023. PMID: 36991316 Free PMC article.
-
Molecular characterization of the CXCR4 / CXCR7 axis in germ cell tumors and its targetability using nanobody-drug-conjugates.Exp Hematol Oncol. 2023 Nov 23;12(1):96. doi: 10.1186/s40164-023-00460-9. Exp Hematol Oncol. 2023. PMID: 37996954 Free PMC article.
-
Expression of CD24 as Cancer Stem Cell Marker in the Diagnosis of Oral Squamous Cell Carcinoma - A Prospective Study.Ann Maxillofac Surg. 2023 Jan-Jun;13(1):26-30. doi: 10.4103/ams.ams_227_22. Epub 2023 Jul 26. Ann Maxillofac Surg. 2023. PMID: 37711538 Free PMC article.
-
Therapeutical interference with the epigenetic landscape of germ cell tumors: a comparative drug study and new mechanistical insights.Clin Epigenetics. 2022 Jan 7;14(1):5. doi: 10.1186/s13148-021-01223-1. Clin Epigenetics. 2022. PMID: 34996497 Free PMC article.
References
-
- Rajpert‐De Meyts E, McGlynn KA, Okamoto K, Jewett MAS & Bokemeyer C (2016) Testicular germ cell tumours. Lancet 387, 1762–1774. - PubMed
-
- Cheng L, Albers P, Berney DM, Feldman DR, Daugaard G, Gilligan T & Looijenga LHJ (2018) Testicular cancer. Nat Rev Dis Prim 4, 29. - PubMed
-
- Oing C, Giannatempo P, Honecker F, Oechsle K, Bokemeyer C & Beyer J (2018) Palliative treatment of germ cell cancer. Cancer Treat Rev 71, 102–107. - PubMed
Publication types
MeSH terms
Substances
LinkOut - more resources
Full Text Sources
Medical
Molecular Biology Databases
Research Materials
