

Hospital length of stay for COVID-19 patients: Data-driven methods for forward planning
- PMID: 34294037
- PMCID: PMC8295642
- DOI: 10.1186/s12879-021-06371-6
Hospital length of stay for COVID-19 patients: Data-driven methods for forward planning
Abstract
Background: Predicting hospital length of stay (LoS) for patients with COVID-19 infection is essential to ensure that adequate bed capacity can be provided without unnecessarily restricting care for patients with other conditions. Here, we demonstrate the utility of three complementary methods for predicting LoS using UK national- and hospital-level data.
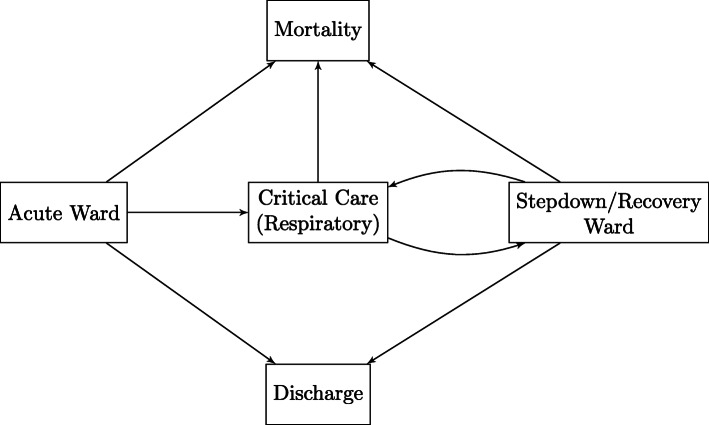
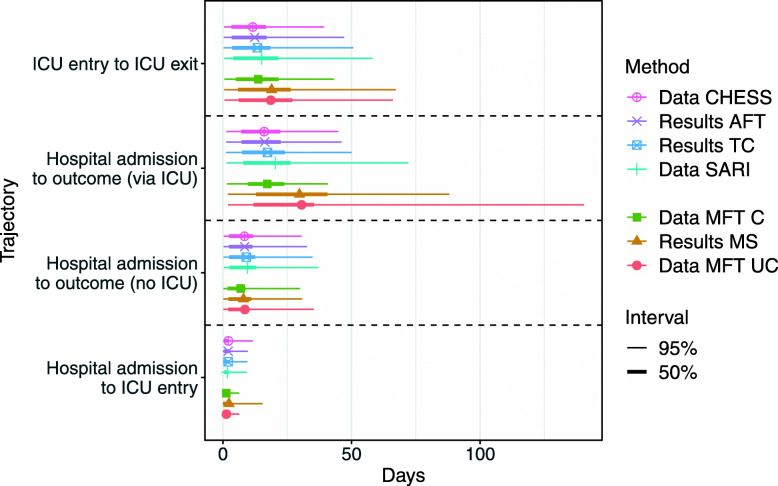
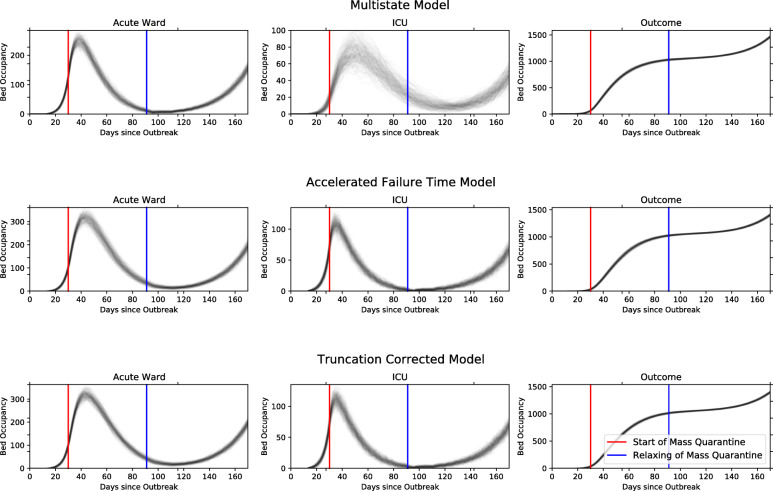
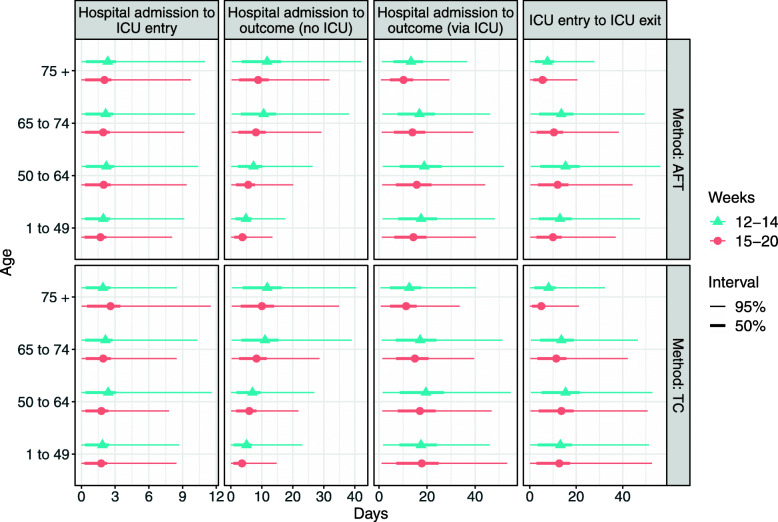
Method: On a national scale, relevant patients were identified from the COVID-19 Hospitalisation in England Surveillance System (CHESS) reports. An Accelerated Failure Time (AFT) survival model and a truncation corrected method (TC), both with underlying Weibull distributions, were fitted to the data to estimate LoS from hospital admission date to an outcome (death or discharge) and from hospital admission date to Intensive Care Unit (ICU) admission date. In a second approach we fit a multi-state (MS) survival model to data directly from the Manchester University NHS Foundation Trust (MFT). We develop a planning tool that uses LoS estimates from these models to predict bed occupancy.
Results: All methods produced similar overall estimates of LoS for overall hospital stay, given a patient is not admitted to ICU (8.4, 9.1 and 8.0 days for AFT, TC and MS, respectively). Estimates differ more significantly between the local and national level when considering ICU. National estimates for ICU LoS from AFT and TC were 12.4 and 13.4 days, whereas in local data the MS method produced estimates of 18.9 days.
Conclusions: Given the complexity and partiality of different data sources and the rapidly evolving nature of the COVID-19 pandemic, it is most appropriate to use multiple analysis methods on multiple datasets. The AFT method accounts for censored cases, but does not allow for simultaneous consideration of different outcomes. The TC method does not include censored cases, instead correcting for truncation in the data, but does consider these different outcomes. The MS method can model complex pathways to different outcomes whilst accounting for censoring, but cannot handle non-random case missingness. Overall, we conclude that data-driven modelling approaches of LoS using these methods is useful in epidemic planning and management, and should be considered for widespread adoption throughout healthcare systems internationally where similar data resources exist.
Keywords: COVID-19; England; Length of stay; Survival Analysis.
© 2021. The Author(s).
Conflict of interest statement
The authors declare that they have no competing interests.
Figures
References
-
- UK Government. Slides and Datasets to Accompany Coronavirus Press Conferences. 2020. https://www.gov.uk/government/publications/slides-and-datasets-to-accomp.... Accessed 04 June 2020.
-
- Pellis L, Scarabel F, Stage HB, Overton CE, Chappell LH, Lythgoe KA, Fearon E, Bennett E, Curran-Sebastian J, Das R, et al. Challenges in control of covid-19: short doubling time and long delay to effect of interventions. Philos Trans R Soc B Biol Sci. 2021;376(1829):20200264. doi: 10.1098/rstb.2020.0264. - DOI - PMC - PubMed
-
- Mahase E. China coronavirus: what do we know so far?BMJ. 2020:m308. 10.1136/bmj.m308. - PubMed
-
- Sridhar D, Majumder MS. Modelling the pandemic. BMJ. 2020:m1567. 10.1136/bmj.m1567. - PubMed
MeSH terms
Grants and funding
LinkOut - more resources
Full Text Sources
Other Literature Sources
Medical
