

N6-Methyladenosine RNA modification in cerebrospinal fluid as a novel potential diagnostic biomarker for progressive multiple sclerosis
- PMID: 34294105
- PMCID: PMC8296732
- DOI: 10.1186/s12967-021-02981-5
N6-Methyladenosine RNA modification in cerebrospinal fluid as a novel potential diagnostic biomarker for progressive multiple sclerosis
Abstract
Background: Progressive multiple sclerosis (PMS) is an uncommon and severe subtype of MS that worsens gradually and leads to irreversible disabilities in young adults. Currently, there are no applicable or reliable biomarkers to distinguish PMS from relapsing-remitting multiple sclerosis (RRMS). Previous studies have demonstrated that dysfunction of N6-methyladenosine (m6A) RNA modification is relevant to many neurological disorders. Thus, the aim of this study was to explore the diagnostic biomarkers for PMS based on m6A regulatory genes in the cerebrospinal fluid (CSF).
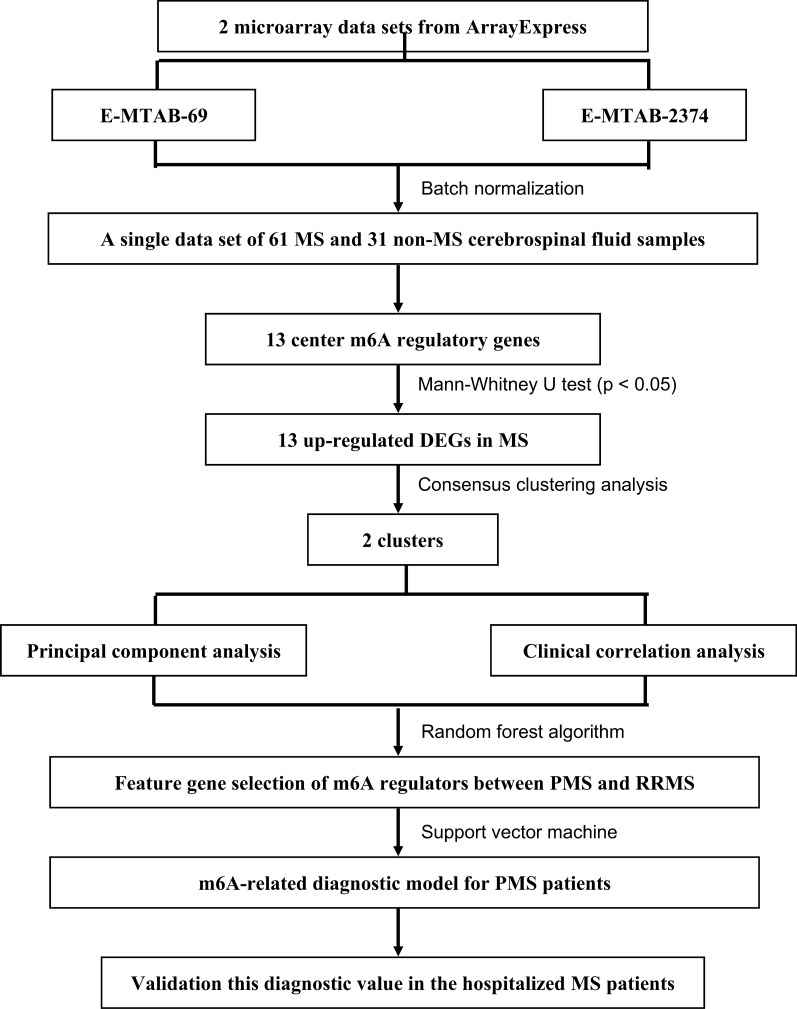
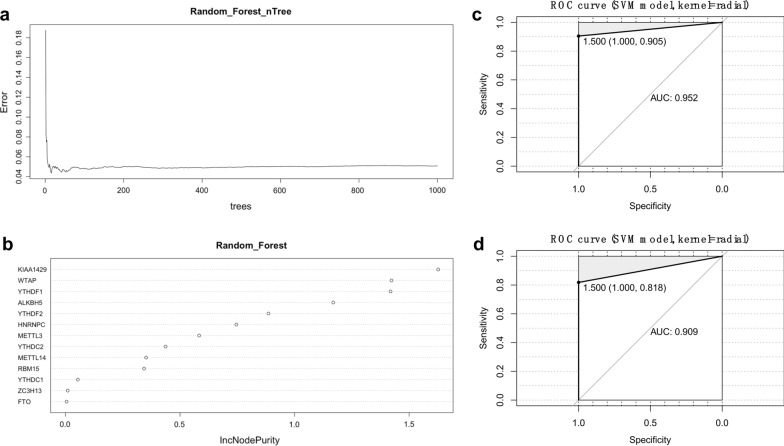
Methods: Gene expression matrices were downloaded from the ArrayExpress database. Then, we identified differentially expressed m6A regulatory genes between MS and non-MS patients. MS clusters were identified by consensus clustering analysis. Next, we analyzed the correlation between clusters and clinical characteristics. The random forest (RF) algorithm was applied to select key m6A-related genes. The support vector machine (SVM) was then used to construct a diagnostic gene signature. Receiver operating characteristic (ROC) curves were plotted to evaluate the accuracy of the diagnostic model. In addition, CSF samples from MS and non-MS patients were collected and used for external validation, as evaluated by an m6A RNA Methylation Quantification Kit and by real-time quantitative polymerase chain reaction.
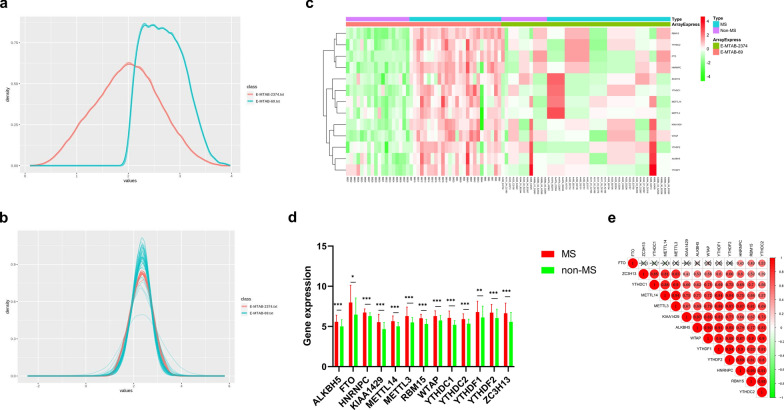
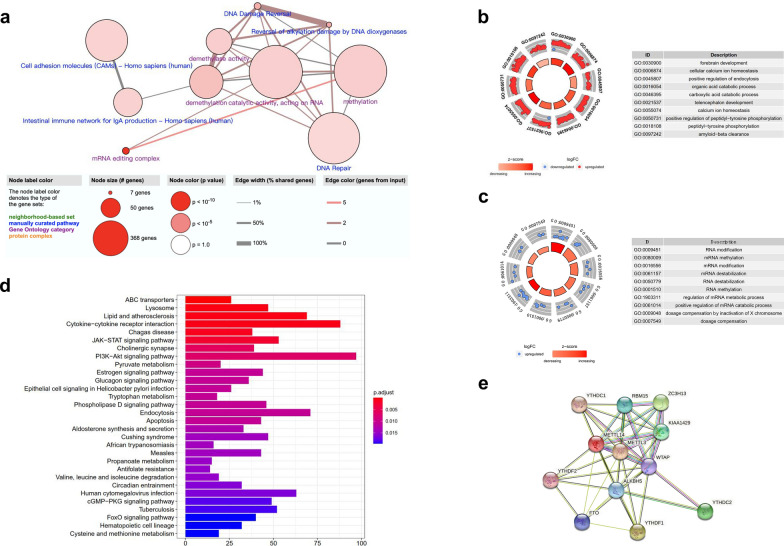
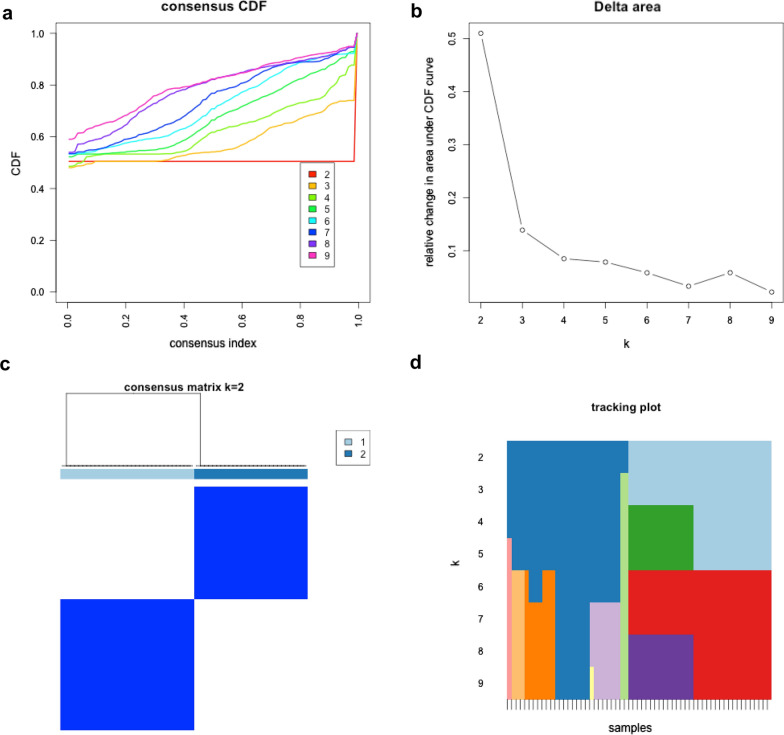
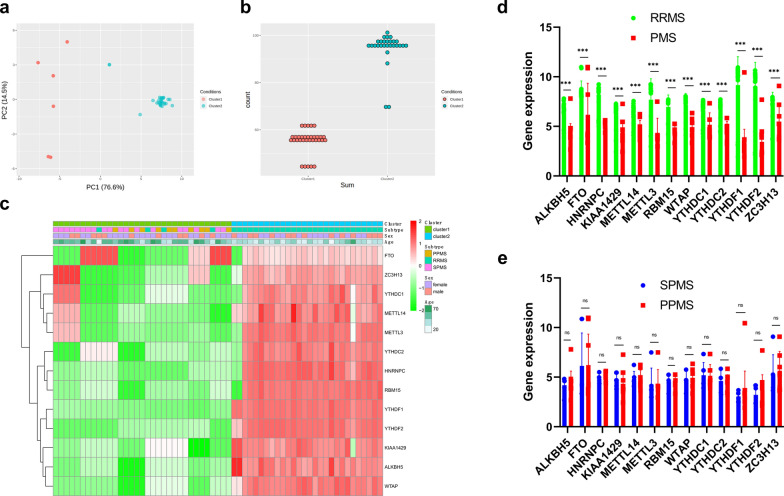
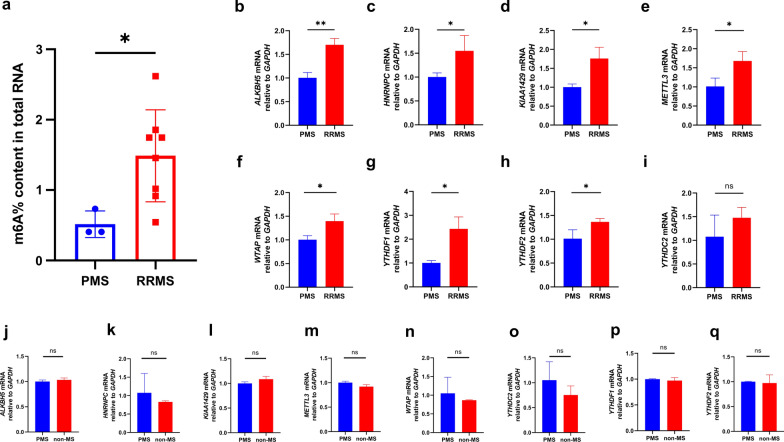
Results: The 13 central m6A RNA methylation regulators were all upregulated in MS patients when compared with non-MS patients. Consensus clustering analysis identified two clusters, both of which were significantly associated with MS subtypes. Next, we divided 61 MS patients into a training set (n = 41) and a test set (n = 20). The RF algorithm identified eight feature genes, and the SVM method was successfully applied to construct a diagnostic model. ROC curves revealed good performance. Finally, the analysis of 11 CSF samples demonstrated that RRMS samples exhibited significantly higher levels of m6A RNA methylation and higher gene expression levels of m6A-related genes than PMS samples.
Conclusions: The dynamic modification of m6A RNA methylation is involved in the progression of MS and could potentially represent a novel CSF biomarker for diagnosing MS and distinguishing PMS from RRMS in the early stages of the disease.
Keywords: Cerebrospinal fluid (CSF); Diagnostic biomarker; N6-methyladenosine (m6A); Progressive multiple sclerosis (PMS).
© 2021. The Author(s).
Conflict of interest statement
The authors declare that the research was conducted in the absence of any commercial or financial relationships that could be construed as a potential conflict of interest.
Figures
Similar articles
-
Cerebrospinal fluid sulfatide isoforms lack diagnostic utility in separating progressive from relapsing-remitting multiple sclerosis.Mult Scler Relat Disord. 2023 Jun;74:104705. doi: 10.1016/j.msard.2023.104705. Epub 2023 Apr 5. Mult Scler Relat Disord. 2023. PMID: 37060853
-
Potential Metabolite Biomarkers of Multiple Sclerosis from Multiple Biofluids.ACS Chem Neurosci. 2024 Mar 20;15(6):1110-1124. doi: 10.1021/acschemneuro.3c00678. Epub 2024 Feb 29. ACS Chem Neurosci. 2024. PMID: 38420772 Free PMC article.
-
Biomarkers of inflammation and axonal degeneration/damage in patients with newly diagnosed multiple sclerosis: contributions of the soluble CD163 CSF/serum ratio to a biomarker panel.PLoS One. 2015 Apr 10;10(4):e0119681. doi: 10.1371/journal.pone.0119681. eCollection 2015. PLoS One. 2015. PMID: 25860354 Free PMC article.
-
Recent Progress in the Identification of Early Transition Biomarkers from Relapsing-Remitting to Progressive Multiple Sclerosis.Int J Mol Sci. 2023 Feb 22;24(5):4375. doi: 10.3390/ijms24054375. Int J Mol Sci. 2023. PMID: 36901807 Free PMC article. Review.
-
Neurofilament light chain in blood as a diagnostic and predictive biomarker for multiple sclerosis: A systematic review and meta-analysis.PLoS One. 2022 Sep 14;17(9):e0274565. doi: 10.1371/journal.pone.0274565. eCollection 2022. PLoS One. 2022. PMID: 36103562 Free PMC article.
Cited by
-
Regulatory roles of N6-methyladenosine (m6A) methylation in RNA processing and non-communicable diseases.Cancer Gene Ther. 2024 Oct;31(10):1439-1453. doi: 10.1038/s41417-024-00789-1. Epub 2024 Jun 5. Cancer Gene Ther. 2024. PMID: 38839892 Review.
-
Molecular Mechanisms of Immunosenescene and Inflammaging: Relevance to the Immunopathogenesis and Treatment of Multiple Sclerosis.Front Neurol. 2022 Feb 25;12:811518. doi: 10.3389/fneur.2021.811518. eCollection 2021. Front Neurol. 2022. PMID: 35281989 Free PMC article. Review.
-
Exploring the impact of m6A modification on immune diseases: mechanisms and therapeutic implication.Front Immunol. 2024 Jul 12;15:1387582. doi: 10.3389/fimmu.2024.1387582. eCollection 2024. Front Immunol. 2024. PMID: 39072324 Free PMC article. Review.
-
The Role of N6-Methyladenosine in Inflammatory Diseases.Oxid Med Cell Longev. 2022 Dec 12;2022:9744771. doi: 10.1155/2022/9744771. eCollection 2022. Oxid Med Cell Longev. 2022. PMID: 36578520 Free PMC article. Review.
-
YTHDF1 Attenuates TBI-Induced Brain-Gut Axis Dysfunction in Mice.Int J Mol Sci. 2023 Feb 20;24(4):4240. doi: 10.3390/ijms24044240. Int J Mol Sci. 2023. PMID: 36835655 Free PMC article.
References
Publication types
MeSH terms
Substances
LinkOut - more resources
Full Text Sources
Medical
