. 2021 Jul 23:38:E010.
doi: 10.1017/S0952523821000092.

K+-dependent Müller cell-generated components of the electroretinogram

Affiliations

K+-dependent Müller cell-generated components of the electroretinogram

Andrey V Dmitriev et al. Vis Neurosci. .

Abstract

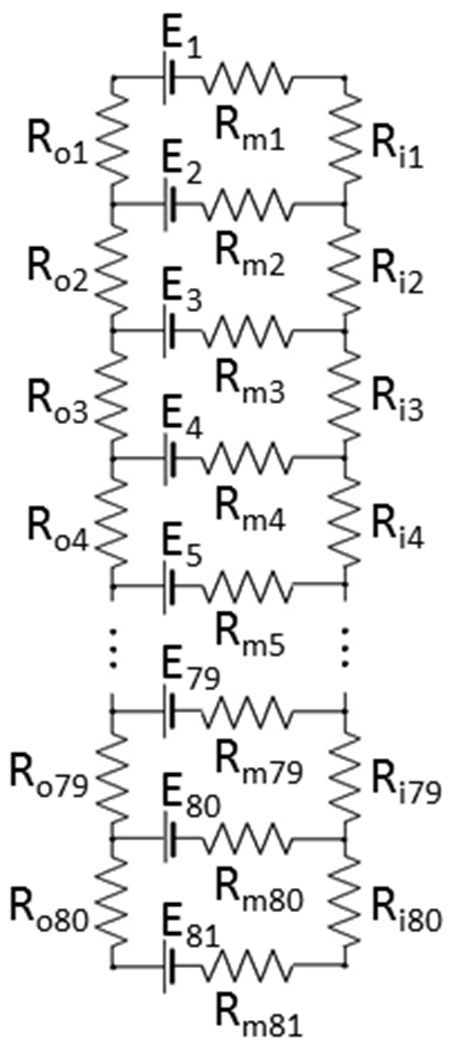
The electroretinogram (ERG) has been employed for years to collect information about retinal function and pathology. The usefulness of this noninvasive test depends on our understanding of the cell sources that generate the ERG. Important contributors to the ERG are glial Müller cells (MCs), which are capable of generating substantial transretinal potentials in response to light-induced changes in extracellular K+ concentration ([K+]o). For instance, the MCs generate the slow PIII (sPIII) component of the ERG as a reaction to a photoreceptor-induced [K+]o decrease in the subretinal space. Similarly, an increase of [K+]o related to activity of postreceptor retinal neurons also produces transretinal glial currents, which can potentially influence the amplitude and shape of the b-wave, one of the most frequently analyzed ERG components. Although it is well documented that the majority of the b-wave originates from On-bipolar cells, some contribution from MCs was suggested many years ago and has never been experimentally rejected. In this work, detailed information about light-evoked [K+]o changes in the isolated mouse retina was collected and then analyzed with a relatively simple linear electrical model of MCs. The results demonstrate that the cornea-positive potential generated by MCs is too small to contribute noticeably to the b-wave. The analysis also explains why MCs produce the large cornea-negative sPIII subcomponent of the ERG, but no substantial cornea-positive potential.

Keywords: K+-selective microelectrodes; Müller cells; computer simulation; electroretinogram; retina.


Figures

Fig. 1.
Fig. 1.
Equivalent electrical model of mouse MC. All explanations are in the text.
Fig. 2.
Fig. 2.
Distribution of resistances along the electrical model of mouse MCs. A. The transretinal resistors, extracellular, Ro (green lines) and intracellular, Ri (yellow lines). Dotted lines for set o1 and set i1;solid lines for sets o2 and i2. B. The transmembrane resistors, Rm. Black horizontal line for set m1, a uniform distribution. The blue line is for set m2, extracted from morphometric data of Rasmussen, 1973. The red line is for set m3, extracted from electrophysiological measurements of Newman, 1987. Calculated for Rinp = 25MΩ.
Fig. 3.
Fig. 3.
The depth profile of the light-induced [K+]o changes and local ERGs in the mouse retina. The retinal depth (in %) is measured from the vitreal (grounded) surface of the retina. The grey area marks the light stimulus (3 s in duration). For the amplitude scaling, the space between the start of Δ[K+]o traces is 0.5 mM, and the space between the start of ERG traces is 2mV. The local ERG (LERG) is presented with a polarity (cornea-negative up) opposite to conventional electroretinography due to the configuration of the recording in the isolated retina. The b-wave and sPIII are labeled at the lowermost LERG. For reference, the retinal layers are indicated to the right of the retinal depth.
Fig. 4.
Fig. 4.
Time summation of ERG and light-induced changes of [K+]o. ERG and [K+]o changes in distal retina (ONL) were recorded simultaneously; the proximal increases of [K+]o were recorded in separate series with the electrode in the INL (upper part) or IPL (lower part). The records in the upper and lower parts were obtained from different retinas. Scale for vertical bars: 0.5 mM for [K+]o.
Fig. 5.
Fig. 5.
The matrix of the light-induced [K+]o changes in the mouse retina. A. Visualized as the 3-D color map surface. B. Visualized as the color-filled contour plot. Time= 0 corresponds to the start of the light stimulus that lasts for 3 s. In the dark, [Kþ]o is assumed to be uniformly 3.6 mM.
Fig. 6.
Fig. 6.
Results of MC response simulations. The calculated responses (red lines) are compared to the real LERGs (black lines) at the same retinal depth. Vertical scale bar: 2 mV; horizontal scale bar: 3 s. The numbers on the right of the traces are the retinal depths (in %) at which they are recorded or calculated.
Fig. 7.
Fig. 7.
The real LERGs (black lines) are compared to the results of calculations for the same retinal depth, but with four different sets of parameters: o2-i1-m3 with Rinp= 22 MΩ (blue lines), o2-i2-m2 with Rinp = 23 MΩ (green lines), o2-i2-m3 with Rinp = 17.3 MΩ (red lines), and o2-i2-m4 with Rinp = 20 MΩ (grey lines). Vertical scale bar: 2 mV; horizontal scale bar: 3 s. The numbers on the right of the traces are the retinal depths (in %) at which they are recorded or calculated.
Fig. 8.
Fig. 8.
The K+ source-dependent components of the MC’s transretinal response. The numbers in the labels for parts of the figure are the retinal depths (in %) at which changes in [K+]o were taken into account, when [K+]o in all other layers remained unchanged. The calculations were performed with the set o2-i2-m3, Rinp = 17.3 MΩ. Vertical scale bar: 2 mV; horizontal scale bar: 3 s. The numbers on the right of the traces are the retinal depths (in %) at which they are calculated.
Fig. 9.
Fig. 9.
Intracellular responses of modelled MCs to light-induced [K+]o changes at different depths in the mouse retina. The numbers to the right of the color traces are retinal depth (in %) at which the transmembrane potential was calculated. Vertical scaling bar: 3 mV.

References

    1. Berger A, Cavallero S, Dominguez E, Barbe P, Simonutti M, Sahel J-A, Sennlaub F, Raoul W, Paques M & Bemelmans A-P (2014). Spectral-domain optical coherence tomography of the rodent eye: highlighting layers of the outer retina using signal averaging and comparison with histology. PloS one 9. - PMC - PubMed
    1. Bolnick DA, Walter AE & Sillman AJ (1979). Barium suppresses slow PIII in perfused bullfrog retina. Vision research 19, 1117–1119. - PubMed
    1. Brew H, Gray PT, Mobbs P & Attwell D (1986). Endfeet of retinal glial cells have higher densities of ion channels that mediate K+ buffering. Nature 324, 466. - PubMed
    1. Bringmann A, Pannicke T, Grosche J, Francke M, Wiedemann P, Skatchkov SN, Osborne NN & Reichenbach A (2006). Müller cells in the healthy and diseased retina. Progress in retinal and eye research 25, 397–424. - PubMed
    1. Brown KT (1968). The electroretinogram: its components and their origins. Vision research 8, 633–677. - PubMed

Publication types