. 2021 Jul 22;11(1):404.
doi: 10.1038/s41398-021-01506-4.

No evidence for differential gene expression in major depressive disorder PBMCs, but robust evidence of elevated biological ageing

Affiliations

No evidence for differential gene expression in major depressive disorder PBMCs, but robust evidence of elevated biological ageing

John J Cole et al. Transl Psychiatry. .

Abstract

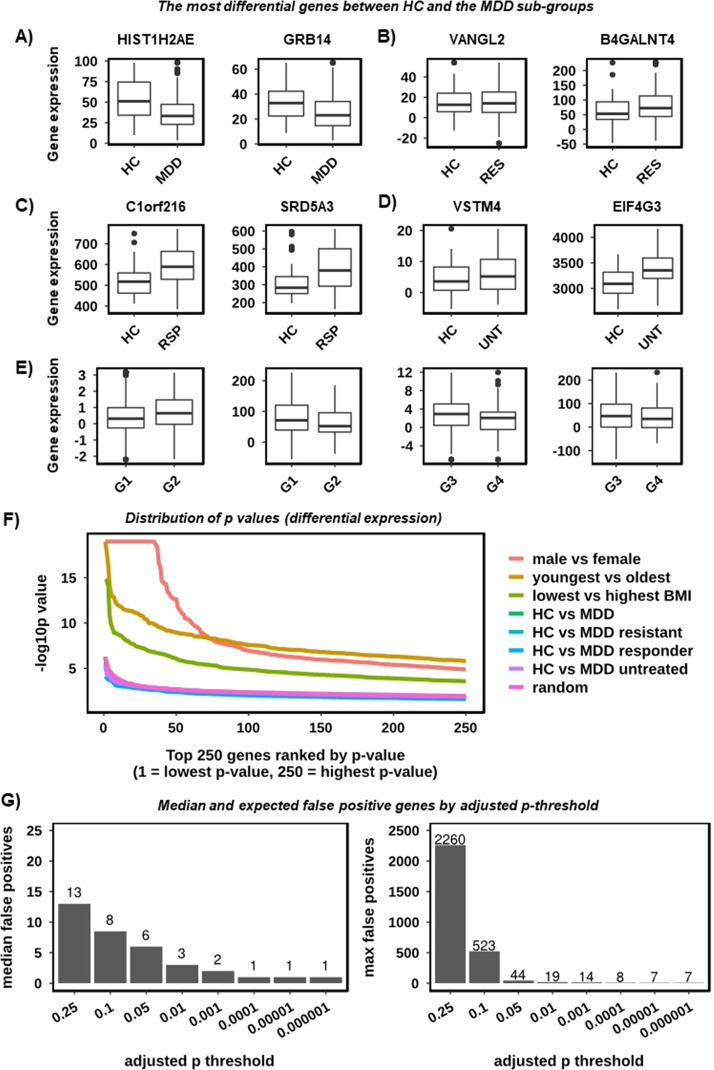
The increasingly compelling data supporting the involvement of immunobiological mechanisms in Major Depressive Disorder (MDD) might provide some explanation forthe variance in this heterogeneous condition. Peripheral blood measures of cytokines and chemokines constitute the bulk of evidence, with consistent meta-analytic data implicating raised proinflammatory cytokines such as IL6, IL1β and TNF. Among the potential mechanisms linking immunobiological changes to affective neurobiology is the accelerated biological ageing seen in MDD, particularly via the senescence associated secretory phenotype (SASP). However, the cellular source of immunobiological markers remains unclear. Pre-clinical evidence suggests a role for peripheral blood mononuclear cells (PBMC), thus here we aimed to explore the transcriptomic profile using RNA sequencing in PBMCs in a clinical sample of people with various levels of depression and treatment response comparing it with that in healthy controls (HCs). There were three groups with major depressive disorder (MDD): treatment-resistant (n = 94), treatment-responsive (n = 47) and untreated (n = 46). Healthy controls numbered 44. Using PBMCs gene expression analysis was conducted using RNAseq to a depth of 54.5 million reads. Differential gene expression analysis was performed using DESeq2. The data showed no robust signal differentiating MDD and HCs. There was, however, significant evidence of elevated biological ageing in MDD vs HC. Biological ageing was evident in these data as a transcriptional signature of 888 age-associated genes (adjusted p < 0.05, absolute log2fold > 0.6) that also correlated strongly with chronological age (spearman correlation coefficient of 0.72). Future work should expand clinical sample sizes and reduce clinical heterogeneity. Exploration of RNA-seq signatures in other leukocyte populations and single cell RNA sequencing may help uncover more subtle differences. However, currently the subtlety of any PBMC signature mitigates against its convincing use as a diagnostic or predictive biomarker.


Conflict of interest statement

This work was funded by a Wellcome Trust strategy award to the Neuroimmunology of Mood Disorders and Alzheimer’s Disease (NIMA) Consortium, which is also funded by Janssen, GlaxoSmithKline, Lundbeck and Pfizer. Dr. Drevets and Dr. De Boer are employees of Janssen Research & Development, LLC, of Johnson & Johnson and hold equity in Johnson & Johnson.

Figures

Fig. 1
Fig. 1. Quality control and identification of confounding variables.
A Distribution of immune cell types across all 231 PBMC samples. Cell types are shown on the x-axis, and the percentage of the cell population that is described by each cell type is shown on the y-axis. Each box represents all 231 samples. B Bar chart showing the number of significantly different genes (DESeq2 adjusted p value < 0.01) across all clinical parameters with at least five significant genes. C Gene expression heatmaps highlighting the size and consistency of the confounding effects of age (left), gender (middle), and BMI (right) on the PBMC RNA-seq data. Samples are given by column and differentially expressed genes (adjusted p < 0.01) by row. Colour intensity indicated row scaled (z-score) gene expression, with blue as low and yellow as high. D Gene expression boxplots of the most significantly different gene between youngest and oldest (ROBO1), male and female (ZFY), and lowest and highest BMI (CA1). Sample groups are shown on the x-axis and gene expression values (Corrected DESeq2 normalised counts) on the y-axis.
Fig. 2
Fig. 2. There is no evidence for a classical differential expression signature between HC and MDD in PBMCs.
A Gene expression boxplots highlighting the most significantly different genes between HC and MDD. Sample groups are shown on the x-axis and gene expression values (DESeq2 normalised counts) on the y-axis. B As A however for HC vs the MDD treatment-resistant group. C As A however for HC vs the MDD treatment-responsive group. D As A however for HC vs the MDD untreated group. E As A however for the two most significant genes from each of two comparisons of randomised cases and controls. Randomised groups are labelled G1–G4. F Distribution of differential expression p-values highlighting the consistency between HC vs MDD and randomised cases and controls. The 250 most significant genes for each comparison are shown on the x-axis (ranked from lowest to highest) and the p value (as −log10) on the y-axis. Lines are given for the three confounding variables Gender (‘male vs female’), Age (‘youngest vs oldest’), BMI (‘lowest vs highest’), HC vs the four MDD types (MDD, MDD treatment-resistant, MDD treatment-responsive and MDD untreated) and for the average of 50 comparisons of randomised cases and controls (‘random’). G Bar charts highlighting the number of differentially expressed genes that were expected to be false positives by adjusted p threshold, based on 50 iterations of randomised cases and controls. The adjusted p threshold is given on the x-axis and the median (left) and maximum (right) number of expected false positives on the y-axis.
Fig. 3
Fig. 3. There is no evidence for clusters of highly correlating genes that are altered in MDD compared to HC.
A Gene co-expression heatmap highlighting the presence of clusters of highly correlating genes in PBMC data. The x and y-axis show the 5356 highly correlating genes. The colour intensity indicates the spearman correlation value between two given genes with blue as low and yellow as high. To highlight the presence of co-expression clusters the heatmap has been hierarchically clustered on both axes using Spearman distances, with UPMGA agglomeration and mean reordering. B Gene expression heatmaps for six gene co-expression clusters, highlighting the consistency between the expression pattern of all genes within a cluster across all 231 samples. Samples are given by column and cluster genes by row. Colour intensity indicated row scaled (z-score) gene expression, with blue as low and yellow as high. C Gene expression boxplots for the six clusters with the lowest p-value (T-test) for HC vs MDD. Showing sample group on the x-axis and the cluster metagene expression (mean z-score) on the y-axis. All clusters are non-significant with adjusted p > 0.25.
Fig. 4
Fig. 4. Relative to patient age biological age is greater in MDD patients than in HC.
A Scatterplots for PBMC RNA-seq data (left) and whole blood expression microarray data (right), showing the correlation between chronological age (x-axis) and biological age (y-axis) as defined by the mean expression z-score across all age-related genes, per sample. A linear regression line, alongside the Spearman Correlation Coefficient (SCC) and associated p-value is shown. B Density plots of the residuals from the linear regressions in A. A positive residual indicates a sample above the regression line and negative below.

References

    1. Wray NR, Ripke S, Mattheisen M, Trzaskowski M, Byrne EM, Abdellaoui A, et al. Genome-wide association analyses identify 44 risk variants and refine the genetic architecture of major depression. Nature Genetics. 2018;50:668–81. doi: 10.1038/s41588-018-0090-3. - DOI - PMC - PubMed
    1. Mostafavi S, Battle A, Zhu X, Potash JB, Weissman MM, Shi J, et al. Type I interferon signaling genes in recurrent major depression: increased expression detected by whole-blood RNA sequencing. Mol Psychiatry. 2014;19:1267–74. doi: 10.1038/mp.2013.161. - DOI - PMC - PubMed
    1. Benayoun BA, Pollina EA, Singh PP, Mahmoudi S, Harel I, Casey KM, et al. Remodeling of epigenome and transcriptome landscapes with aging in mice reveals widespread induction of inflammatory responses. Genome Res. 2019;29:697–709. doi: 10.1101/gr.240093.118. - DOI - PMC - PubMed
    1. Diniz BS, Reynolds Iii CF, Sibille E, Bot M, Penninx B. Major depression and enhanced molecular senescence abnormalities in young and middle-aged adults. Transl Psychiatry. 2019;9:198. doi: 10.1038/s41398-019-0541-3. - DOI - PMC - PubMed
    1. McKim DB, Weber MD, Niraula A, Sawicki CM, Liu X, Jarrett BL, et al. Microglial recruitment of IL-1beta-producing monocytes to brain endothelium causes stress-induced anxiety. Mol Psychiatry. 2018;23:1421–31. doi: 10.1038/mp.2017.64. - DOI - PMC - PubMed

Publication types