. 2021 Jul 22;12(1):4457.
doi: 10.1038/s41467-021-24813-2.

Oncogenic enhancers drive esophageal squamous cell carcinogenesis and metastasis

Affiliations

Oncogenic enhancers drive esophageal squamous cell carcinogenesis and metastasis

Bo Ye et al. Nat Commun. .

Abstract

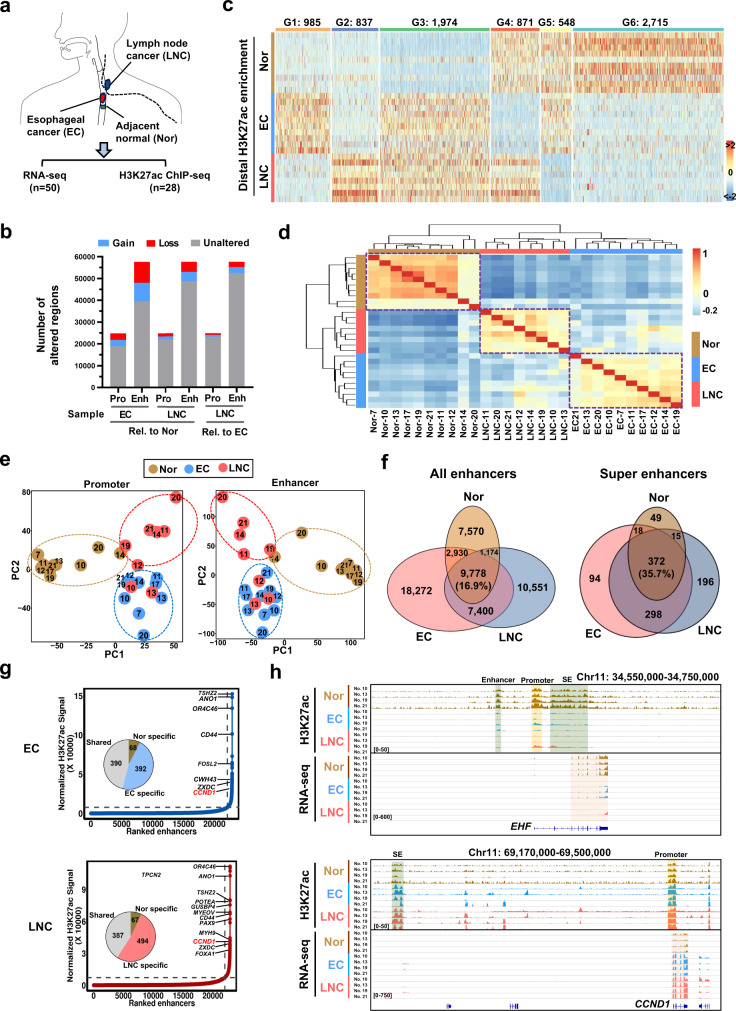
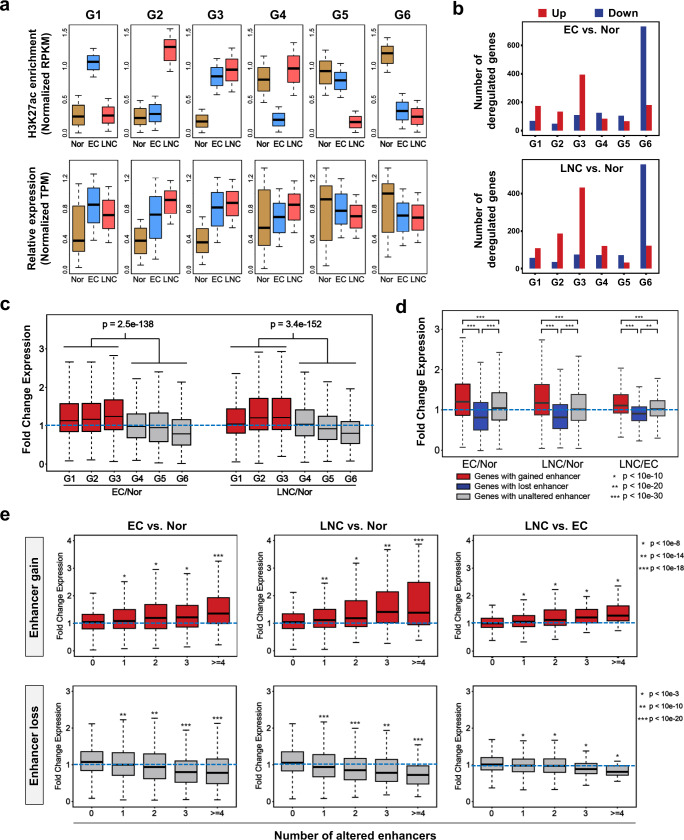
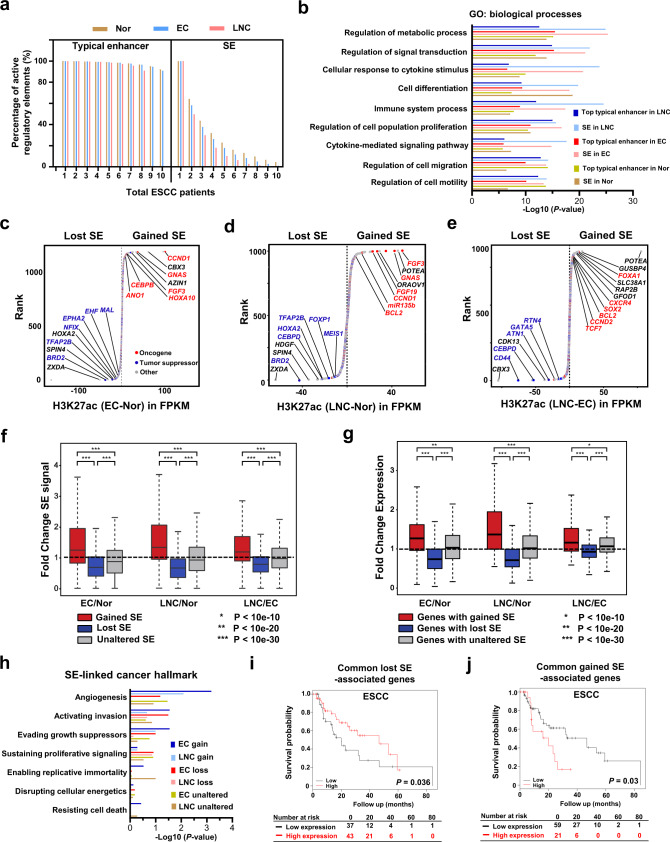
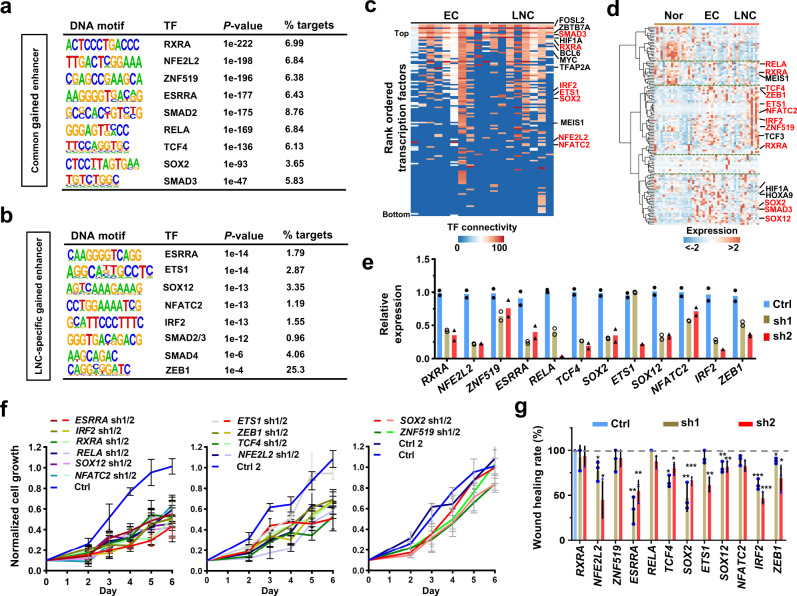
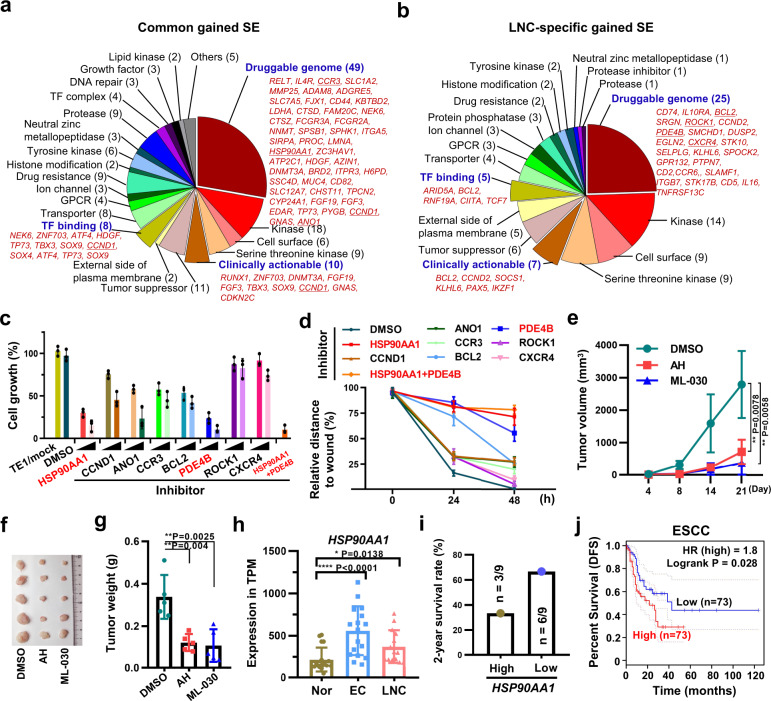
The role of cis-elements and their aberrations remains unclear in esophageal squamous cell carcinoma (ESCC, further abbreviated EC). Here we survey 28 H3K27ac-marked active enhancer profiles and 50 transcriptomes in primary EC, metastatic lymph node cancer (LNC), and adjacent normal (Nor) esophageal tissues. Thousands of gained or lost enhancers and hundreds of altered putative super-enhancers are identified in EC and LNC samples respectively relative to Nor, with a large number of common gained or lost enhancers. Moreover, these differential enhancers contribute to the transcriptomic aberrations in ECs and LNCs. We also reveal putative driver onco-transcription factors, depletion of which diminishes cell proliferation and migration. The administration of chemical inhibitors to suppress the predicted targets of gained super-enhances reveals HSP90AA1 and PDE4B as potential therapeutic targets for ESCC. Thus, our epigenomic profiling reveals a compendium of reprogrammed cis-regulatory elements during ESCC carcinogenesis and metastasis for uncovering promising targets for cancer treatment.


Conflict of interest statement

The authors declare no competing interests.

Figures

Fig. 1
Fig. 1. H3K27ac profiling defines active regulatory elements in primary esophageal and metastatic lymph node tumors.
a Diagram of the experimental design for profiling the transcriptome and epigenome of adjacent normal tissues (Nor), esophageal squamous cell cancer (EC) tissues, and lymph node cancer (LNC) tissues. b Identification of the differentially distributed enhancers in Nor (n = 10), EC (n = 10), and LNC (n = 8) tissues. The numbers of altered (gained or lost) promoters (Pro) or enhancers (Enh) upon the comparison of Nor with EC or LNC, or EC with LNC are presented. Rel. relative. c Heatmap of the altered enhancers across Nor (n = 10), EC (n = 10), and LNC (n = 8) samples with H3K27ac enrichment signals. Six groups (G1–G6) of enhancers with H3K27ac enrichment signals with the indicated number of enhancer elements are presented. d Unsupervised hierarchical clustering analysis of 28 Nor, EC, and LNC samples’ differential enhancers shown in c. The number of patients number is also provided. e Principal component analysis of 28 Nor (n = 10), EC (n = 10), and LNC (n = 8) samples using all differentially distributed promoter elements shown in Supplementary Fig. 5a and enhancers shown in c. f Venn diagrams depicting the numbers of shared enhancers (left) and super-enhancers (right) across Nor, EC, and LNC samples. g Identification of super-enhancers in EC and LNC samples in infection plots. The top super-enhancer-associated genes are labeled. The number of shared, EC-specific, and LNC-specific super-enhancers across the three types of samples are displayed in pie charts. h Tracks of H3K27ac ChIP-seq and RNA-seq data at the EHF and CCND1 loci in four representatives paired Nor, EC, and LNC samples. The previously identified enhancer upstream of the CCND1 promoter is indicated. Source data are provided as a Source Data file.
Fig. 2
Fig. 2. Gained and lost enhancers contribute to aberrant gene expression.
a Normalized H3K27ac peak enrichment in (upper panel) and expression (lower panel) of differential enhancer (G1–G6)-associated genes in Nor (n = 10), EC (n = 10), and LNC (n = 8) samples. The P values for all comparisons were <0.001, as calculated by the Kruskal–Wallis rank-sum test. Boxes correspond to interquartile ranges (IQR), thick black lines indicate the median values, and the whiskers extend to the lowest or highest data point that are still within 0.5 IQR of the bottom or top quartile, respectively. b Numbers of upregulated and downregulated genes (EC vs. Nor or LNC vs. Nor) linked to differential enhancers (G1–G6). c The expression fold changes (EC/Nor or LNC/Nor) in differential enhancer (G1–G6)-associated genes. P value was calculated by the two-sided Wilcoxon test (no adjustments). d The expression fold change (EC/Nor, LNC/Nor, or LNC/EC) in all differential enhancer-associated genes (EC vs. Nor, LNC vs. Nor, or LNC vs. EC) from Nor (n = 10), EC (n = 10), and LNC (n = 8) samples. P value was calculated by the two-sided Wilcoxon test (no adjustments). *P < 10e-10, **P < 10e-20, ***P < 10e-30. e The expression fold changes in genes associated with the indicated number of gained (red) and lost enhancers (gray) are presented. P value was calculated by the two-sided Wilcoxon test (no adjustments). Upper panel: *P < 10e-8, **P < 10e-14, ***P < 10e-18. Lower panel: *P < 10e-3, **P < 10e-10, ***P < 10e-20. c–e, Data points represent means of Nor (n = 10), EC (n = 10), and LNC (n = 8) samples. Boxes correspond to interquartile ranges (IQR), thick black lines indicate the median values, and the whiskers extend to the lowest or highest data point that are still within 1.5 IQR of the bottom or top quartile, respectively. Source data are provided as a Source Data file.
Fig. 3
Fig. 3. Super-enhancer signatures in primary and lymph node tumors.
a Percentage of predicted typical enhancers and super-enhancers (SE) across Nor (n = 10), EC (n = 10), and LNC (n = 8) tissues showing H3K27ac enrichment above that of randomly selected regions (99%) across an increasing number of patients. b Gene Ontology (GO) analysis of the top 2000 predicted typical enhancer-linked genes and SE-associated genes; the top significantly associated biological processes are presented. ce A total of 1317 super-enhancers are ranked by their differential H3K27ac intensity between EC and Nor, LNC and Nor, as well as LNC and EC samples. Genes associated with the top gained and lost SEs are listed; oncogenes are highlighted in red, and tumor suppressors are highlighted in blue. f, g Fold changes in H3K27ac enrichment signals (f) and expression levels for differential SE-associated genes (g) (EC/Nor, LNC/Nor, or LNC/EC) and for differential SE (gained and lost)-associated genes (EC vs. Nor, LNC vs. Nor, or LNC vs. EC). Unaltered SE-associated genes were used as controls. Data points represent means of Nor (n = 10), EC (n = 10), and LNC (n = 8) samples. Boxes correspond to interquartile ranges (IQR), thick black lines indicate the median values, and the whiskers extend to the lowest or highest data point that are still within 1.5 IQR of the bottom or top quartile, respectively. P value was calculated by the two-sided Wilcoxon test (no adjustments). *P < 10e-10, **P < 10e-20, ***P < 10e-30. h Cancer hallmark analysis using differentially predicted SEs showing recurrently gained, recurrently lost, and unaltered H3K27ac signals in EC or LNC relative to Nor. The log (adjust P value) obtained from the hypergeometric test is shown. i, j Survival analysis comparing groups of patients with high or low expression of the top common lost (i) or gained (j) SE-associated genes in ESCC TCGA data using Kaplan–Meier plotter. A poor prognosis observed for ESCC patients with tumors possessing a high expression signature of gained SE-associated genes and a low expression signature of lost SE-associated genes. Survival data are presented every 20 months. A Log-rank test was performed for survival data. Source data are provided as a Source Data file.
Fig. 4
Fig. 4. Transcription factor circuitries of esophageal carcinogenesis and metastasis.
a, b Top transcription factor (TF) binding motifs predicted from common gained (a) or LNC-specific gained (b) enhancers using HOMER. The predicted TFs are ranked by their P value (two-sided binomial test), and the proportion of targets potently regulated by these TFs is also presented. c Heatmap of TFs ranked by their predicted activity using core circuitry analysis. Representative genes with high TF connectivity are presented. d Heatmap showing the expression of common gained or LNC-specific gained enhancer predicted TFs in the Nor, EC, and LNC groups. The TFs shown in a, b are highlighted in red. e Assessment of knockdown efficiency by shRNAs. Two shRNAs were constructed for each TF, and shRNA expressing TE1 cells were subjected to quantitative real-time PCR analysis. The expression of each TF in control cells expressing the control shRNA was normalized to “1”. Ctrl, control. n = 2 biologically independent experiments examined. f Control or shRNA expressing TE1 cells were counted using a cell counter and control cells were duplicated in this experiment (Ctrl and Ctrl2). The number of cells from three wells was averaged as a single replicate for each sample, and results were obtained from three replicates. The time course curve of the normalized cell number was plotted. Data were presented as mean values ± s.d. n = 3 biologically independent experiments examined. g Wound healing assays were performed with control and shRNA expressing TE1 cells, and the wound healing rate was calculated for each group. The wound healing rate was calculated as shown in Supplementary Fig. 17b. Data were presented as mean values ± s.d. n = 3 biologically independent experiments examined. Statistics: *P < 0.05, **P < 0.01, ***P < 0.001, unpaired t-test. Source data are provided as a Source Data file.
Fig. 5
Fig. 5. Active regulatory super-enhancers predict candidate drugs against esophageal carcinogenesis and metastasis.
a, b Pie charts showing candidate drug compounds detected through the integrated analysis of common gained (a) and LNC-specific (b) super-enhancers with the Washington University Drug Gene Interaction Database. Three categories are highlighted in red. c TE1 cells were treated with eight chemical inhibitors separately or combinationally (AH + ML-030). Cells were counted at 72 h. Data were presented as mean values ± s.d. n = 3 biologically independent experiments examined. d Wound healing assays for control and shRNA expressing TE1 cells. The wound width was examined every 24 h, and the wound width at 0 h was normalized to “1”, and the relative width to the width at 0 h was calculated. Data were presented as mean values ± s.d. n = 3 biologically independent experiments examined. eg Xenograft analysis of tumor growth. Immunodeficient nude mice injected with TE1 cells were treated with AH or ML-030, and tumor volumes were determined (e). The tumors were collected from sacrificed mice on day 21 for image acquisition (f) and tumor weight determination (g). For pooled data from five repeats, values indicate the mean ± s.d. A presentative data from n = 2 independent experiments was shown. e two-way ANOVA test with Geisser-Greenhouse correction, **P < 0.01. g unpaired t-test (two-tailed), **P < 0.01. h Expression of HSP90AA1 in Nor, EC, and LNC samples from our RNA-seq data. Data were presented as mean values ± s.d. n = 18 for Nor and EC; n = 14 for LNC. *P < 0.05, ****P < 0.0001, unpaired t-test (two-tailed). i The 2-year survival rate for two groups of patients (n = 9 for each group) possessing high or low HSP90AA1 expression as determined from clinical data in the present study. n = 3/9 (33.33%) in HSP90AA1-high and n = 6/9 (66.67%) HSP90AA1-low patients, presented as a single 2-year survival rate, were survival till Sep 2020. j The disease-free survival (DFS) rate was analyzed by comparing ESCC patient groups with high (n = 73) or low (n = 73) HSP90AA1 expression using GEPIA. Source data are provided as a Source Data file. A Log-rank test was performed for the survival data.

References

    1. Chen W, et al. Esophageal cancer incidence and mortality in China, 2009. J. Thorac. Dis. 2013;5:19–26. - PMC - PubMed
    1. Malhotra GK, et al. Global trends in esophageal cancer. J. Surg. Oncol. 2017;115:564–579. doi: 10.1002/jso.24592. - DOI - PubMed
    1. Rustgi AK, El-Serag HB. Esophageal carcinoma. N. Engl. J. Med. 2014;371:2499–2509. doi: 10.1056/NEJMra1314530. - DOI - PubMed
    1. Peyre CG, et al. The number of lymph nodes removed predicts survival in esophageal cancer: an international study on the impact of extent of surgical resection. Ann. Surg. 2008;248:549–556. doi: 10.1097/SLA.0b013e318188c474. - DOI - PubMed
    1. Zhang L, et al. Gene expression profiles in normal and cancer cells. Science. 1997;276:1268–1272. doi: 10.1126/science.276.5316.1268. - DOI - PubMed

Publication types

Substances