. 2021 Jul 22;11(1):15043.
doi: 10.1038/s41598-021-94188-3.

Safety evaluation of a clinical focused ultrasound system for neuronavigation guided blood-brain barrier opening in non-human primates

Affiliations

Safety evaluation of a clinical focused ultrasound system for neuronavigation guided blood-brain barrier opening in non-human primates

Antonios N Pouliopoulos et al. Sci Rep. .

Abstract

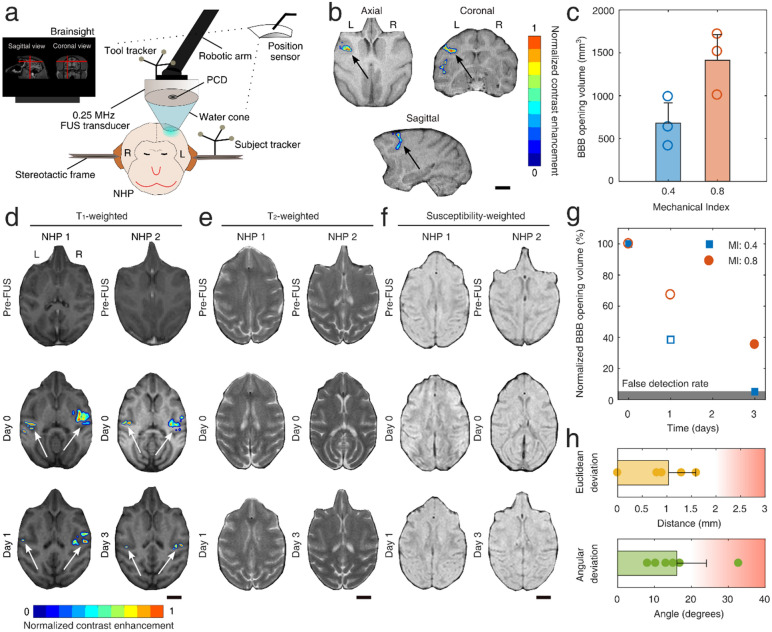
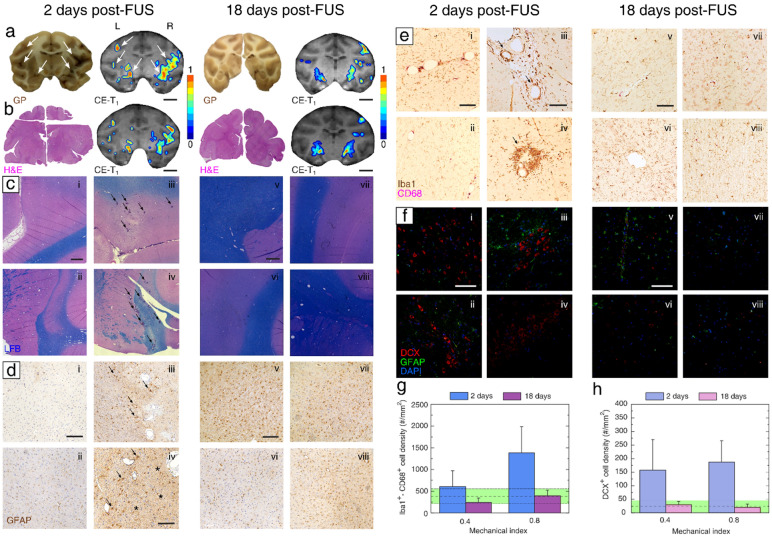
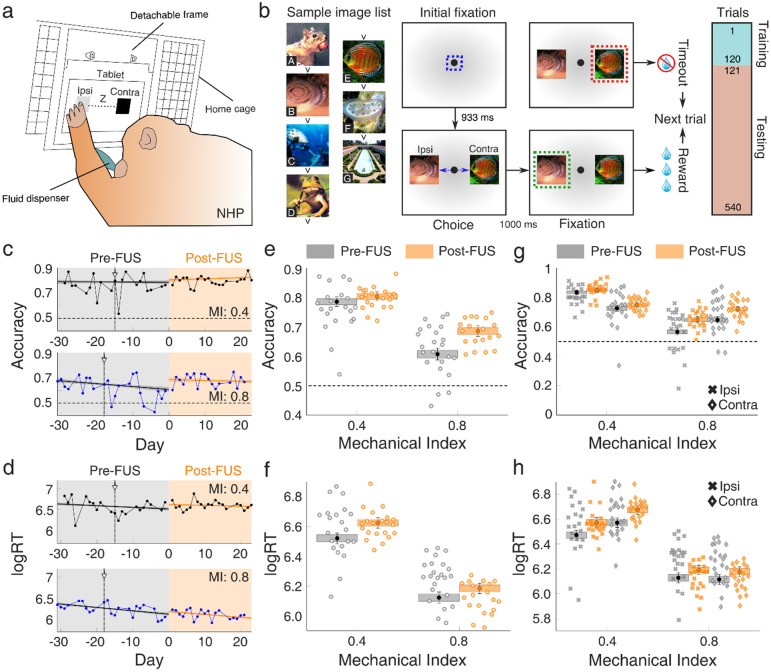
An emerging approach with potential in improving the treatment of neurodegenerative diseases and brain tumors is the use of focused ultrasound (FUS) to bypass the blood-brain barrier (BBB) in a non-invasive and localized manner. A large body of pre-clinical work has paved the way for the gradual clinical implementation of FUS-induced BBB opening. Even though the safety profile of FUS treatments in rodents has been extensively studied, the histological and behavioral effects of clinically relevant BBB opening in large animals are relatively understudied. Here, we examine the histological and behavioral safety profile following localized BBB opening in non-human primates (NHPs), using a neuronavigation-guided clinical system prototype. We show that FUS treatment triggers a short-lived immune response within the targeted region without exacerbating the touch accuracy or reaction time in visual-motor cognitive tasks. Our experiments were designed using a multiple-case-study approach, in order to maximize the acquired data and support translation of the FUS system into human studies. Four NHPs underwent a single session of FUS-mediated BBB opening in the prefrontal cortex. Two NHPs were treated bilaterally at different pressures, sacrificed on day 2 and 18 post-FUS, respectively, and their brains were histologically processed. In separate experiments, two NHPs that were earlier trained in a behavioral task were exposed to FUS unilaterally, and their performance was tracked for at least 3 weeks after BBB opening. An increased microglia density around blood vessels was detected on day 2, but was resolved by day 18. We also detected signs of enhanced immature neuron presence within areas that underwent BBB opening, compared to regions with an intact BBB, confirming previous rodent studies. Logistic regression analysis showed that the NHP cognitive performance did not deteriorate following BBB opening. These preliminary results demonstrate that neuronavigation-guided FUS with a single-element transducer is a non-invasive method capable of reversibly opening the BBB, without substantial histological or behavioral impact in an animal model closely resembling humans. Future work should confirm the observations of this multiple-case-study work across animals, species and tasks.


Conflict of interest statement

E.E.K. is an inventor and owns intellectual property on some aspects of the technology presented here. All other authors declare that they have no competing interests.

Figures

Figure 1
Figure 1
Targeted blood–brain barrier opening in non-human primates using focused ultrasound and microbubbles. (a) Neuronavigation-guided FUS system. A 0.25-MHz transducer was attached to a robotic arm and positioned above the NHP head. The T1-weighted MRI acquired during treatment planning was loaded onto the Brainsight neuronavigation system and was used to guide the FUS treatment. An infrared position sensor located the subject and tool trackers in real-time, guiding the placement of the FUS focal volume within the pre-planned area. (b) Contrast-enhanced T1-weighted MRI showing areas with BBB opening (colored ROI) in the prefrontal cortex of NHP 3 (MI: 0.4), along the axial, coronal, and sagittal planes. Color bar: normalized contrast enhancement. (c) BBB opening volume for MI of 0.4 and 0.8 (n = 3 per condition). (d) T1-weighted MRI before FUS (top row), 1 h post-FUS (middle row), and day 1 or 3 (bottom row) for NHPs 1 and 2, respectively. Left (L) side was treated with MI of 0.4, while the right (R) side was treated with MI of 0.8. Color bar: normalized contrast enhancement. (e) T2-weighted MRI before FUS (top row), 1 h post-FUS (middle row), and day 1 or 3 (bottom row) for NHPs 1 and 2, respectively. (f) Susceptibility-weighted MRI before FUS (top row), 2 h post-FUS (middle row), and day 1 or 3 (bottom row) for NHPs 1 and 2, respectively. (g) BBB closing timeline expressed as the percentage of disrupted volume at day 0 remaining permeable at days 1 (NHP 1, empty symbols) and 3 (NHP 2, filled symbols). Gray area corresponds to the false detection rate (5%), indicating pixels whose value randomly fluctuates above the detection threshold. (h) Robotic arm accuracy. Euclidean (top panel) and angular (bottom panel) deviation between planned and achieved focal volume placement. The values were acquired from BrainSight software 2.4 (www.rogue-research.com). Scale bars indicate 1 cm. FUS, focused ultrasound; NHP, non-human primate; BBB, blood–brain barrier; PCD, passive cavitation detector; MI, mechanical index.
Figure 2
Figure 2
Real-time monitoring of blood–brain barrier opening through passive cavitation detection. (a) Microbubbles exposed to FUS re-radiate their own acoustic emissions which can be captured through a single-element PCD. Microbubbles can oscillate either in a “stable” and recurrent manner (low pressure or MI of 0.4), or in an “unstable” and violent manner (high pressure or MI of 0.8), which may lead to their fragmentation and jet formation. The latter oscillation mode radiates higher amount of acoustic energy. The time-domain signal had duration of 10 ms, recording the microbubble response throughout the therapeutic pulse. White inset corresponds to the purple area in the beginning of the pulse. Time domain signal was converted to the frequency domain by calculating the FFT. Spectral domains containing the harmonics (green areas), ultraharmonics (blue areas), and broadband (red areas) emissions were isolated to calculate the respective cavitation levels and doses. (b) Example spectra before (left) and after (right) the intravenous injection of microbubbles, during FUS treatment at MI of 0.4. (c) Spectrogram including the frequency response throughout the 2-min treatment duration at MI of 0.4. (d) Example spectra before (left) and after (right) the intravenous injection of microbubbles, during FUS treatment at MI of 0.8. (e) Spectrogram including the frequency response throughout the 2-min treatment duration at MI of 0.8. (f) Cavitation levels throughout the FUS treatment at MI of 0.4 (top panel) and 0.8 (bottom panel). Harmonic stable cavitation levels (green line) dominated during treatment at MI of 0.4. Ultraharmonic stable (blue line) and inertial (red line) cavitation levels rose only during treatment at MI of 0.8. (g) Top: average cavitation levels for FUS treatment at MI of 0.4 (filled bars) and 0.8 (patterned bars). Bottom: Harmonic stable, ultraharmonic stable, inertial, and total cavitation dose for FUS treatment at MI of 0.4 and 0.8. (h) Correlation between BBB opening volume and harmonic stable (squares), ultraharmonic stable (diamonds), inertial (crosses), and total (circles) cavitation dose. Light blue and orange symbols denote treatment and MI of 0.4 and 0.8, respectively. Harmonic stable cavitation dose had the highest correlation with the resulting BBB opening volume (r2 = 0.85). Cavitation levels were calculated for each individual therapeutic pulse, while cavitation dose was the sum of all cavitation levels throughout the 2-min FUS treatment. Empty symbols in (g) and (h) correspond to an outlier with low signal-to-noise ratio (SNR ~ 1; NHP 3). Dotted lines in (c), (e) and (f) denote the time point in which microbubbles enter the focal volume, following their intravenous administration at t = 0 s. Data in (g) are presented as mean ± standard deviation (n = 210 pulses after microbubble signal detection). PCD, passive cavitation detector; MI, mechanical index; FFT, fast Fourier transform; dB, decibel; dSCDh, stable cavitation level based on harmonic emissions; dSCDu, stable cavitation level based on ultraharmonic emissions; dICD, inertial cavitation level; SCDh, stable cavitation dose based on harmonic emissions; SCDu, stable cavitation dose based on ultraharmonic emissions; ICD, inertial cavitation dose; CD, total cavitation dose.
Figure 3
Figure 3
Histopathological analysis of the non-human primate brain tissue following focused ultrasound treatment. (a) Gross pathology and corresponding BBB opening area at the 2-day (left) and 18-day (right) time point. (b) H&E staining and corresponding BBB opening area at the 2-day (left) and 18-day (right) time point. (c) Luxol fast blue H&E staining for myelin delineation at the 2-day (i–iv) and 18-day (v–viii) time point. (d) GFAP staining for astrocyte presence at the 2-day (i–iv) and 18-day (v–viii) time point. (e) Iba1/CD68 staining for microglia presence and migration at the 2-day (i–iv) and 18-day (v–viii) time point. (f) DCX staining for immature neurons at the 2-day (i–iv) and 18-day (v–viii) time point. GFAP and DAPI were used to stain astrocytes and cell nuclei, respectively. (g) Iba1+ and CD68+ cell density within perivascular areas treated at MI of 0.4 and 0.8, examined at the 2-day (deep blue bars) and 18-day (purple bars) time points. (h) DCX+ cell density with brain regions treated at MI of 0.4 and 0.8, examined at the 2-day (light blue bars) and 18-day (pink bars) time points. Regions of interest at (c), (d), (e), and (f) were within the left hemisphere treated at MI of 0.4 (i, ii, v, vi) or within the right hemisphere treated at MI of 0.8 (iii, iv, vii, viii). Color bars: normalized contrast enhancement. Scale bars: 1 cm (a, b); 1 mm (c); 200 μm (d, e); 100 μm (d-iv, e-iii, f). All images shown here correspond to regions of interest within areas with BBB opening as confirmed by MRI. Green shaded areas in (g) and (f) correspond to baseline Iba1+-CD68+ and DCX+ cell density, in brain areas outside the treated volume. Data in (g) and (h) are presented as mean ± standard deviation (n = 5 regions of interest per section and per hemisphere, n = 2 sections). GP, gross pathology; H&E, hematoxylin and eosin; CE-T1, contrast-enhanced T1 MRI scan; LFB, luxol fast blue for myelin delineation; GFAP, glial fibrillary acidic protein; Iba1, ionized calcium binding adaptor molecule 1; CD68, cluster of differentiation 68; DCX, doublecortin; DAPI, 4′,6-diamidino-2-phenylindole.
Figure 4
Figure 4
Cognitive function in non-human primates following focused ultrasound treatment. (a) Inference test setup for the assessment of accuracy and reaction time in a complex visual task. A tablet fixed within a detachable frame was positioned at the home cage of NHPs 3 and 4 on a daily basis. A set of two images was presented in each trial, one at the left (i.e., ipsilateral to the FUS treatment) side and one at the right (i.e., contralateral to the FUS treatment) side. A fluid dispenser provided water as a reward for each correct answer. (b) Inference test design. Two images were randomly selected from a list of 7 images, each carrying a different inference value (AG had decreasing implicit value; e.g., picture B had a higher implicit value than picture E etc.), and presented on the screen. The set of images was different for each day. Initial fixation was achieved with a point presented at the monitor for 933 ms. The two images were then presented for 1 s. When NHPs selected the correct answer on time, they were rewarded. In contrast, there was no reward for erroneous responses. The first 120 trials constituted the training phase, while the following 420 trials constituted the testing phase. (c) Daily accuracy, for MI of 0.4 (top, NHP 3) and MI of 0.8 (bottom, NHP 4). The mean estimate of the logistic regression for accuracy is plotted with a solid line (black line: pre-FUS; orange line: post-FUS), with shading indicating the 95% confidence interval for the mean. Each data point represents the average accuracy on a given day (n = 540 trials). (d) Daily reaction time, for MI of 0.4 (top, NHP 3) and MI of 0.8 (bottom, NHP 4). The mean estimate of the logistic regression for reaction time is plotted with a solid line (black line: pre-FUS; orange line: post-FUS), with shading indicating the 95% confidence interval for the mean. Each data point represents the average reaction time on a given day (n = 540 trials). (e) Accuracy intercept on day 0 before (gray boxes) and after (orange boxes) FUS treatment at MI of 0.4 and 0.8. (f) Reaction time intercept before (gray boxes) and after (orange boxes) FUS treatment at MI of 0.4 and 0.8. (g) Accuracy intercept on day 0 with ipsilateral (crosses) and contralateral (diamonds) targets, before (gray boxes) and after (orange boxes) FUS treatment at MI of 0.4 and 0.8. (h) Reaction time intercept on day 0 with ipsilateral (crosses) and contralateral (diamonds) targets, before (gray boxes) and after (orange boxes) FUS treatment at MI of 0.4 and 0.8. Gray and orange areas in (c) and (d) represent the period before and after FUS application, respectively. Data in (e), (f), (g), and (h) are presented as boxplots which correspond to estimated performance on day 0. Whiskers represent the 95% confidence interval, whereas boxes represent the 80% confidence interval. Accuracy and reaction rate for each day were the averages of all completed trials. The vertical line in (c) and (d) denotes the day of the pre-FUS MRI. Sample images in (b) were taken from a “free-to-use” collection of stock photos from a CD-ROM acquired in the 90 s. NHP, non-human primate; FUS, focused ultrasound; Ipsi, ipsilateral (i.e., left) targets; Contra, contralateral (i.e., right) targets; logRT, natural logarithm of reaction time.

References

    1. Ittner LM, Götz J. Amyloid-β and tau—a toxic pas de deux in Alzheimer’s disease. Nat. Rev. Neurosci. 2011;12:67–72. doi: 10.1038/nrn2967. - DOI - PubMed
    1. Stefanis, L. α-Synuclein in Parkinson’s disease. Cold Spring Harb. Perspect. Med.2 (2012). - PMC - PubMed
    1. Mangialasche F, Solomon A, Winblad B, Mecocci P, Kivipelto M. Alzheimer’s disease: clinical trials and drug development. Lancet Neurol. 2010;9:702–716. doi: 10.1016/S1474-4422(10)70119-8. - DOI - PubMed
    1. Fu H, et al. Tau pathology induces excitatory neuron loss, grid cell dysfunction, and spatial memory deficits reminiscent of early Alzheimer’s disease. Neuron. 2017;93:533–541.e5. doi: 10.1016/j.neuron.2016.12.023. - DOI - PMC - PubMed
    1. Wang Y, Mandelkow E. Tau in physiology and pathology. Nat. Rev. Neurosci. 2016;17:5–21. doi: 10.1038/nrn.2015.1. - DOI - PubMed

Publication types