. 2021 Jul 22;11(1):15013.
doi: 10.1038/s41598-021-94487-9.

A data-driven performance dashboard for surgical dissection

Affiliations

A data-driven performance dashboard for surgical dissection

Amir Baghdadi et al. Sci Rep. .

Abstract

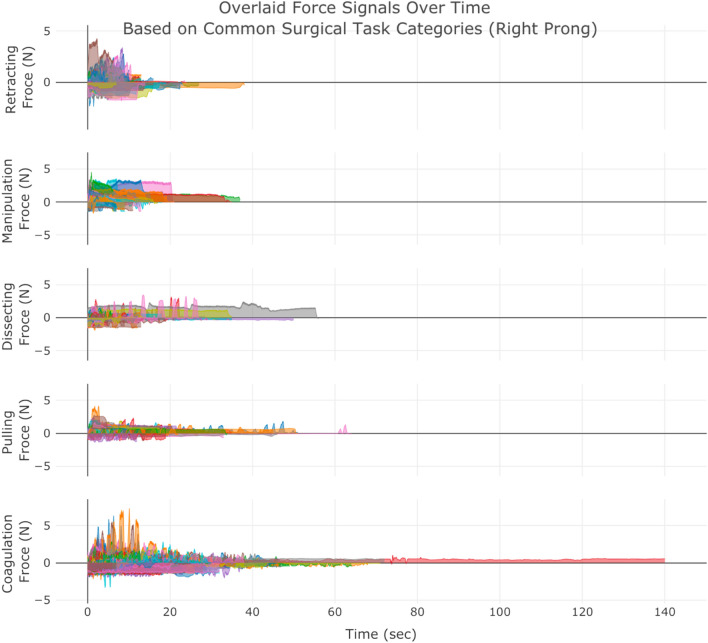
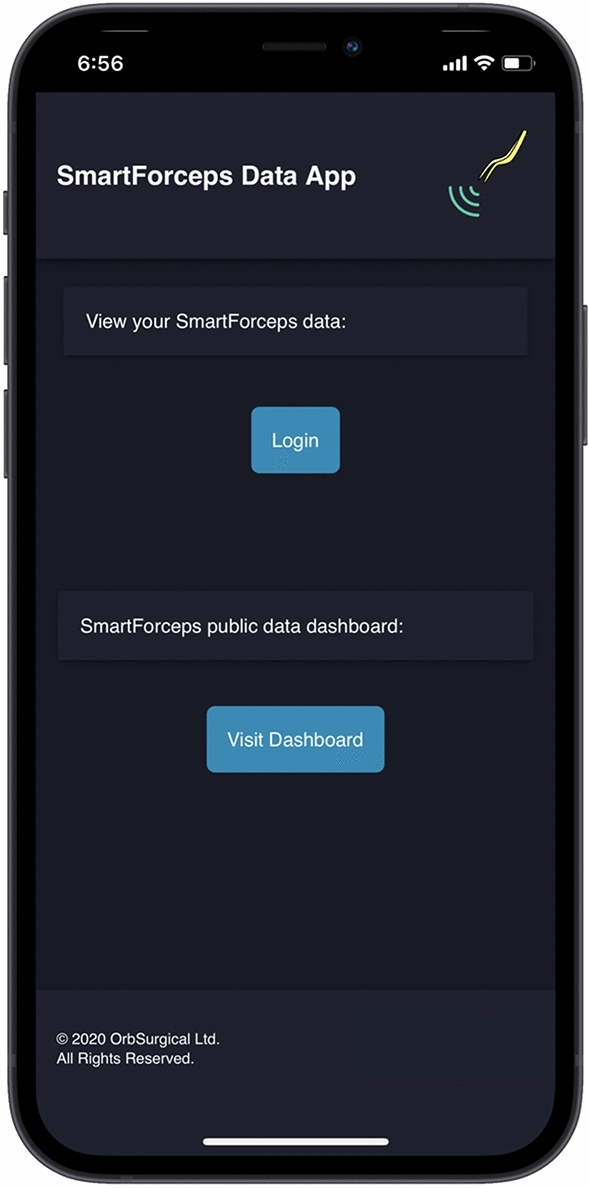
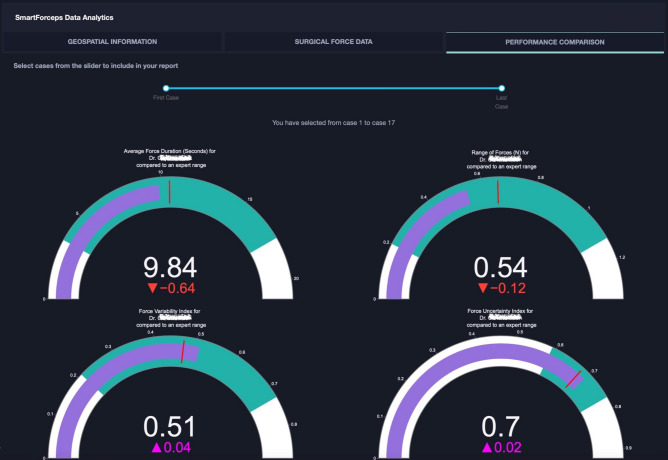
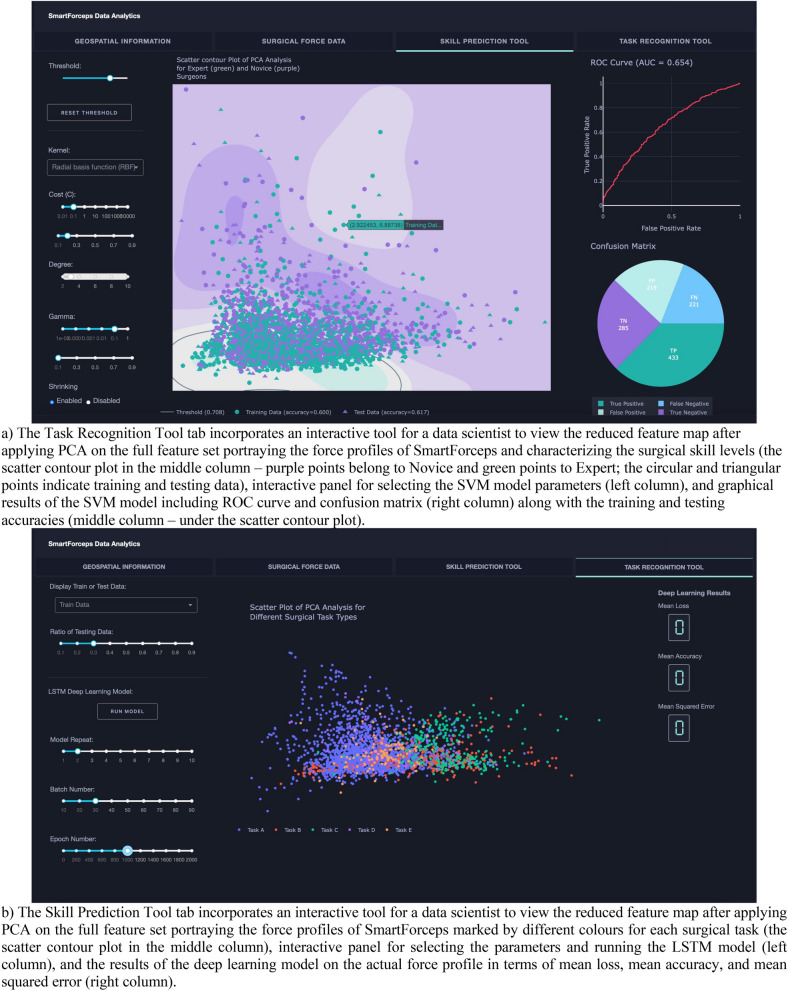
Surgical error and resulting complication have significant patient and economic consequences. Inappropriate exertion of tool-tissue force is a common variable for such error, that can be objectively monitored by sensorized tools. The rich digital output establishes a powerful skill assessment and sharing platform for surgical performance and training. Here we present SmartForceps data app incorporating an Expert Room environment for tracking and analysing the objective performance and surgical finesse through multiple interfaces specific for surgeons and data scientists. The app is enriched by incoming geospatial information, data distribution for engineered features, performance dashboard compared to expert surgeon, and interactive skill prediction and task recognition tools to develop artificial intelligence models. The study launches the concept of democratizing surgical data through a connectivity interface between surgeons with a broad and deep capability of geographic reach through mobile devices with highly interactive infographics and tools for performance monitoring, comparison, and improvement.


Conflict of interest statement

The authors declare no competing interests.

Figures

Figure 1
Figure 1
SmartForceps timeseries data of the Right prong across the 5 surgical tasks of Retracting, Manipulation, Dissecting, Pulling, and Coagulation overlaid for 50 cases. Differences in the range and duration of force are shown in the overlaid data profiles. Please refer to our Supplementary Materials for both left and right prong data. These charts have fully interactive capability including zoom, pan, download, etc. Figure created by R Plotly library version 2.0: https://plotly.com/r/.
Figure 2
Figure 2
Design interface of the SmartForceps surgical data monitoring application on a mobile device. The user can click to visit the general dashboard without login or login with exclusive credentials to visit their own reports in surgeon or data scientist views. Visualization created through framing the PWA created in JavaScript inside a phone view using MockuPhone mock-up generator: https://mockuphone.com.
Figure 3
Figure 3
SmartForceps Data Analytics Dashboard in "General" view shown in a desktop mode. The current view includes two tabs of "Geospatial Information" (a) and “Surgical Force Data” (b). These charts have fully interactive capability including zoom, pan, download, etc. The figure for dashboard was created by Python Dash library version 0.43.0: https://plotly.com/dash/.
Figure 4
Figure 4
SmartForceps Data Analytics Dashboard in "Surgeon" view. The current view includes three tabs of "Geospatial Information", “Surgical Force Data”, and “Performance Comparison Dashboard”. These charts have fully interactive capability including zoom, pan, download, etc. This figure shows the overtime performance report (with the slide bar at the top to select range of cases) for a Novice surgeon with PGY > 4. The name is deidentified for privacy reasons. The gauge charts show the performance (purple bar) compared to the Expert surgeon (mean and standard deviation indicated as red mark and green area, respectively). In this graph, the representative surgeon gauge starts from zero as the baseline with the goal of reaching to the expert level values denoted by a red bar and green area. The figure for dashboard was created by Python Dash library version 0.43.0: https://plotly.com/dash/.
Figure 5
Figure 5
SmartForceps Data Analytics Dashboard in "Data Scientist" view. The current view includes four tabs of "Geospatial Information", “Surgical Force Data”, “Skill Prediction Tool” (a), and “Task Recognition Tool” (b). The figure for dashboard was created by Python Dash library version 0.43.0: https://plotly.com/dash/.
Figure 6
Figure 6
Aggregative data distribution of both Expert (green violin plots) and Novice (purple violin plots) surgeons across the surgical tasks for each time-series extracted feature (Force Range in this sample graph). Detailed statistical information including min, max, median, mean, q1, and q3 are available to view on mouse hover in the original app and the Supplementary Material. Figure created by R Plotly library version 2.0: https://plotly.com/r/.
Figure 7
Figure 7
Workflow diagram of SmartForceps data management and analysis pipeline. Forces of tool-tissue interaction along with de-identified case information is uploaded to a HIPAA-compliant data storage and analytics architecture, i.e., Microsoft Azure. Force data were manually segmented and labelled by listening to the operating room voice recordings where each surgeon name, surgical tasks, and important incidents were properly narrated. Data Pre-processing was performed for noise filtering (Butterworth low-pass filter) and outlier removal (1st and 99th percentiles of either maximum force, minimum force, or task completion time). To generate a holistic information from tool-tissue interaction force profiles, 37 hand-crafted time-series features were extracted in Feature Engineering phase. In Data Analytics phase, two-way ANOVA tests were examined to monitor the representation power of each feature set for different surgeon skill and task categories and a subset of 25 features was selected. The force profiles and selected features were used in Data Analytics Dashboard for performance monitoring and machine learning modelling tools to perform skill prediction and task recognition. The visualization was created in Microsoft PowerPoint version 16.49 with the icons obtained from a Google search: e.g., https://www.iconfinder.com.

References

    1. WHO guidelines for safe surgery 2009: safe surgery saves lives (Organization, W.H., 2009). - PubMed
    1. Tang B, Hanna G, Cuschieri A. Analysis of errors enacted by surgical trainees during skills training courses. Surgery. 2005;138:14–20. doi: 10.1016/j.surg.2005.02.014. - DOI - PubMed
    1. Van Den Bos J, Rustagi K, Gray T, Halford M, Ziemkiewicz E, Shreve J. The $17.1 billion problem: The annual cost of measurable medical errors. Health Affairs Project Hope. 2011;30:596–603. doi: 10.1377/hlthaff.2011.0084. - DOI - PubMed
    1. Horeman T, et al. Visual force feedback improves knot-tying security. J. Surg. Educ. 2014;71:133–141. doi: 10.1016/j.jsurg.2013.06.021. - DOI - PubMed
    1. Sugiyama T, et al. Forces of tool-tissue interaction to assess surgical skill level. JAMA Surg. 2018;153:234–242. doi: 10.1001/jamasurg.2017.4516. - DOI - PMC - PubMed

Publication types