. 2021 Dec;39(12):1537-1547.
doi: 10.1038/s41587-021-00981-w. Epub 2021 Jul 22.

Enhanced detection of minimal residual disease by targeted sequencing of phased variants in circulating tumor DNA

Affiliations

Enhanced detection of minimal residual disease by targeted sequencing of phased variants in circulating tumor DNA

David M Kurtz et al. Nat Biotechnol. 2021 Dec.

Abstract

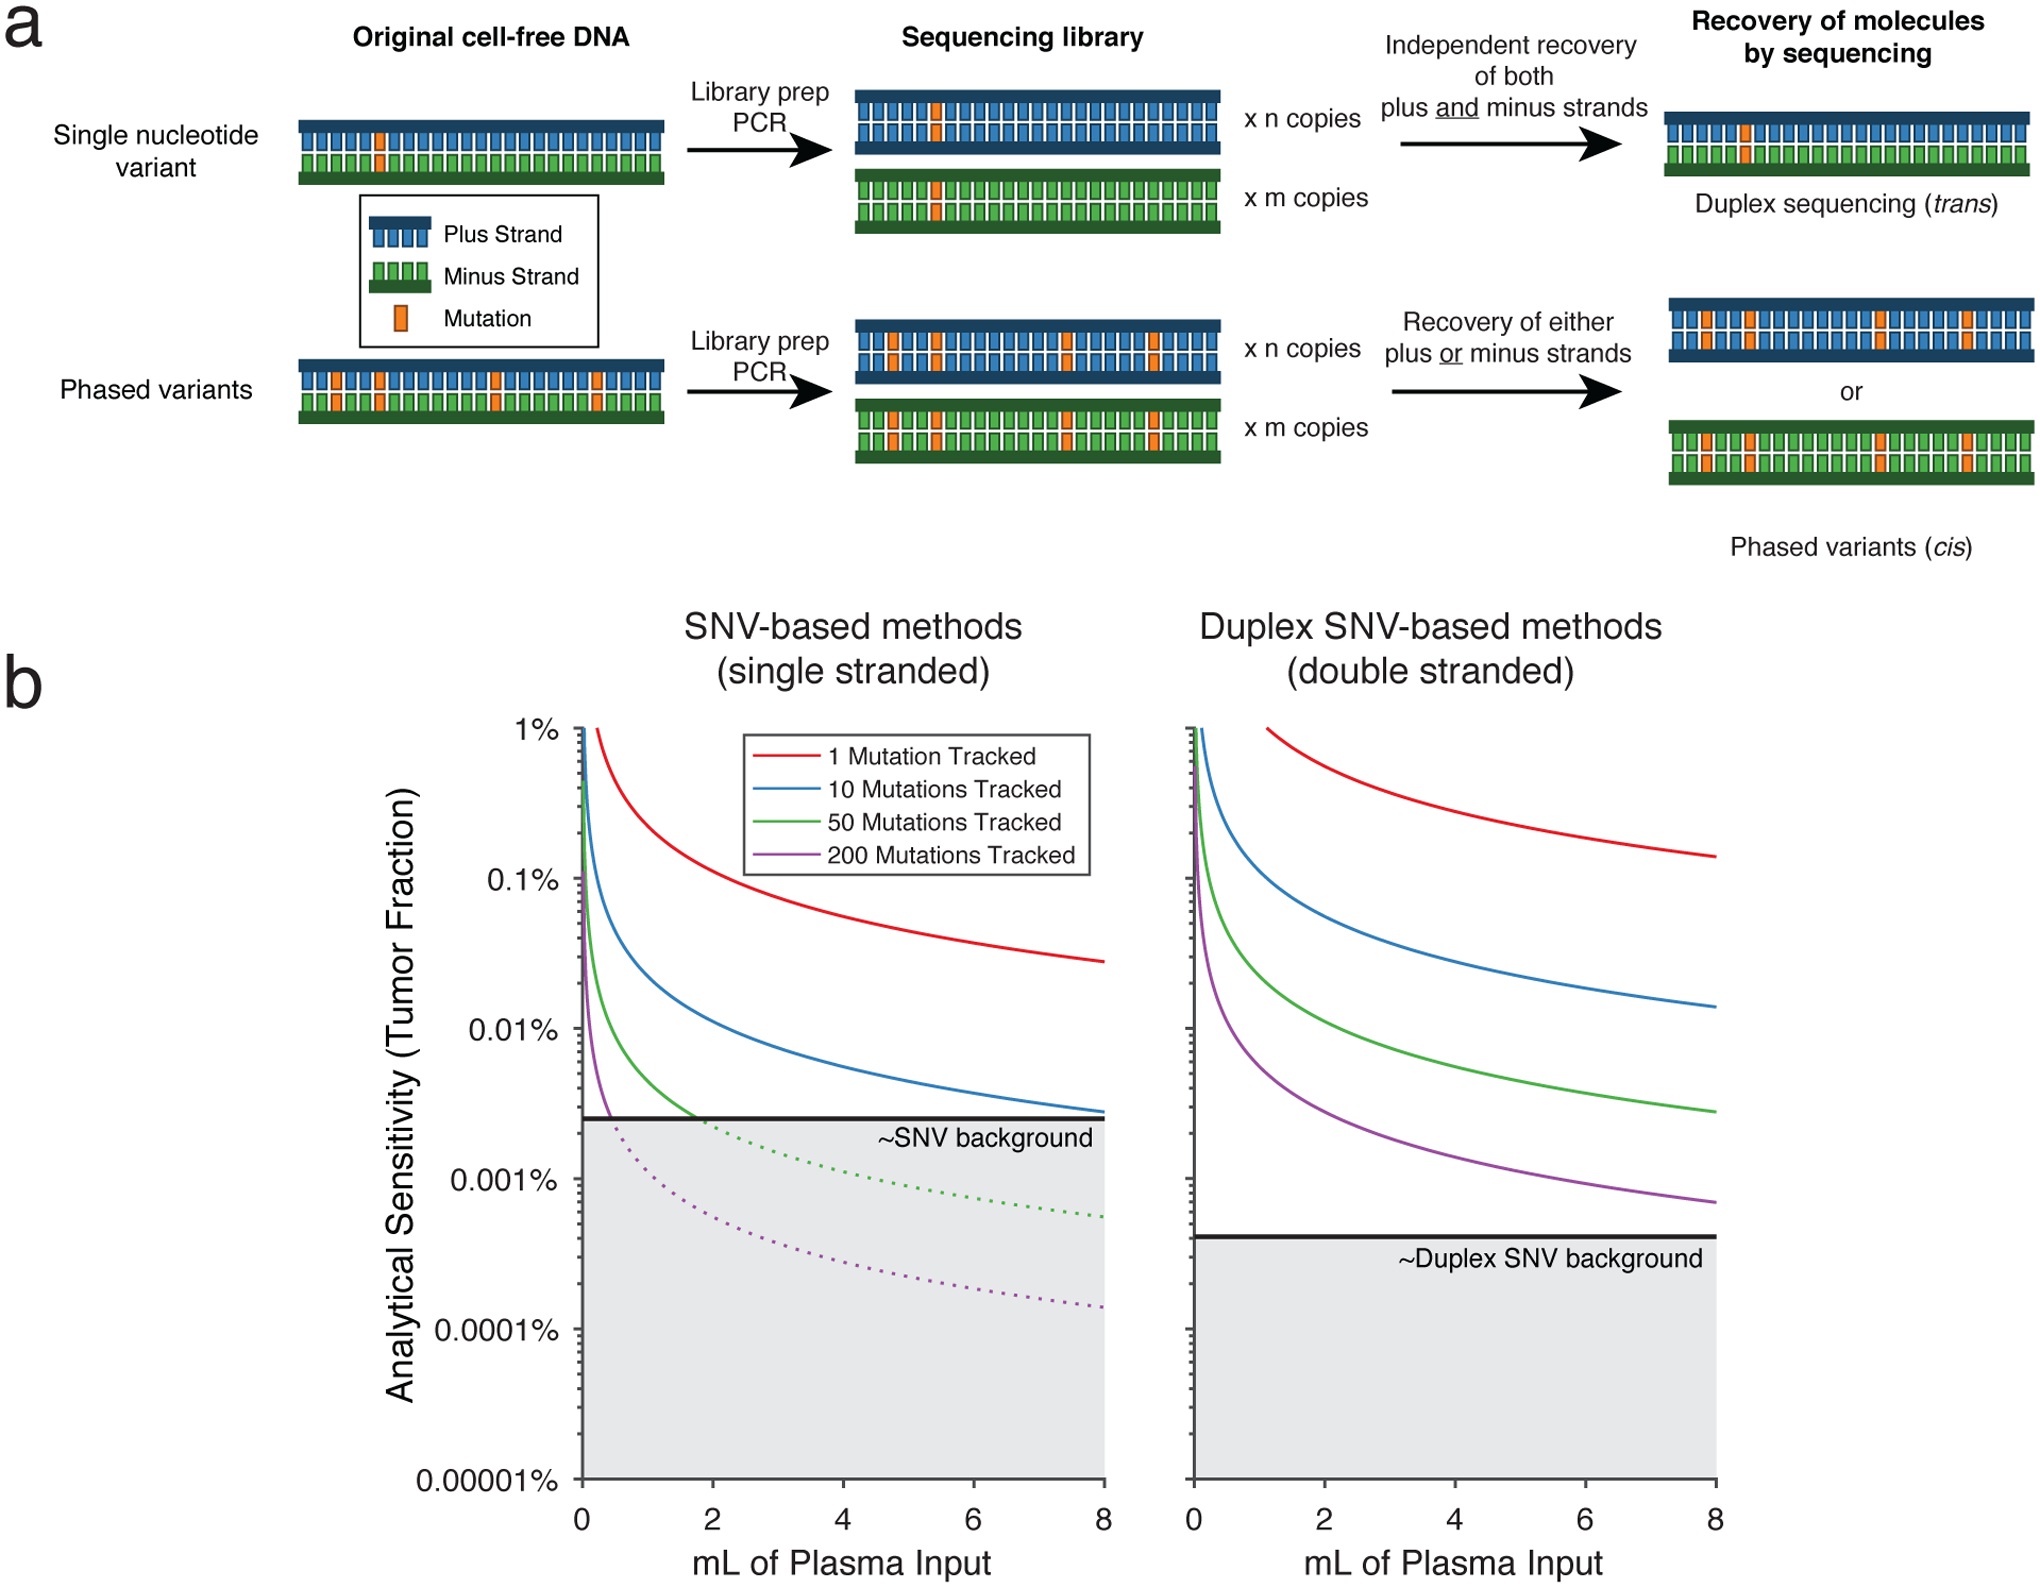
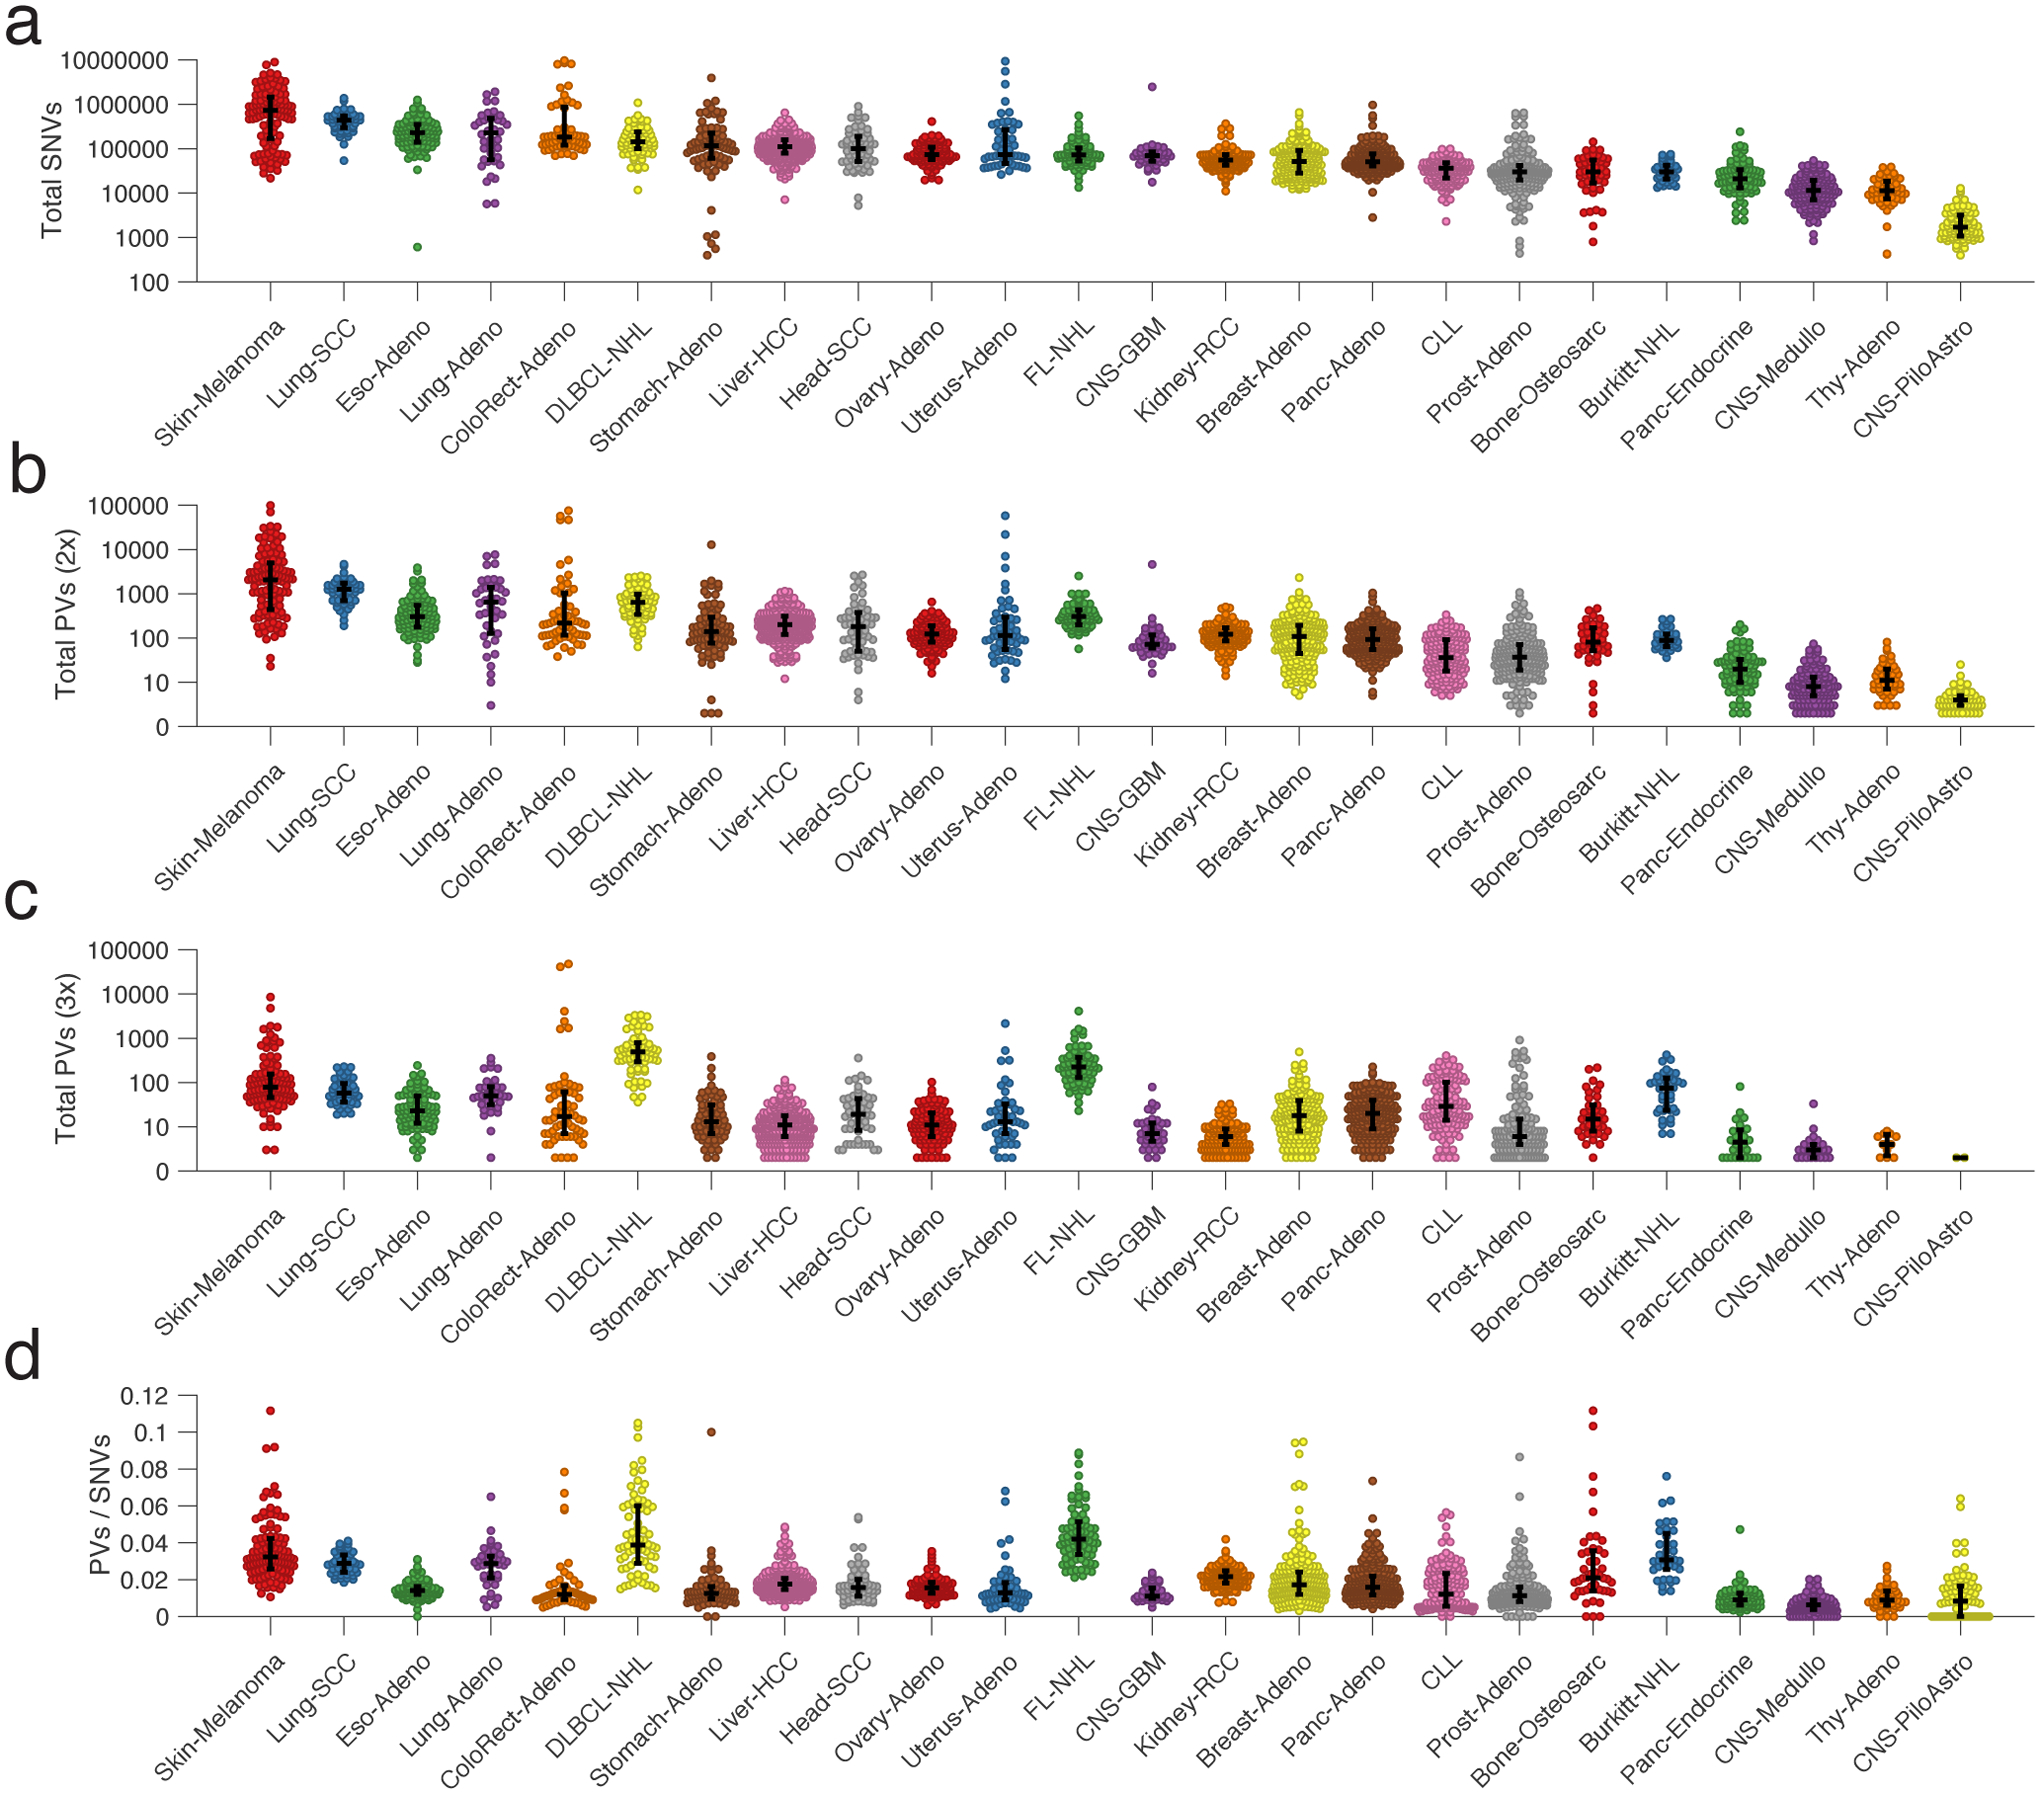
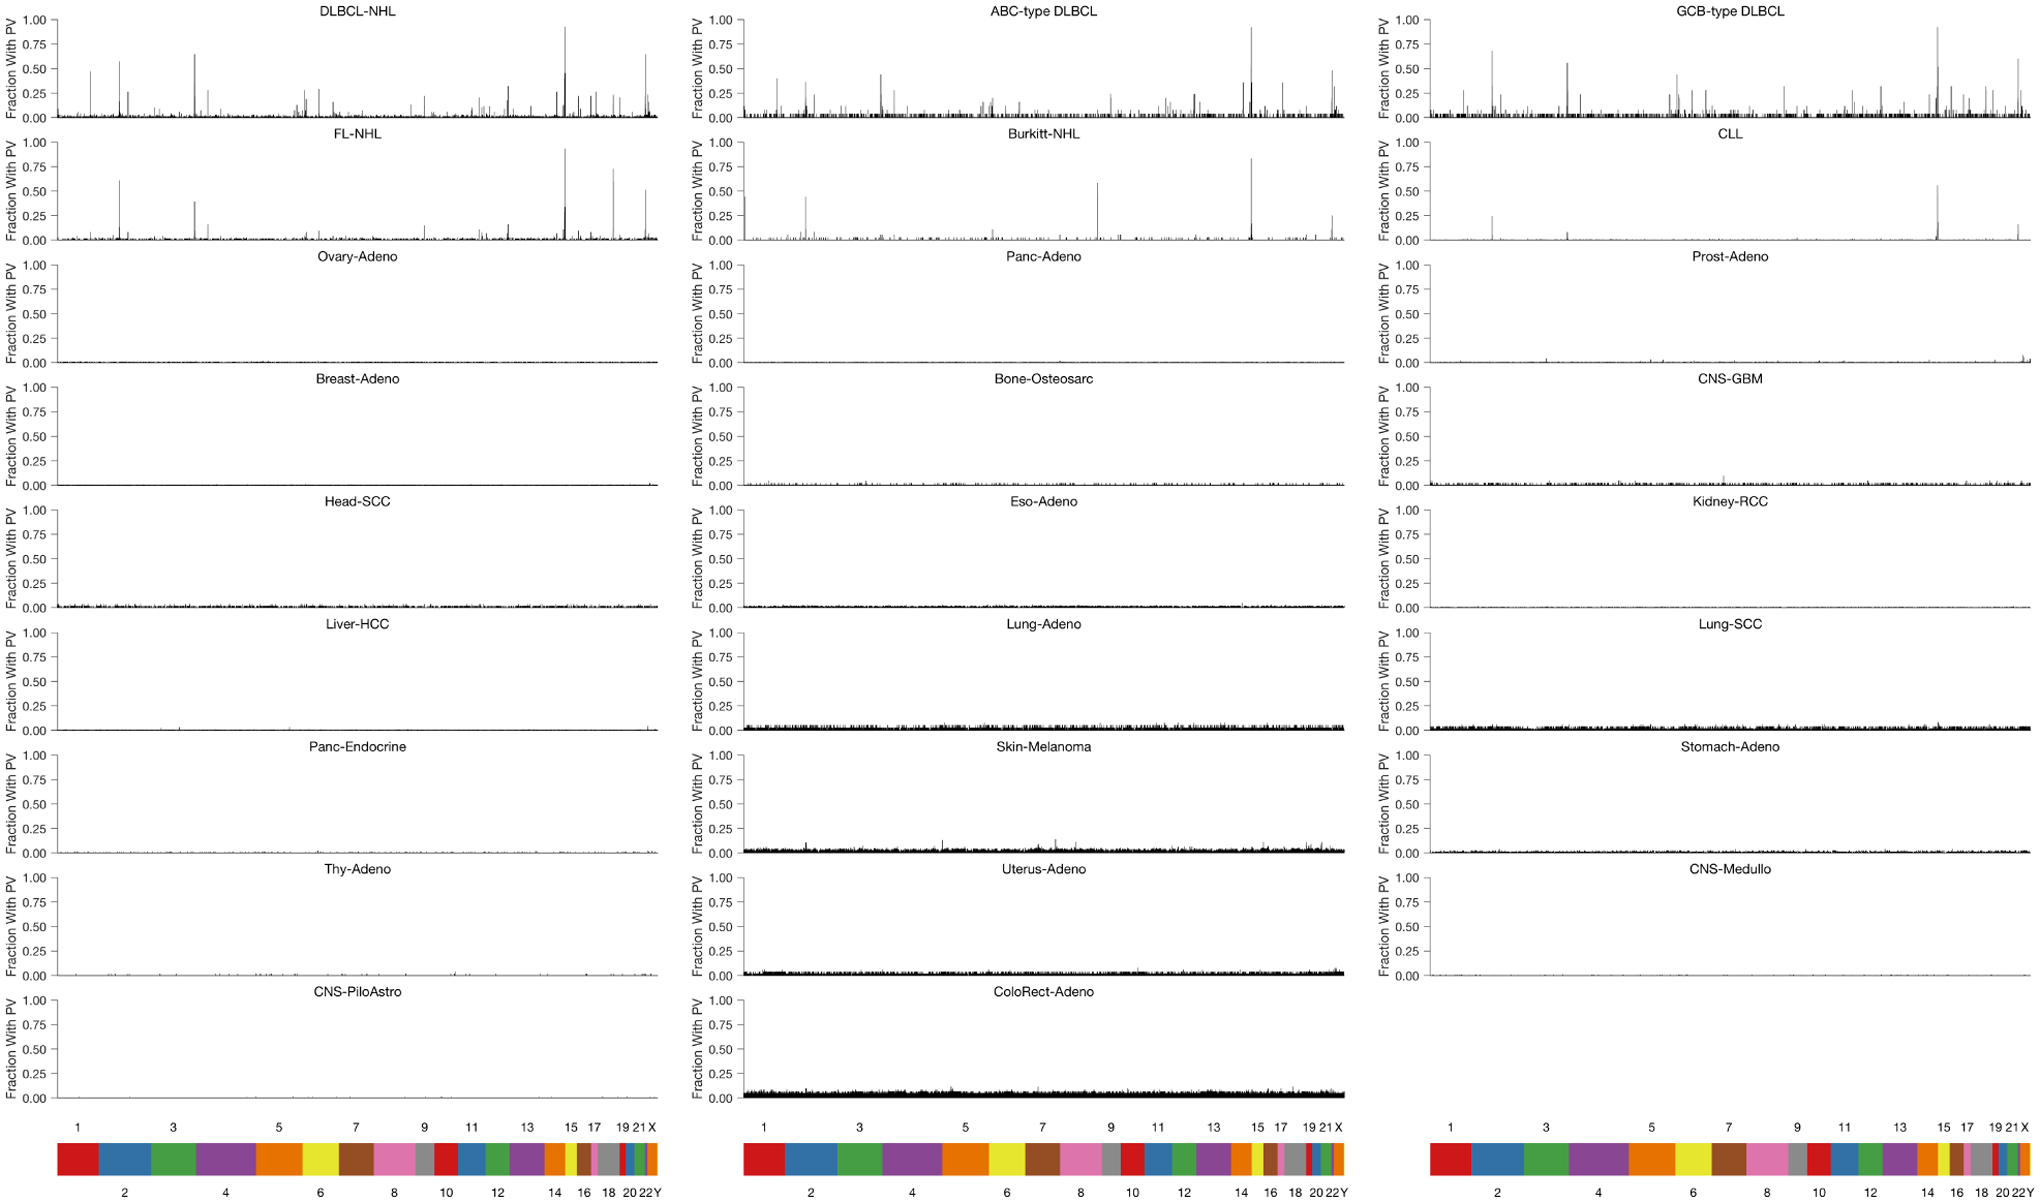
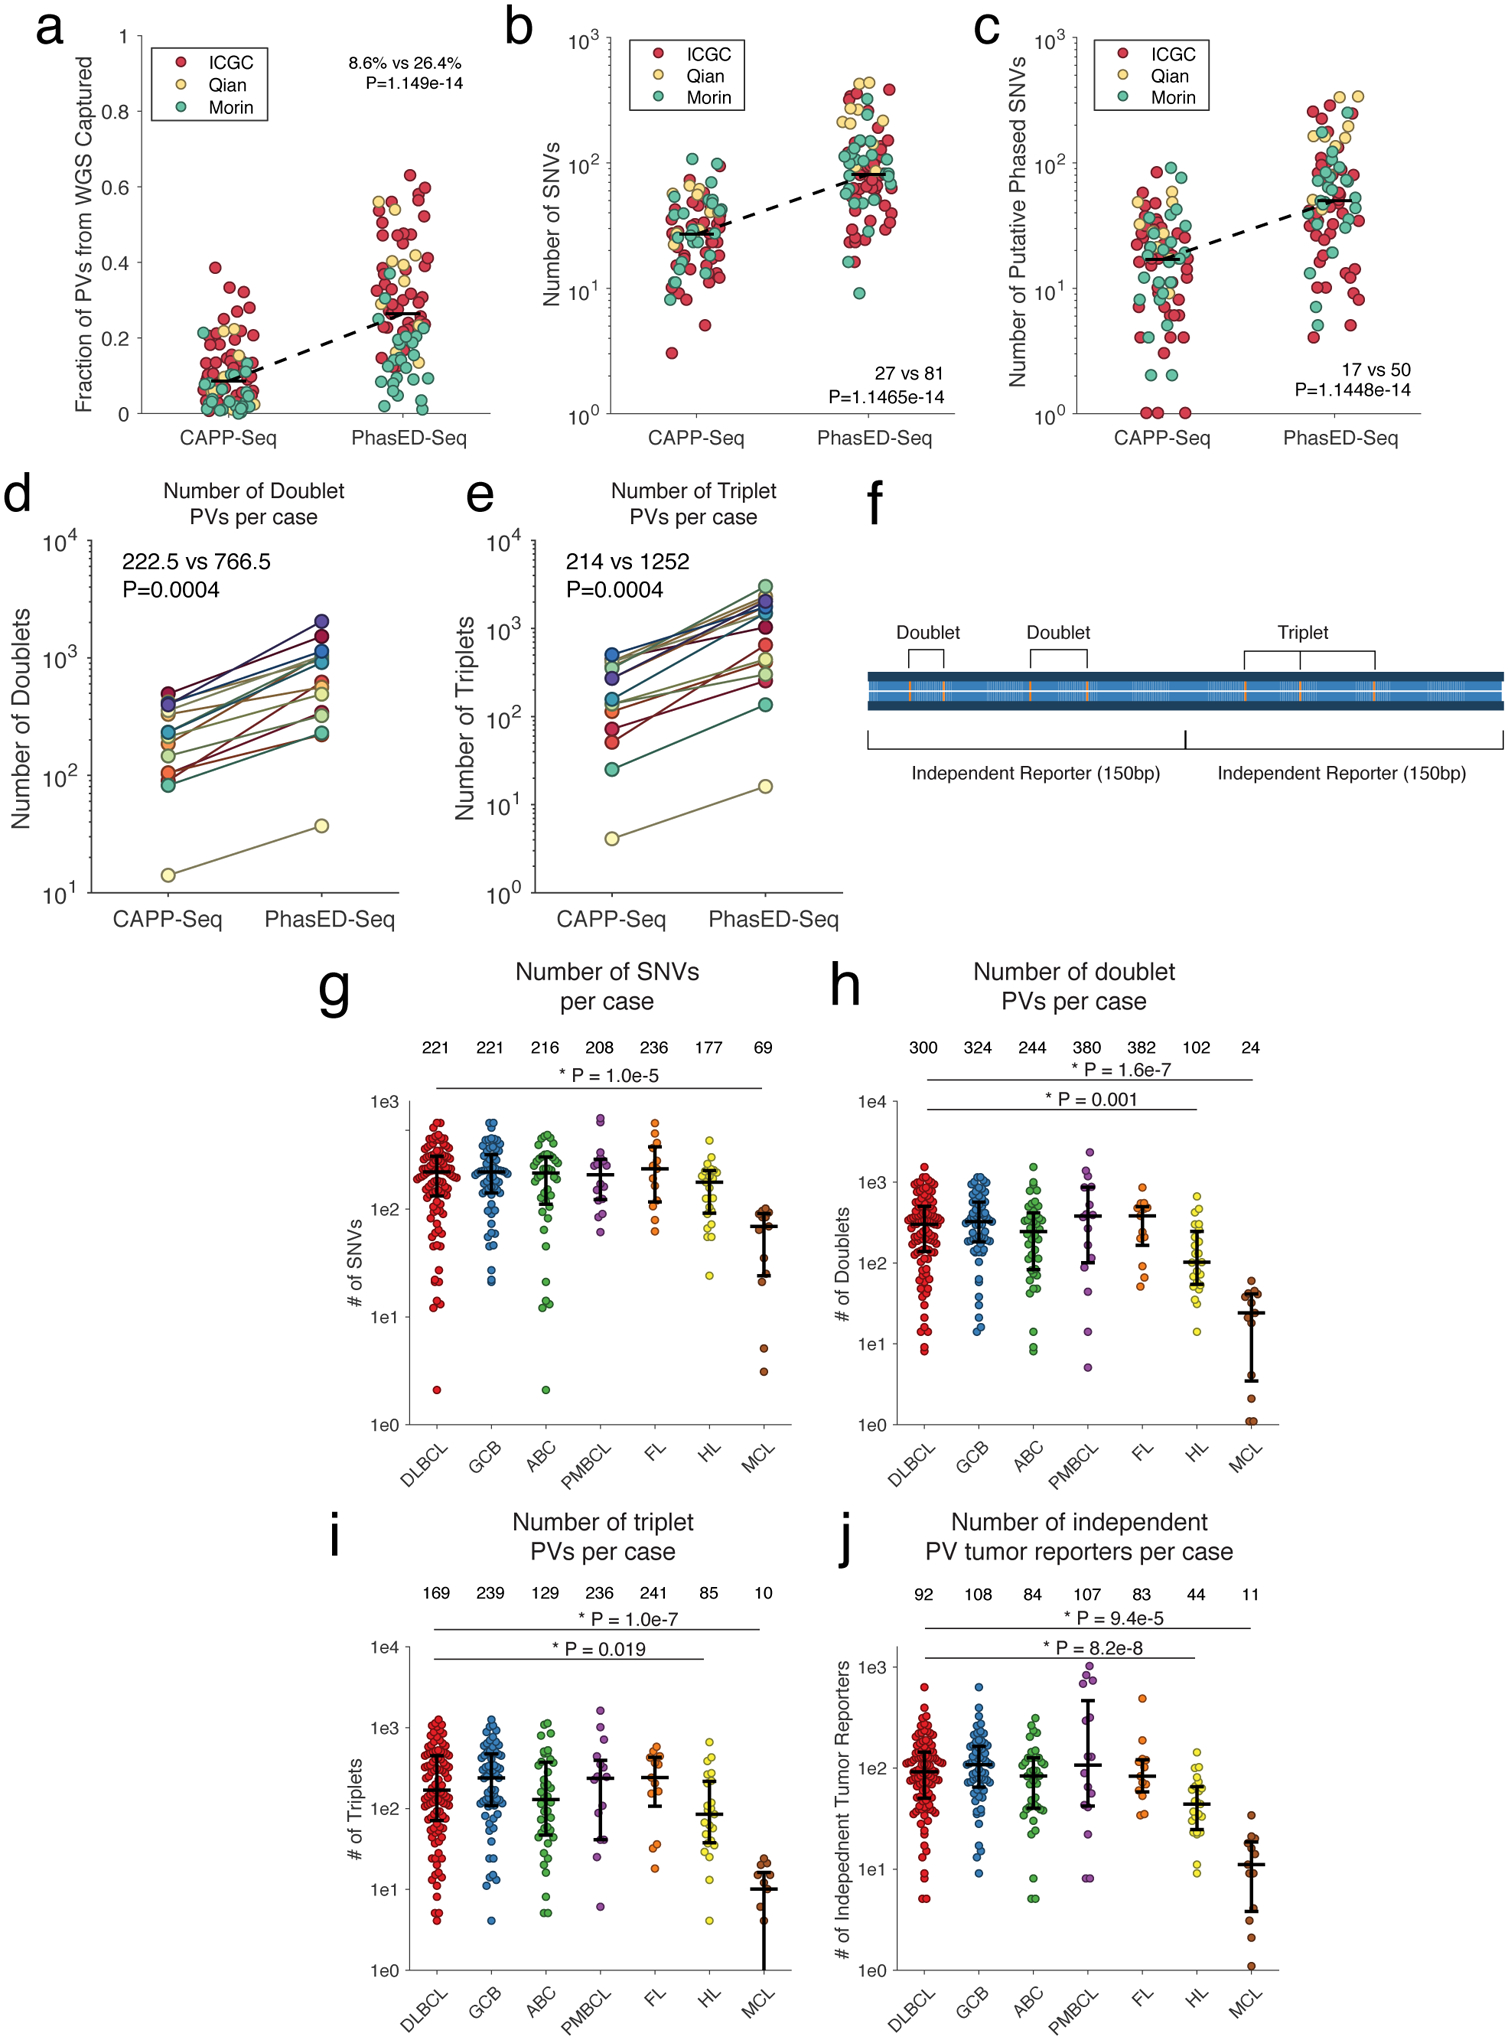
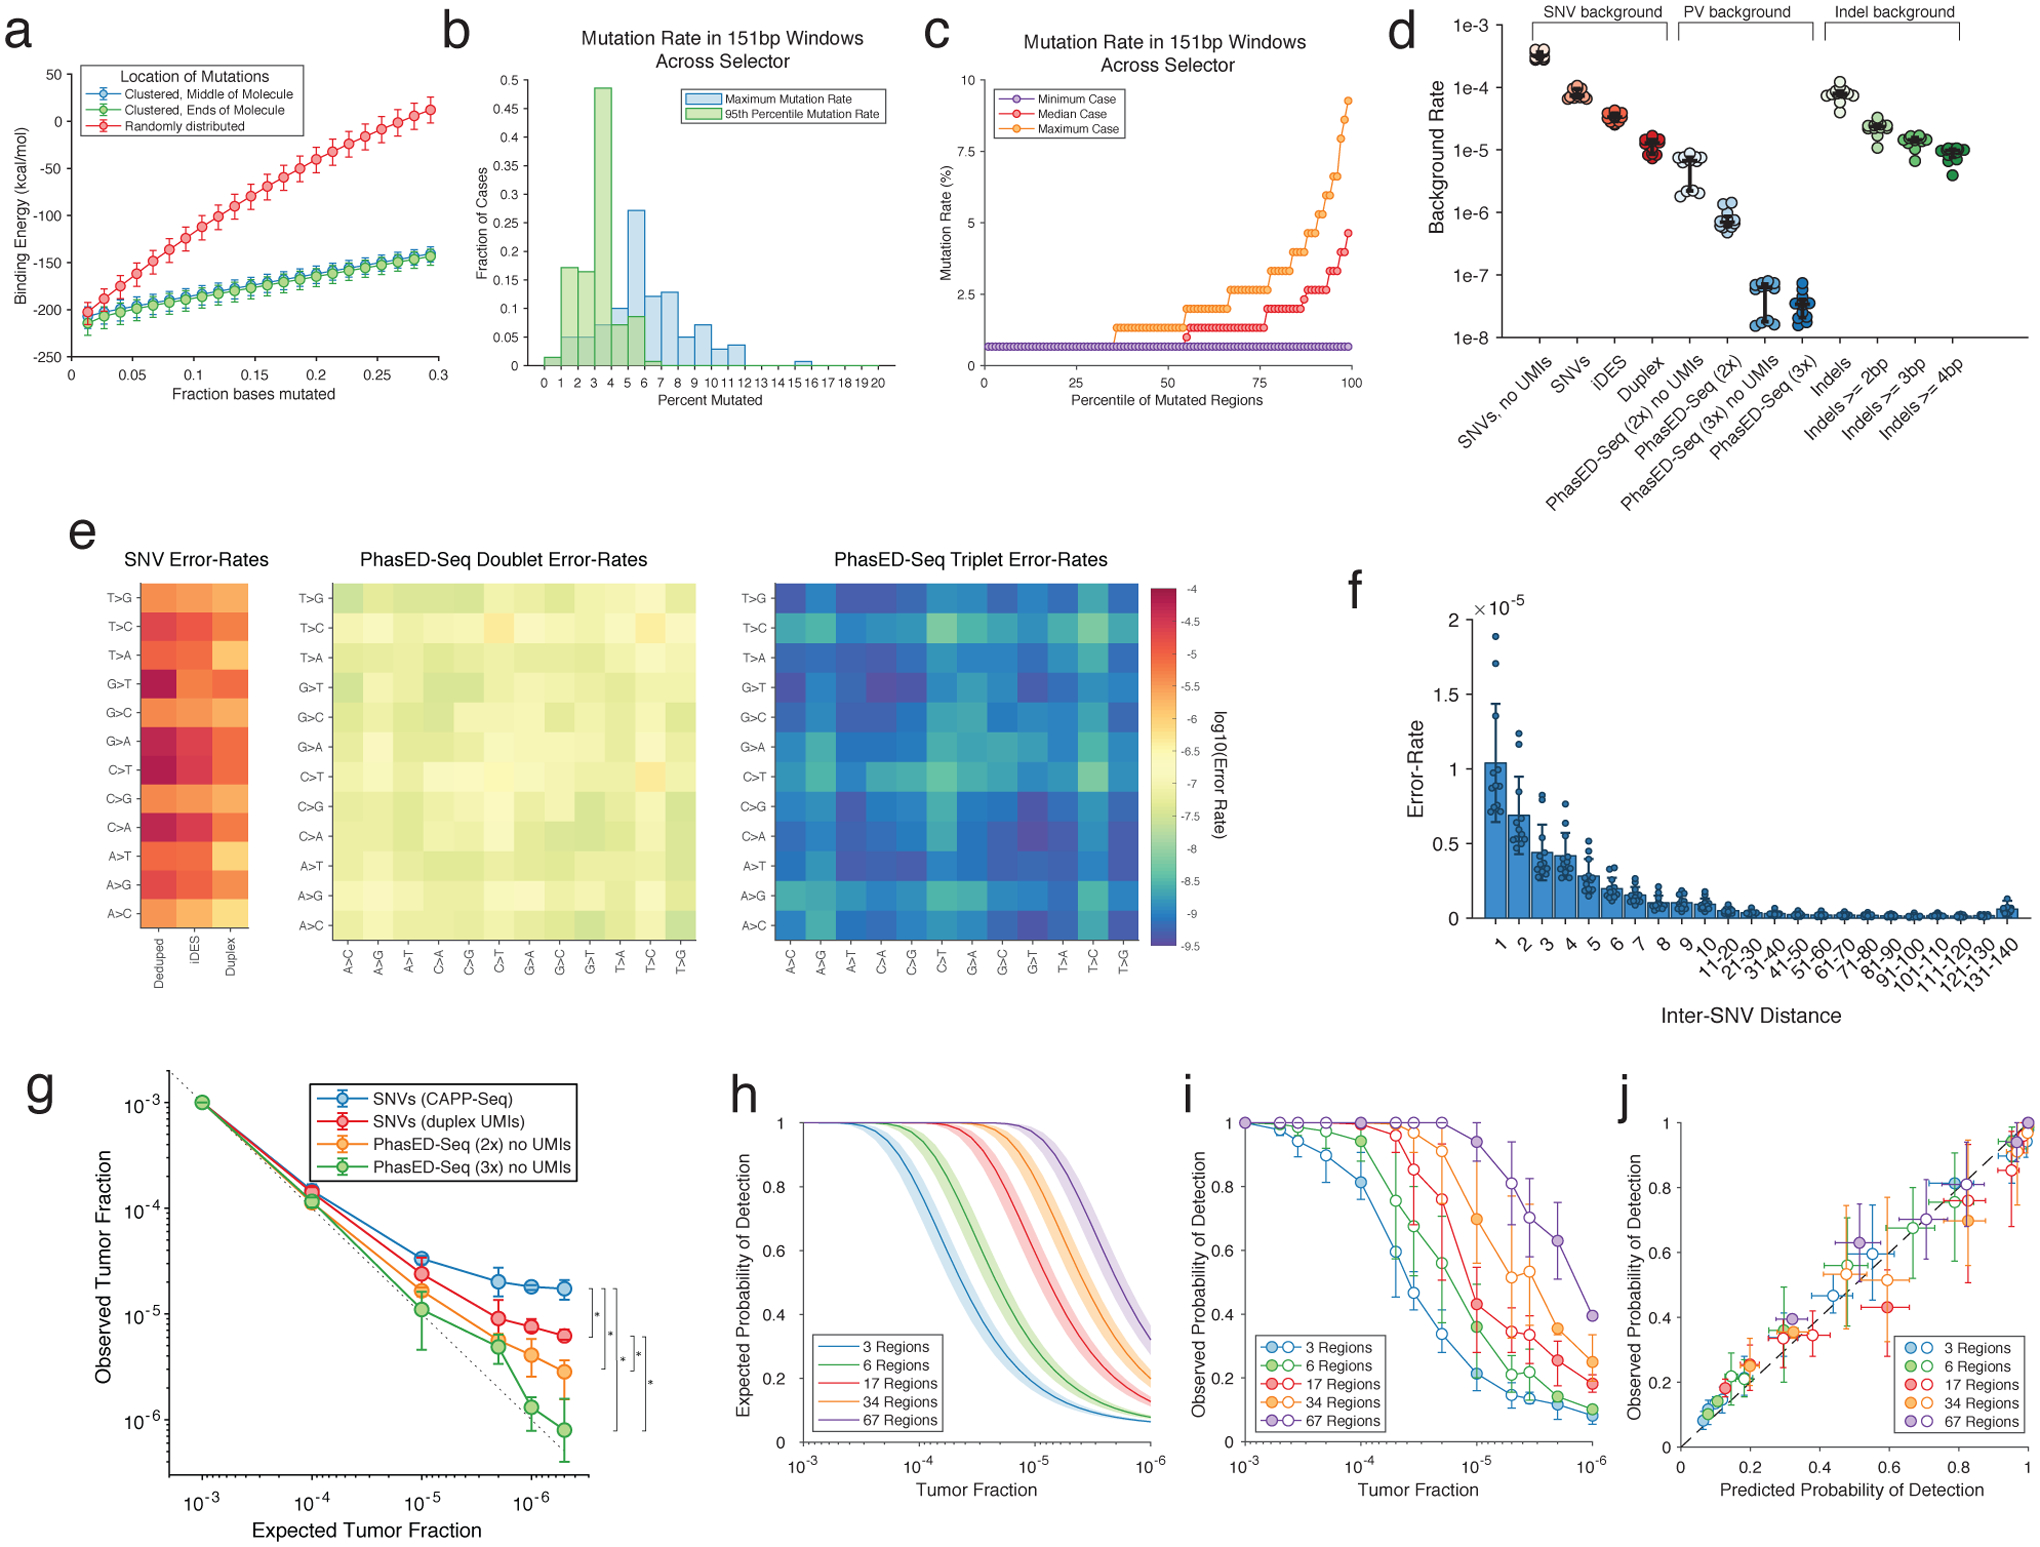
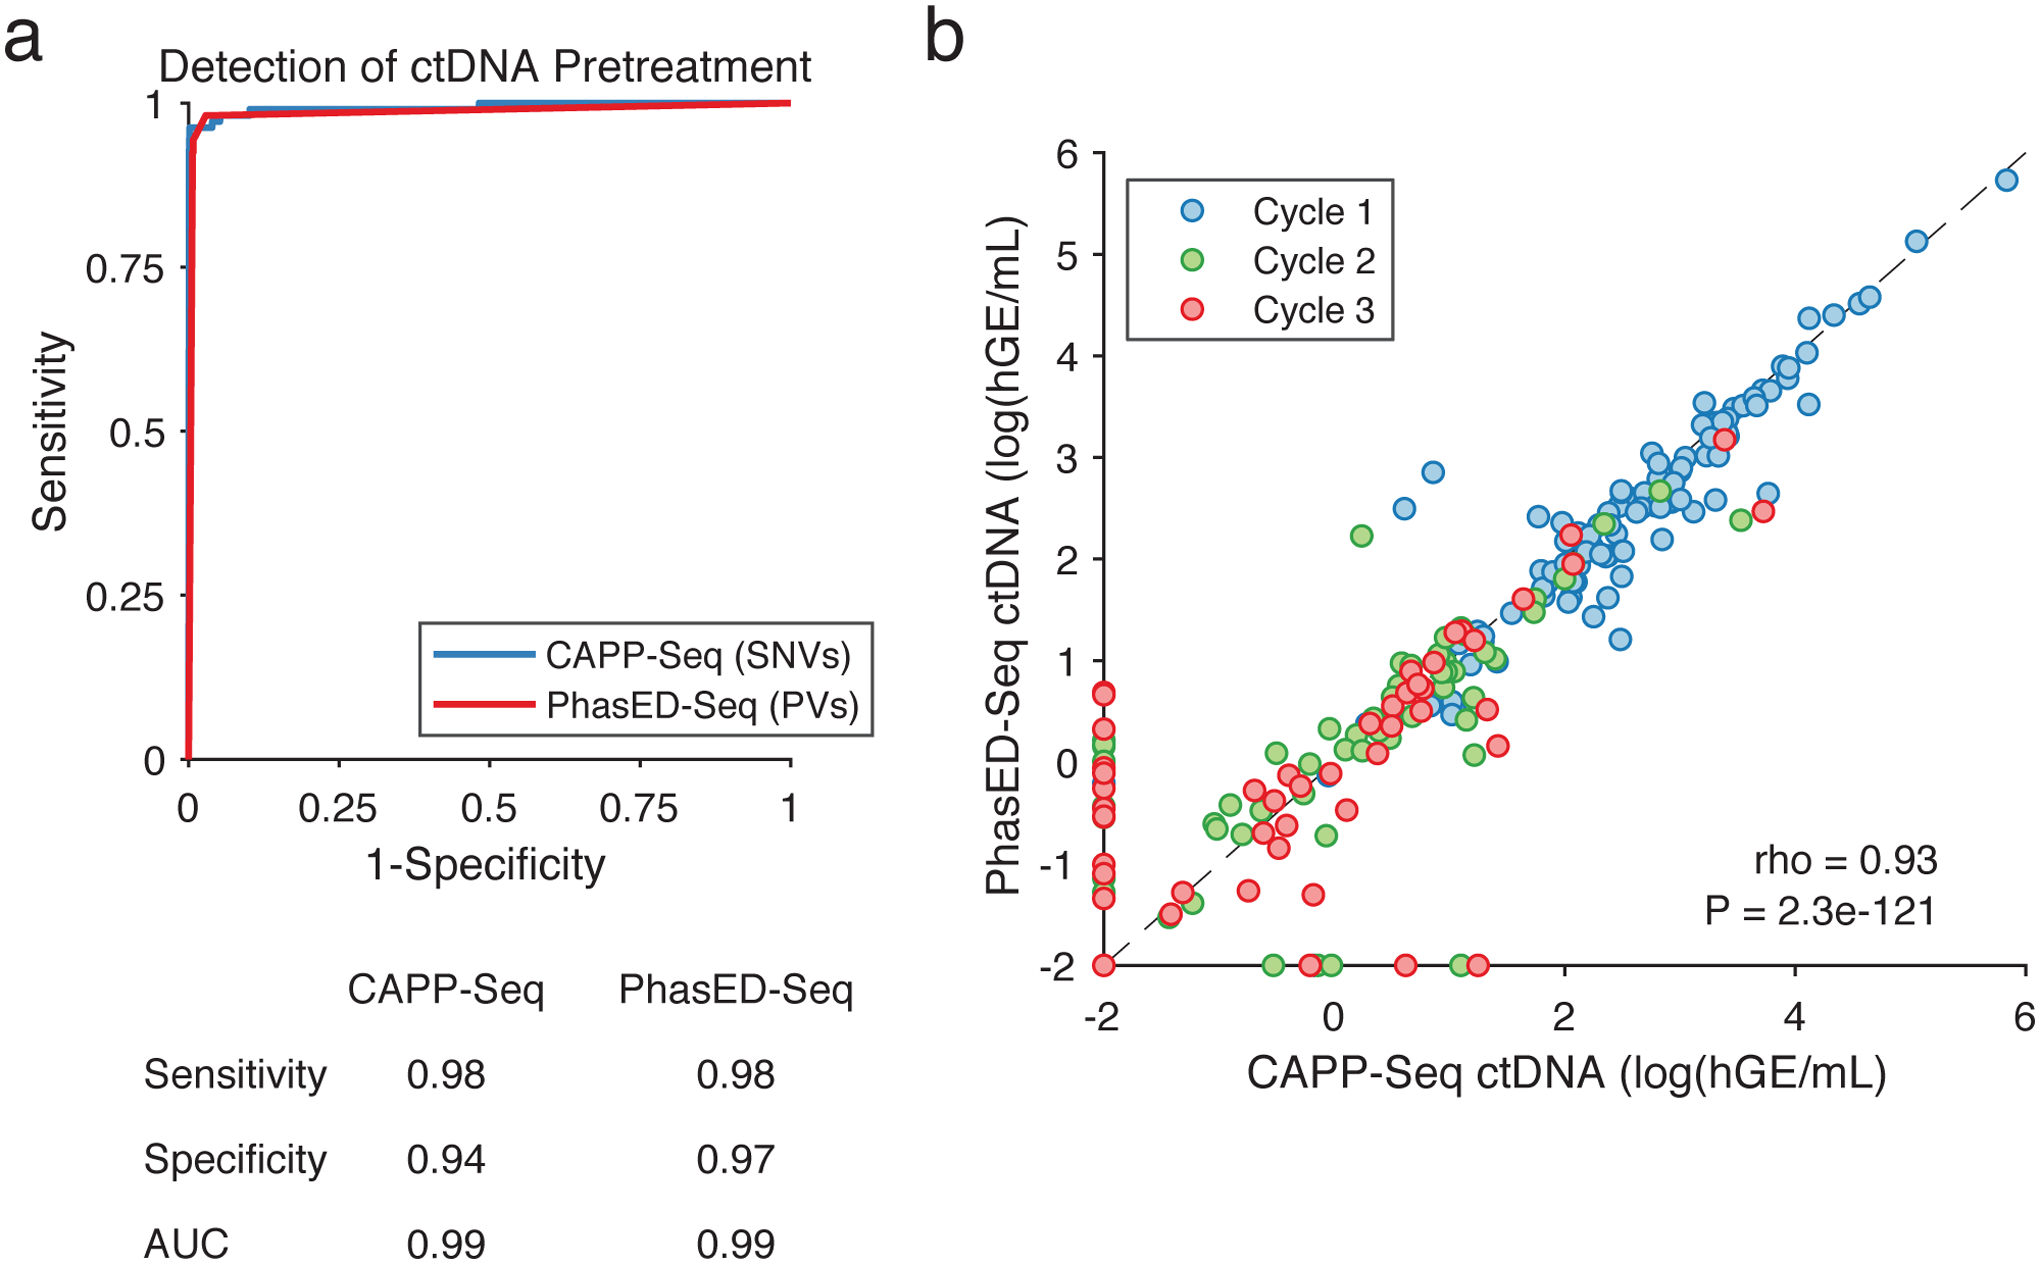
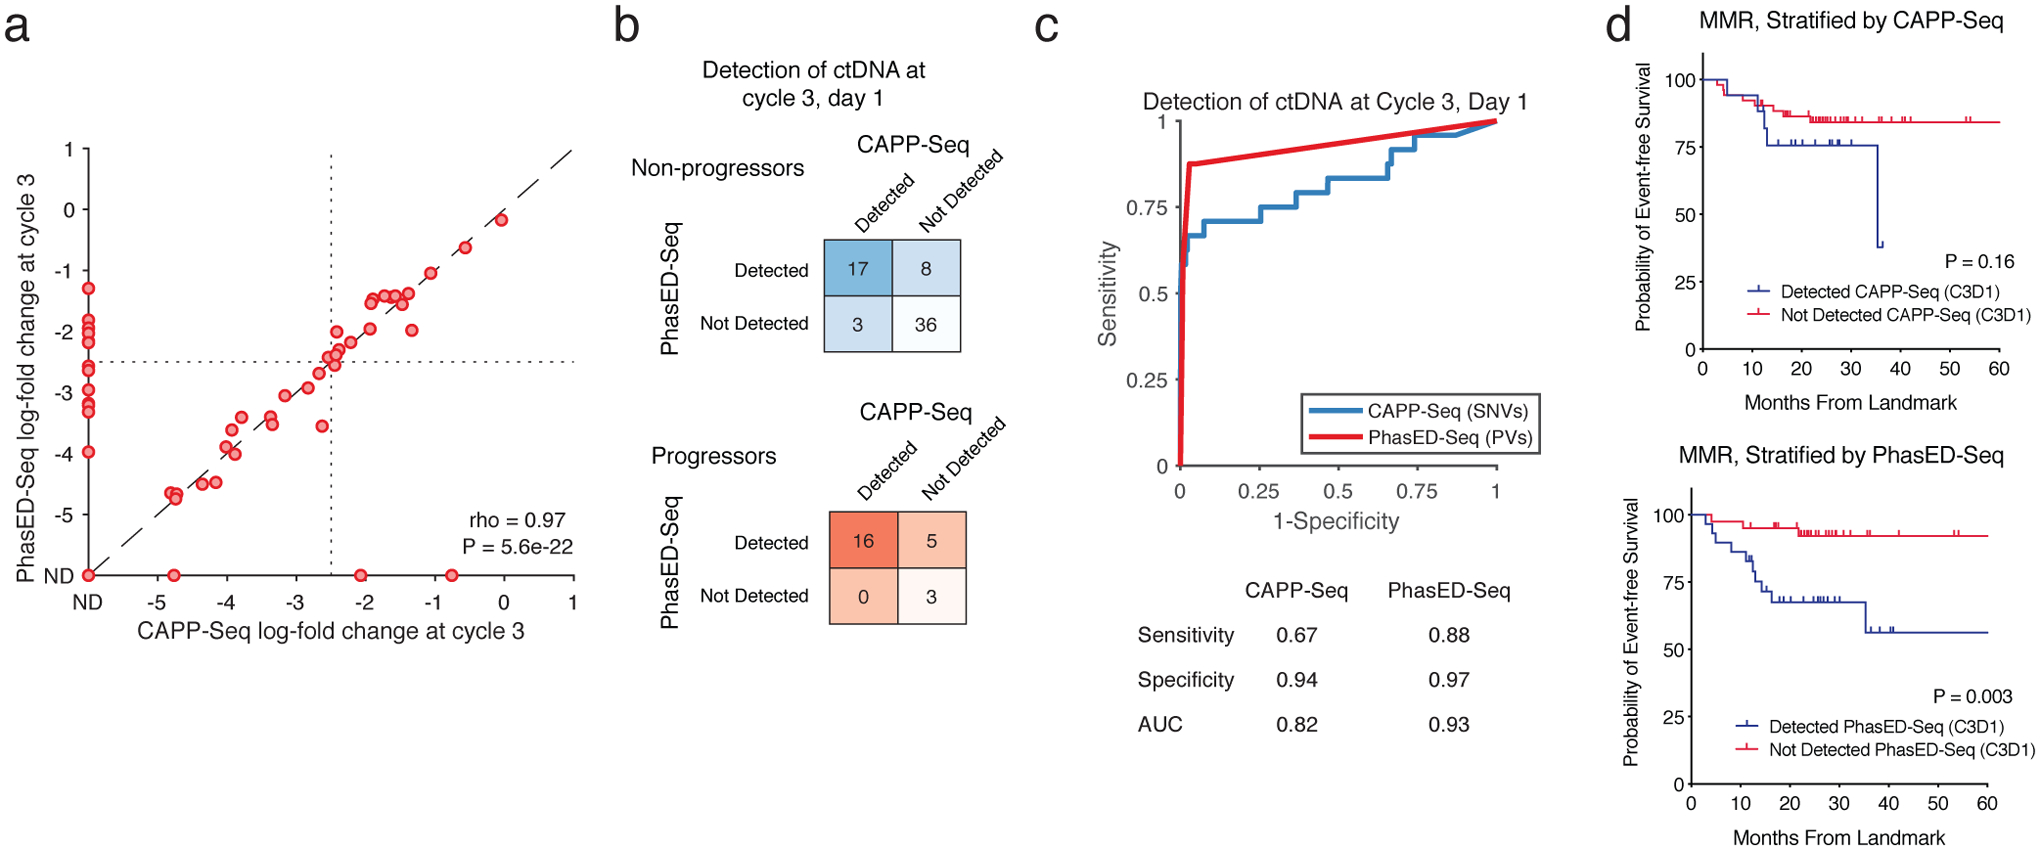
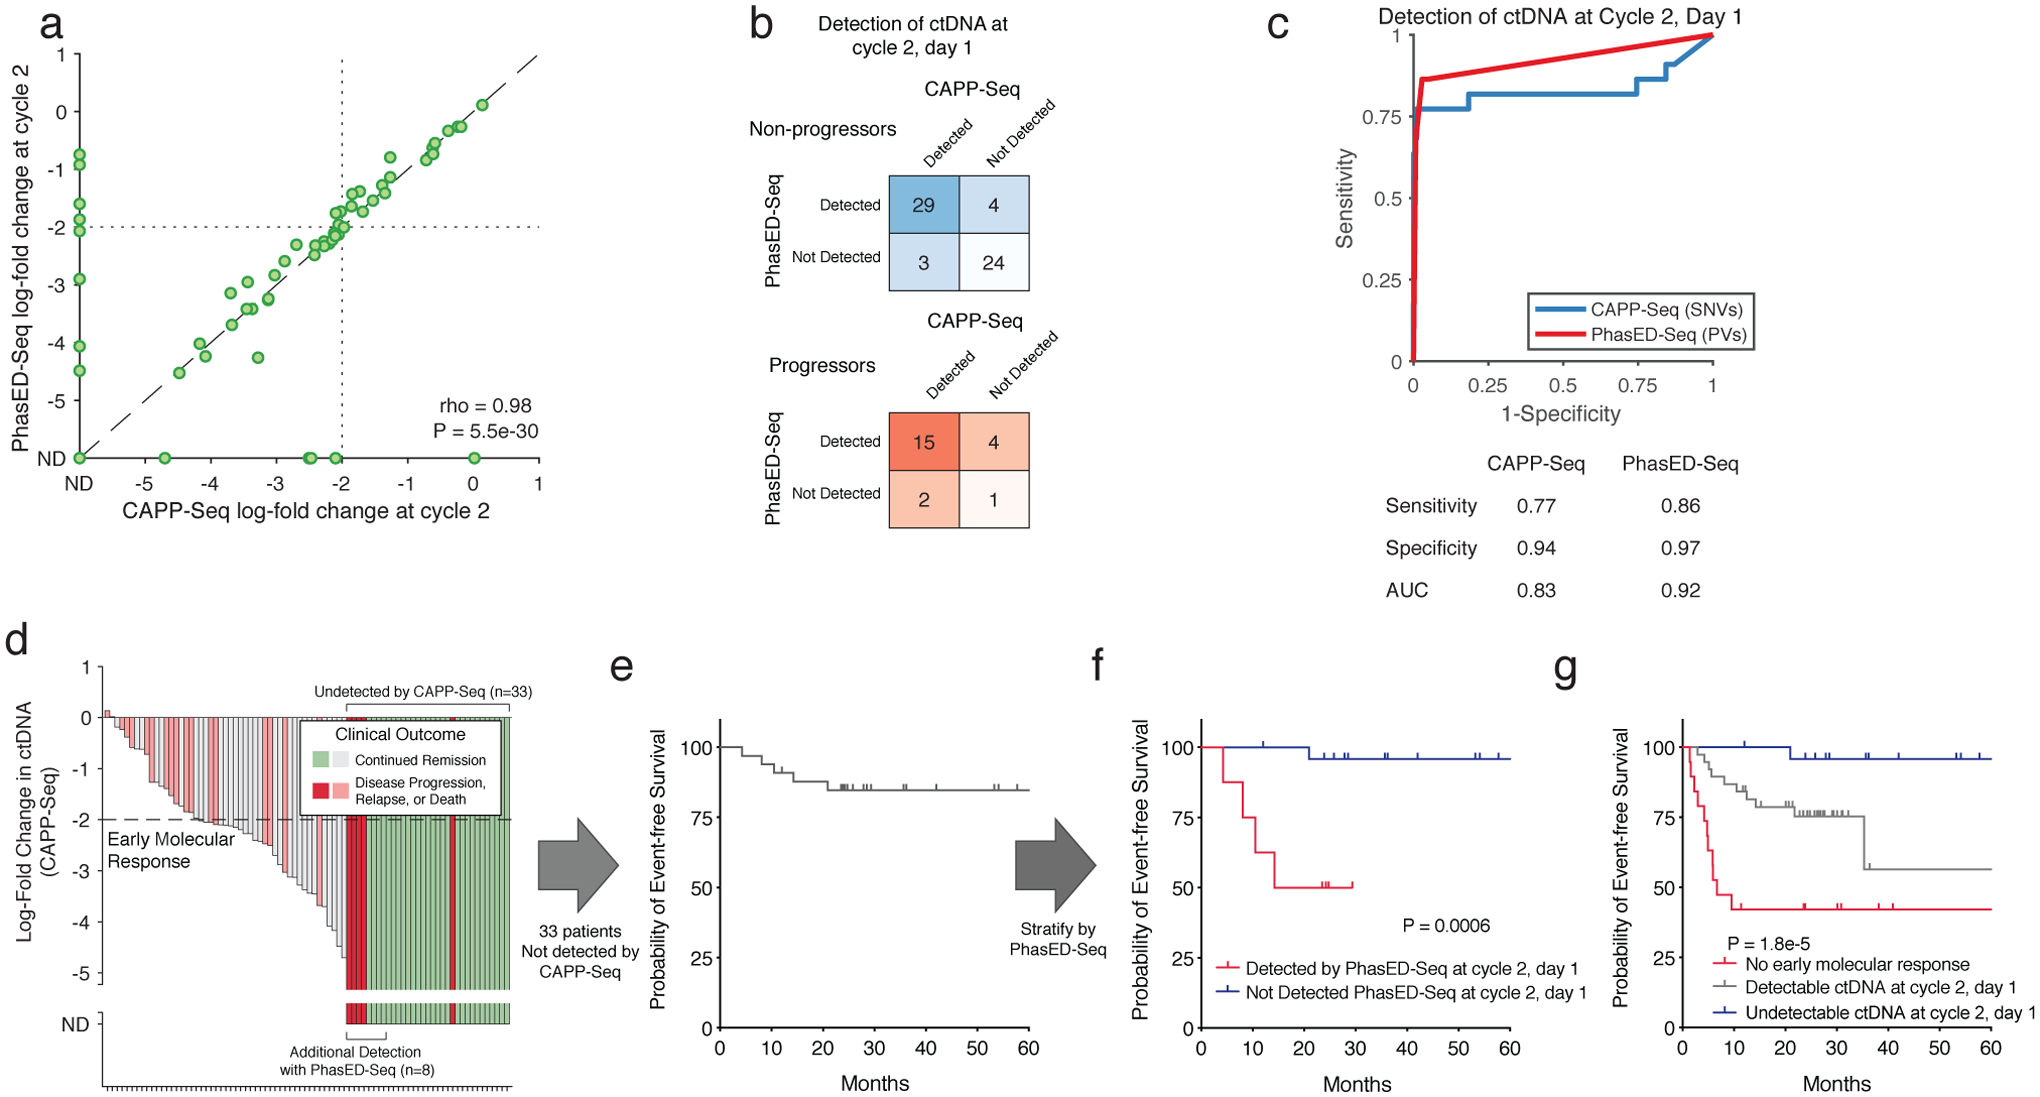
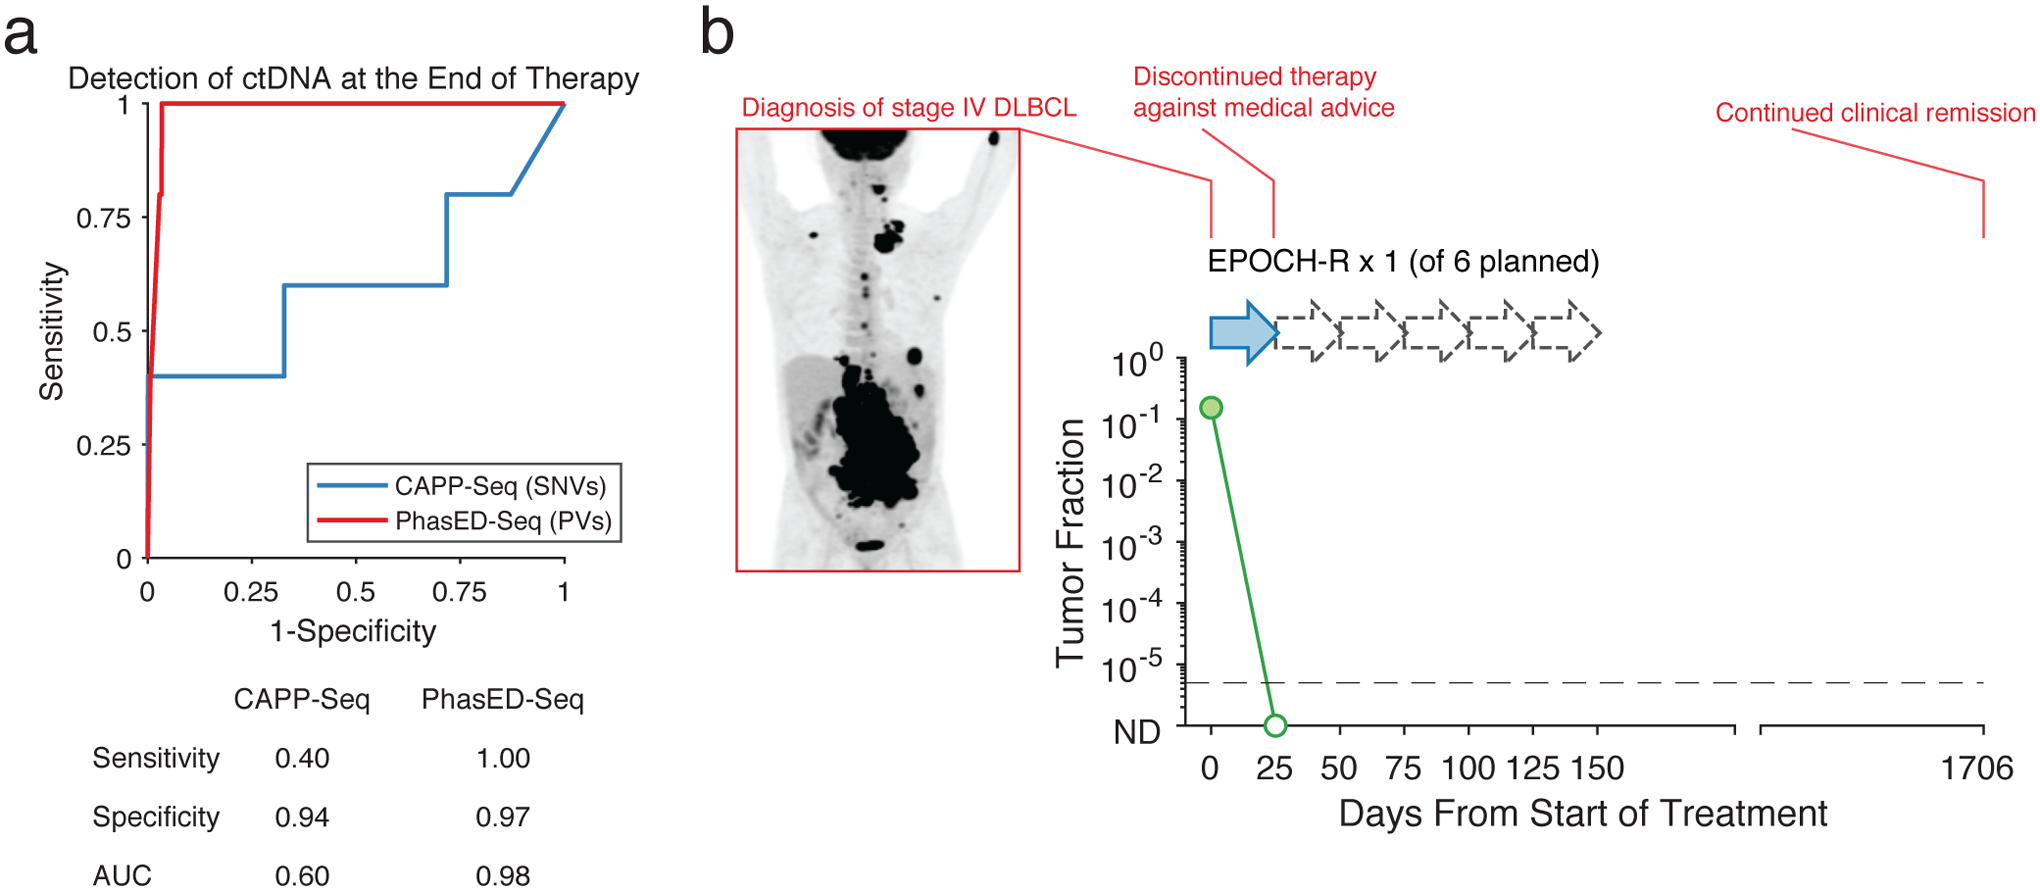
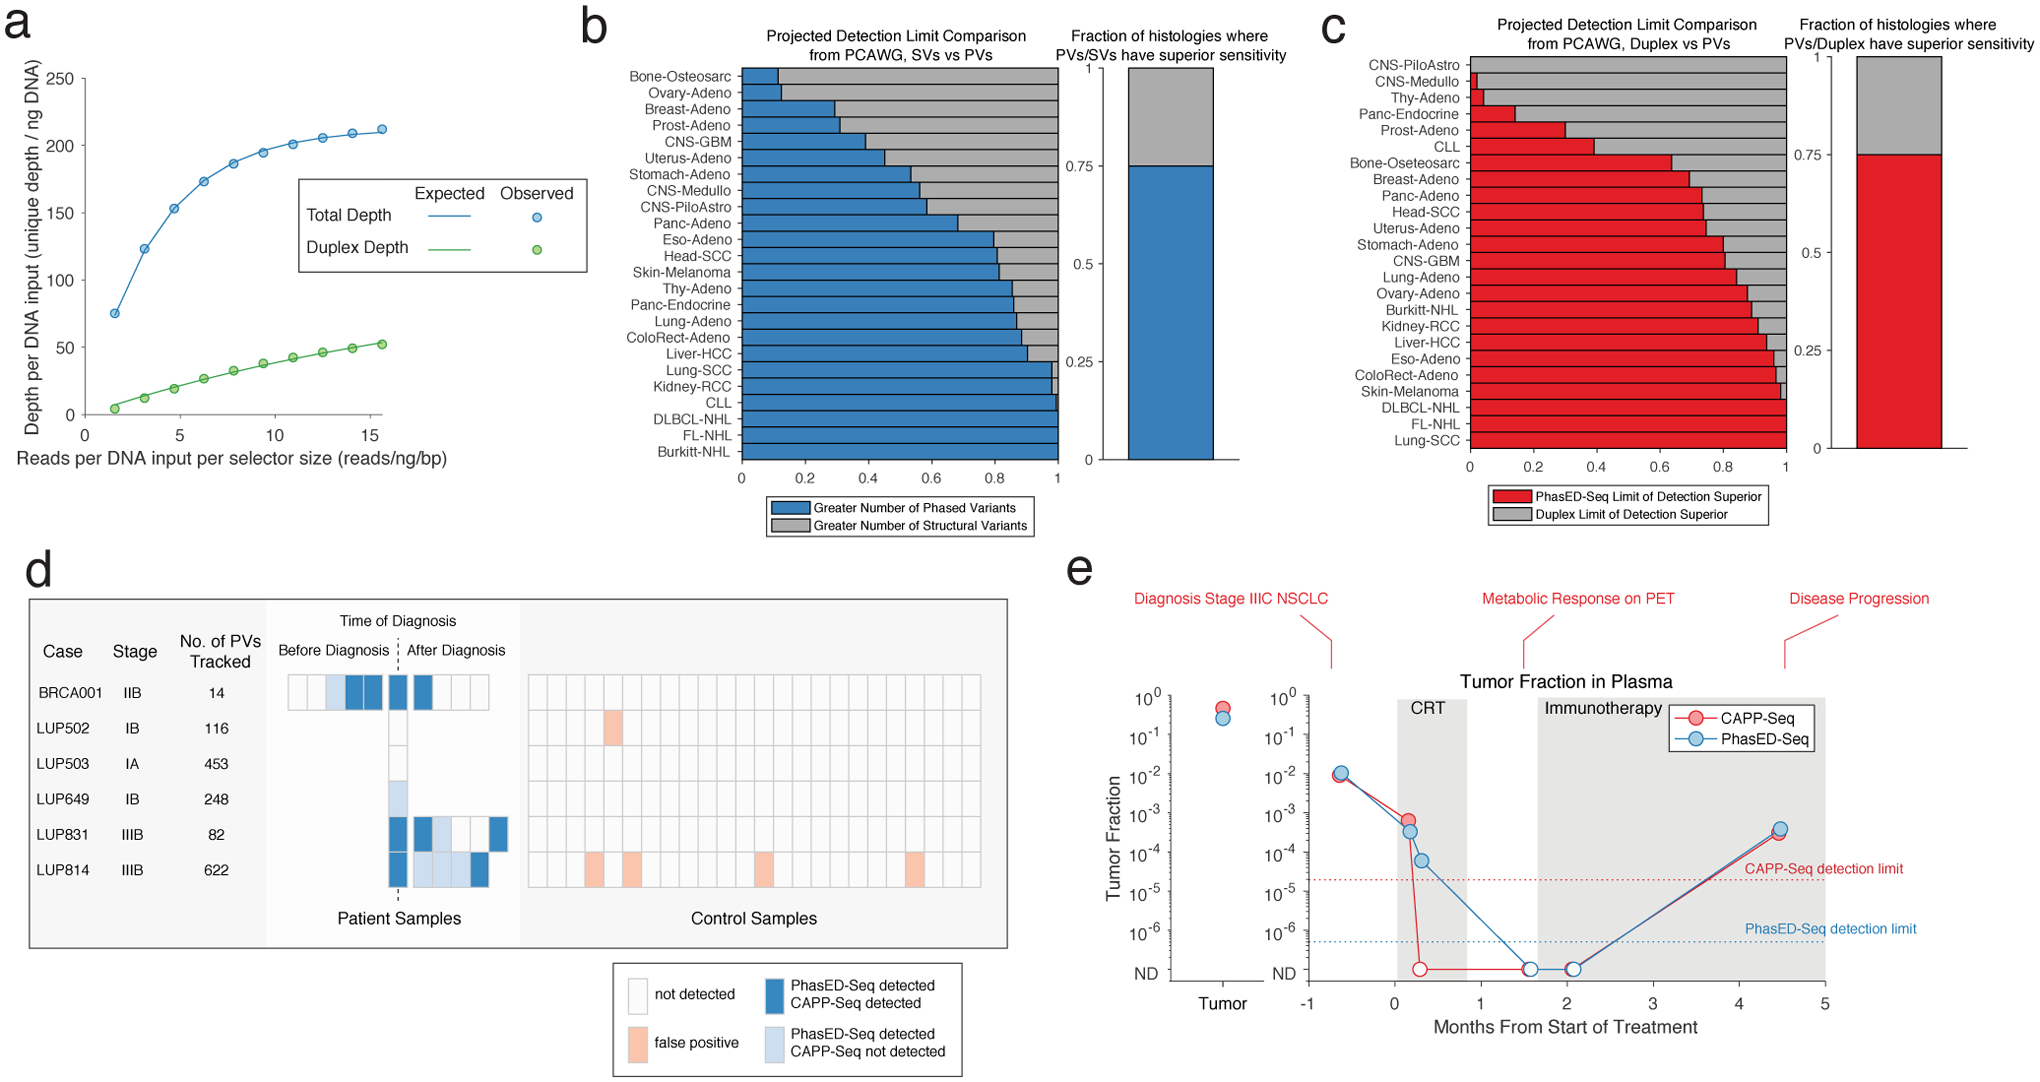
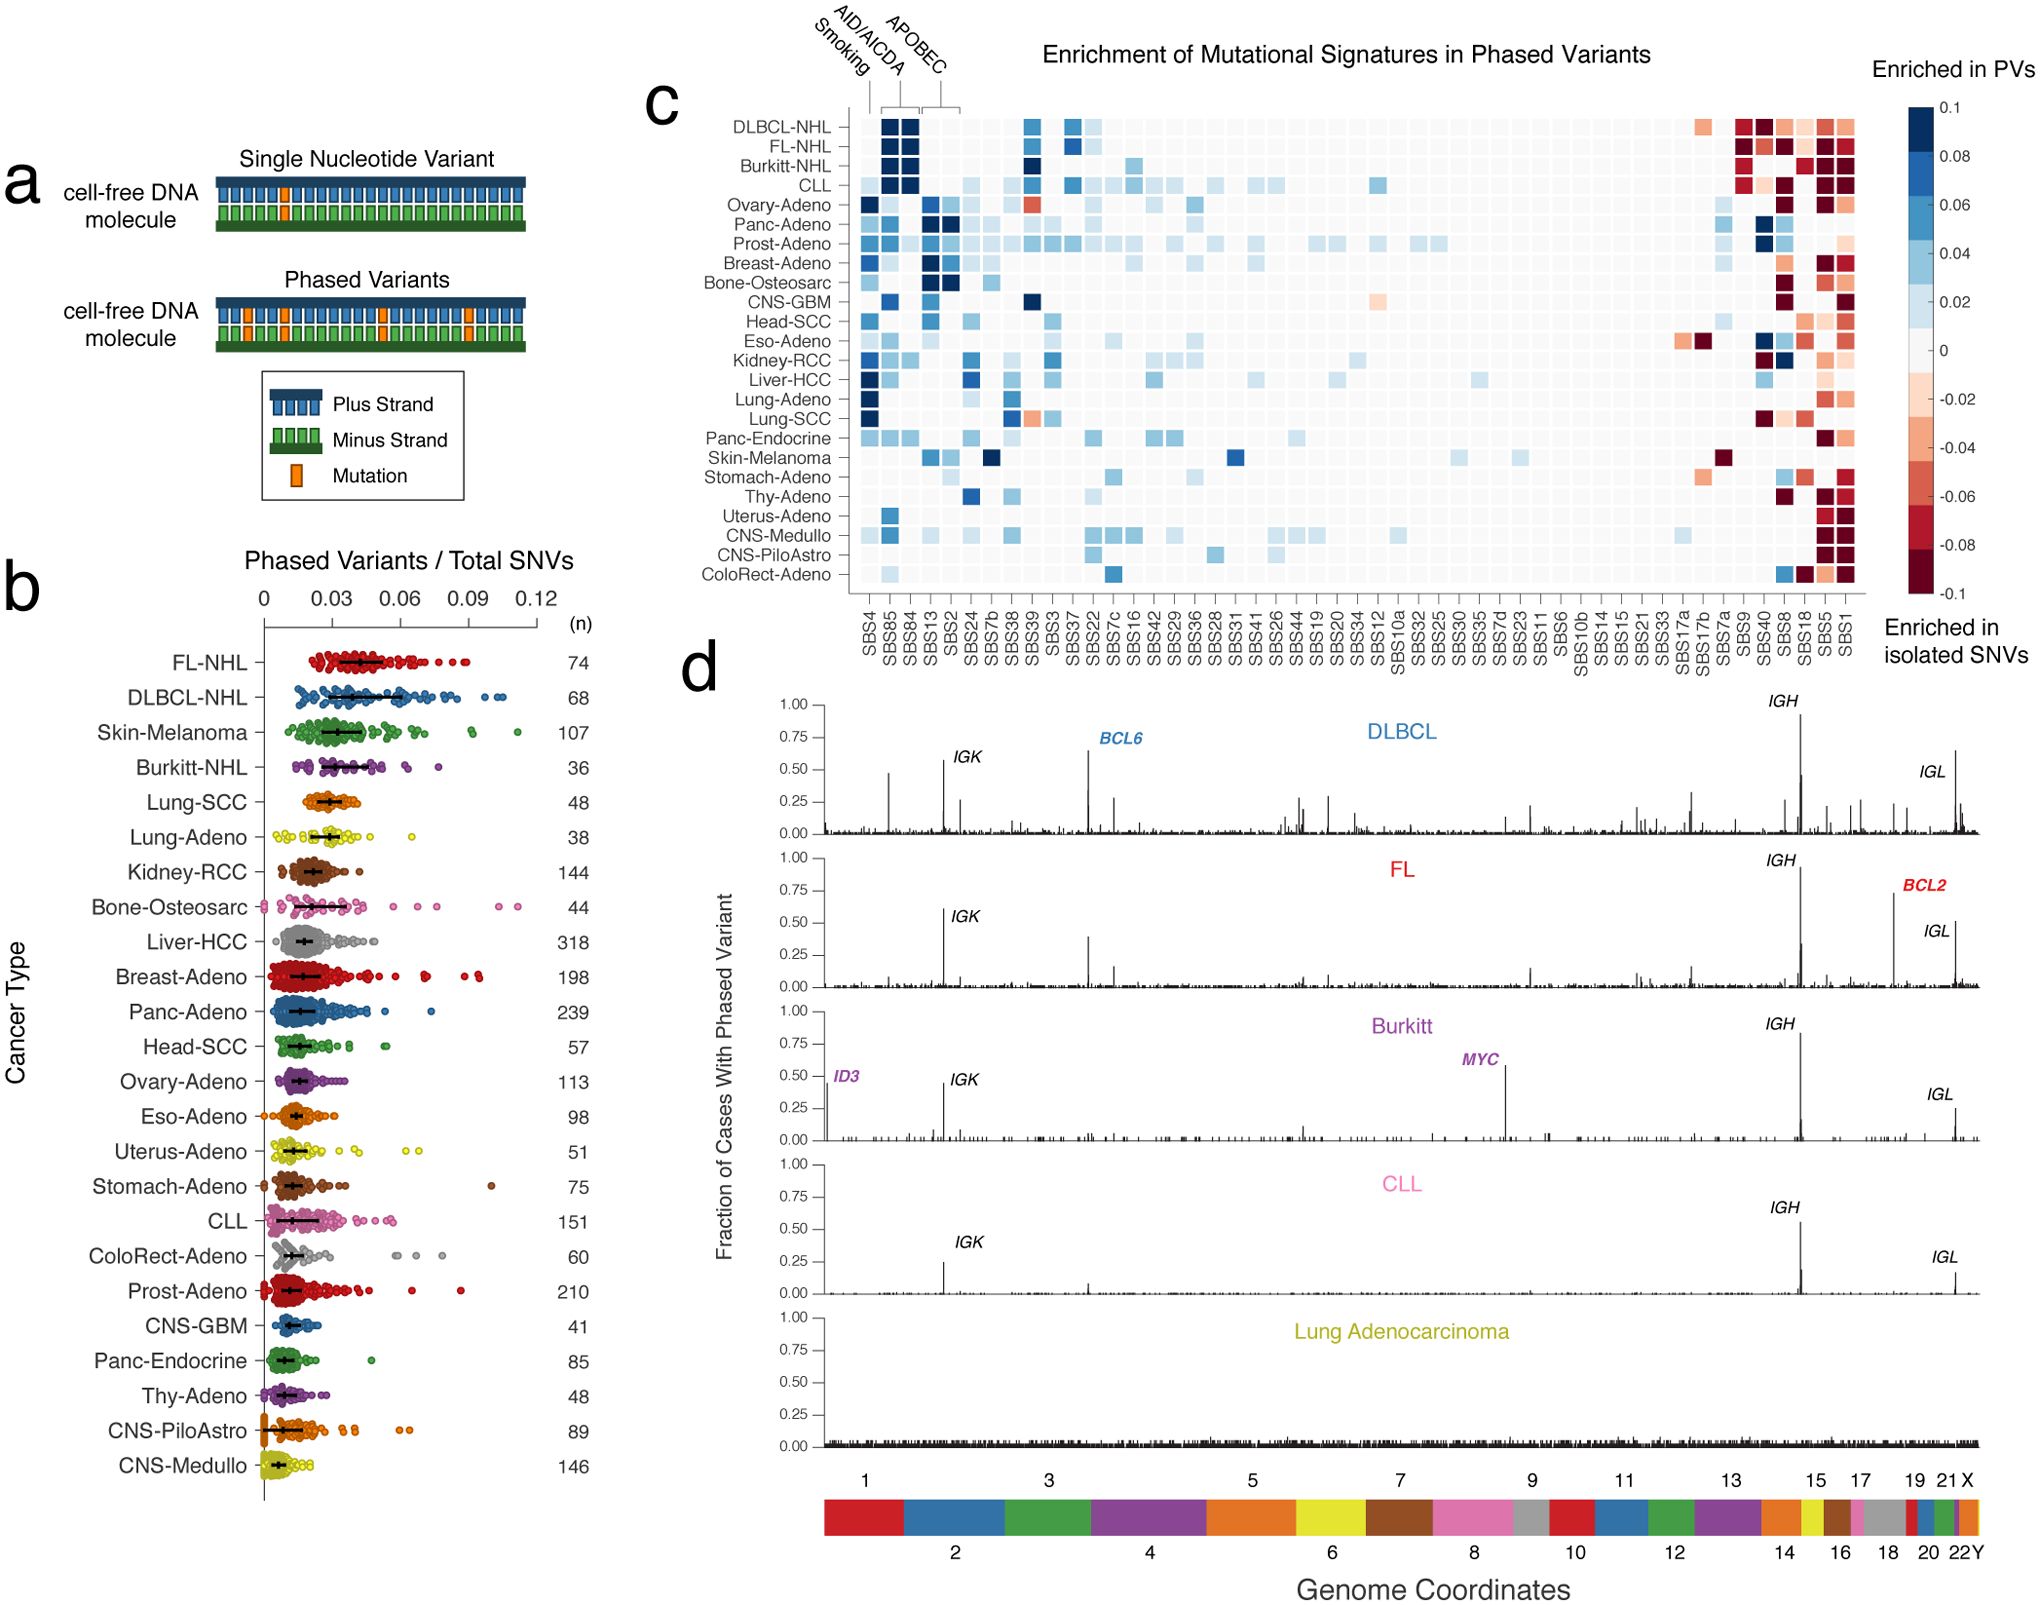
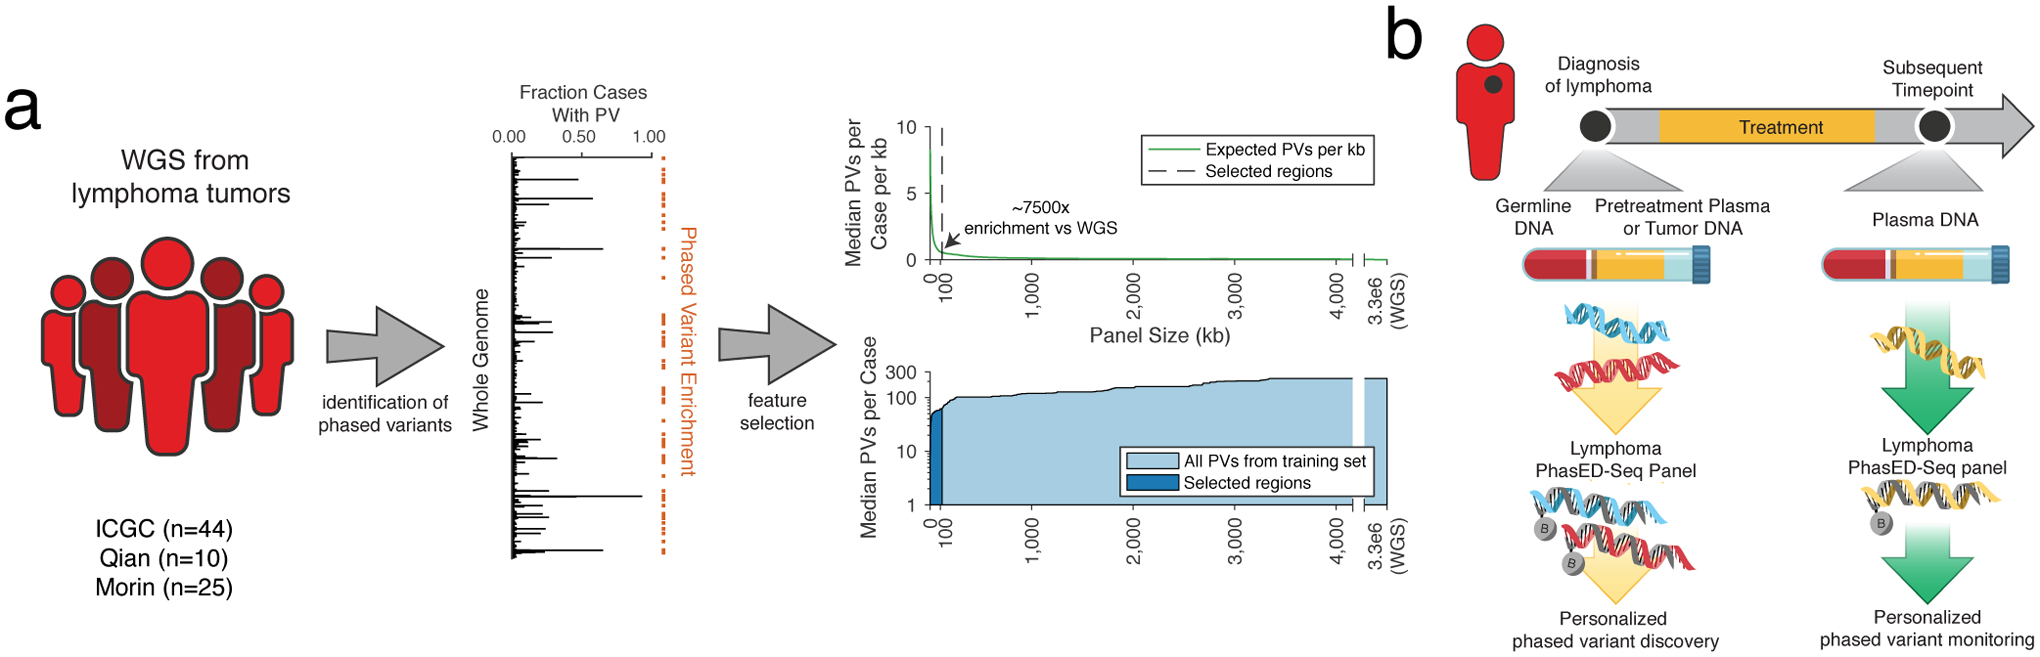
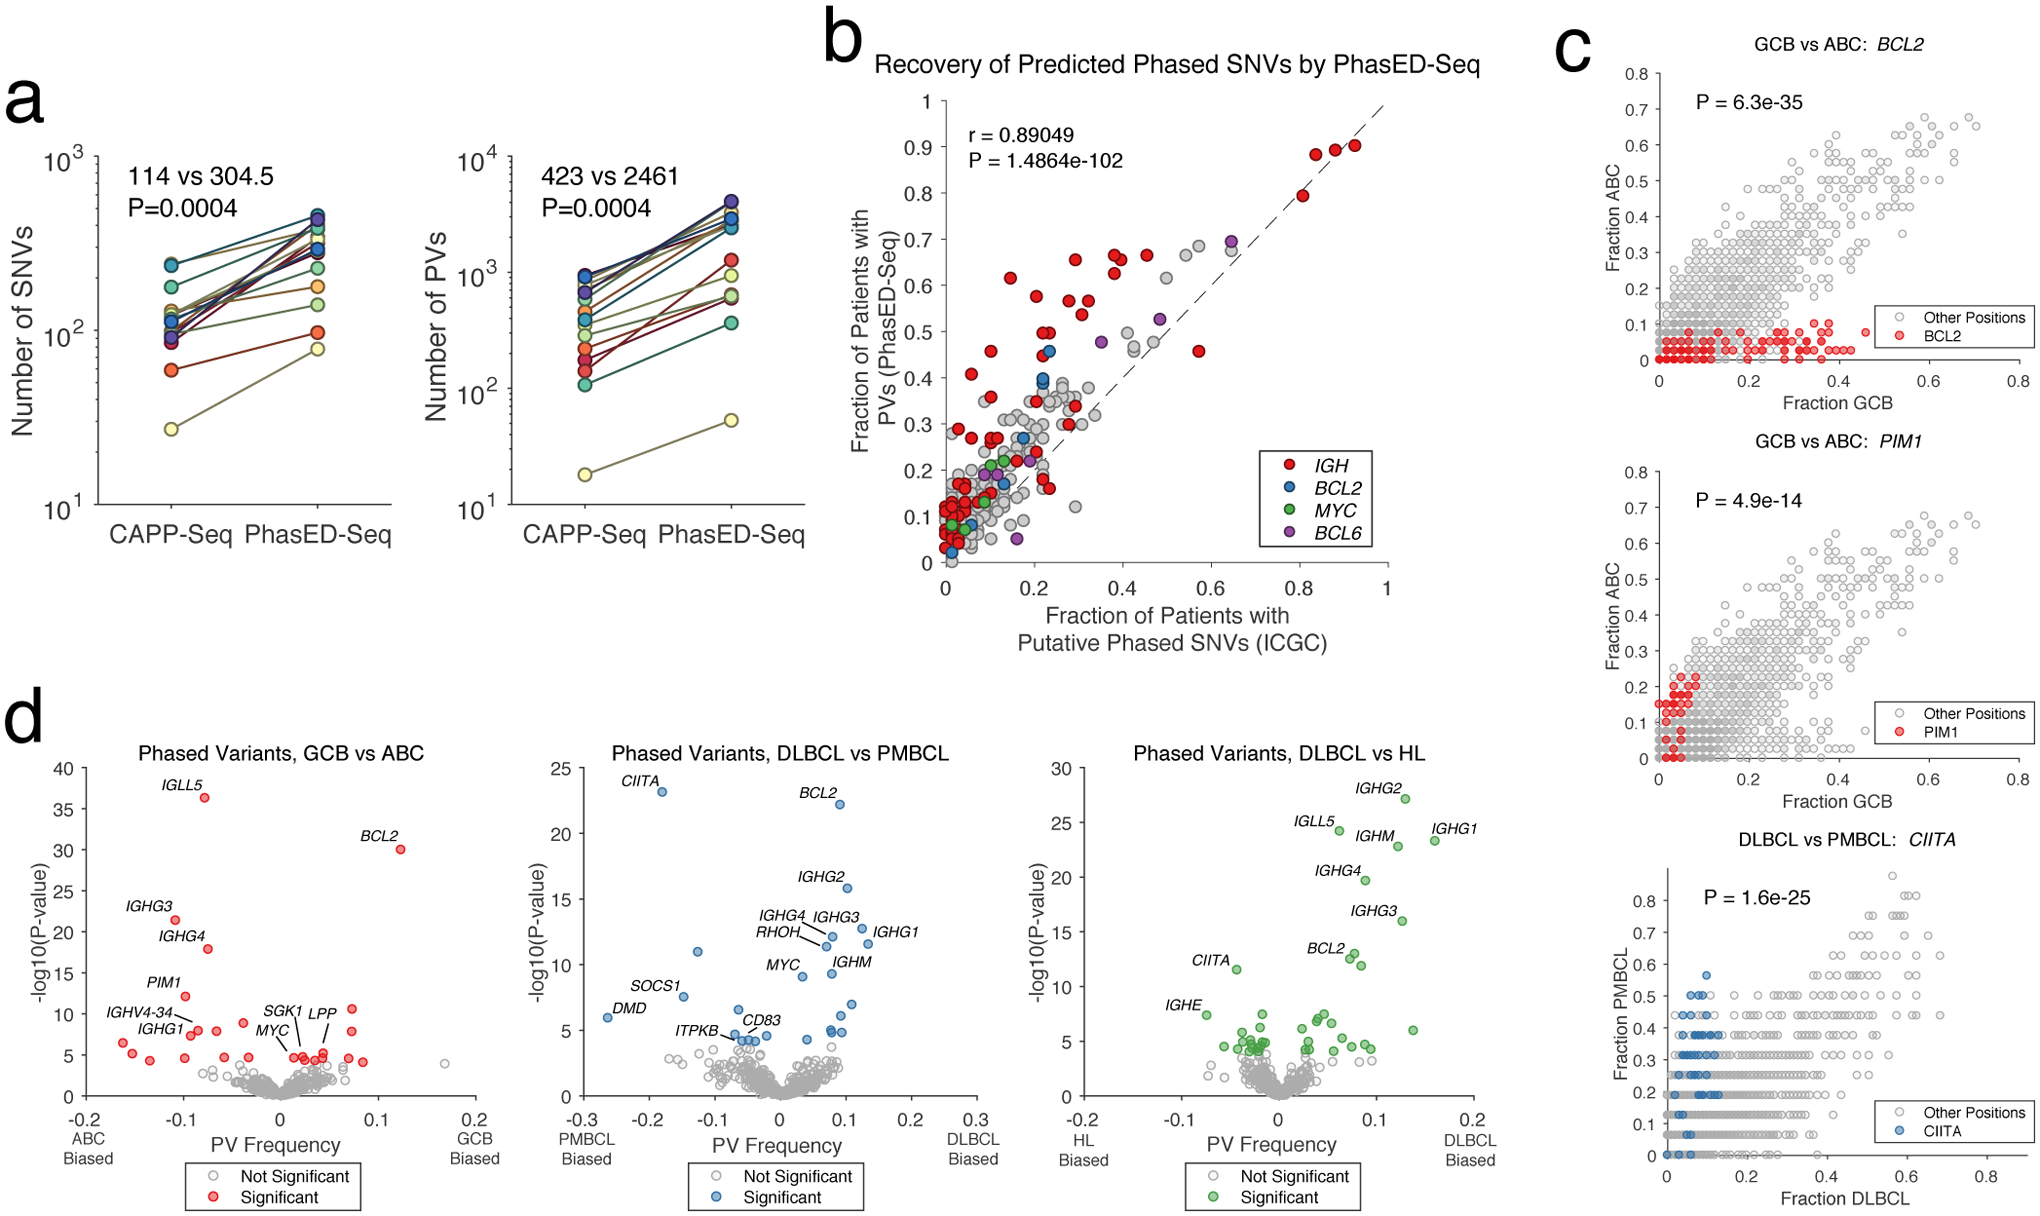
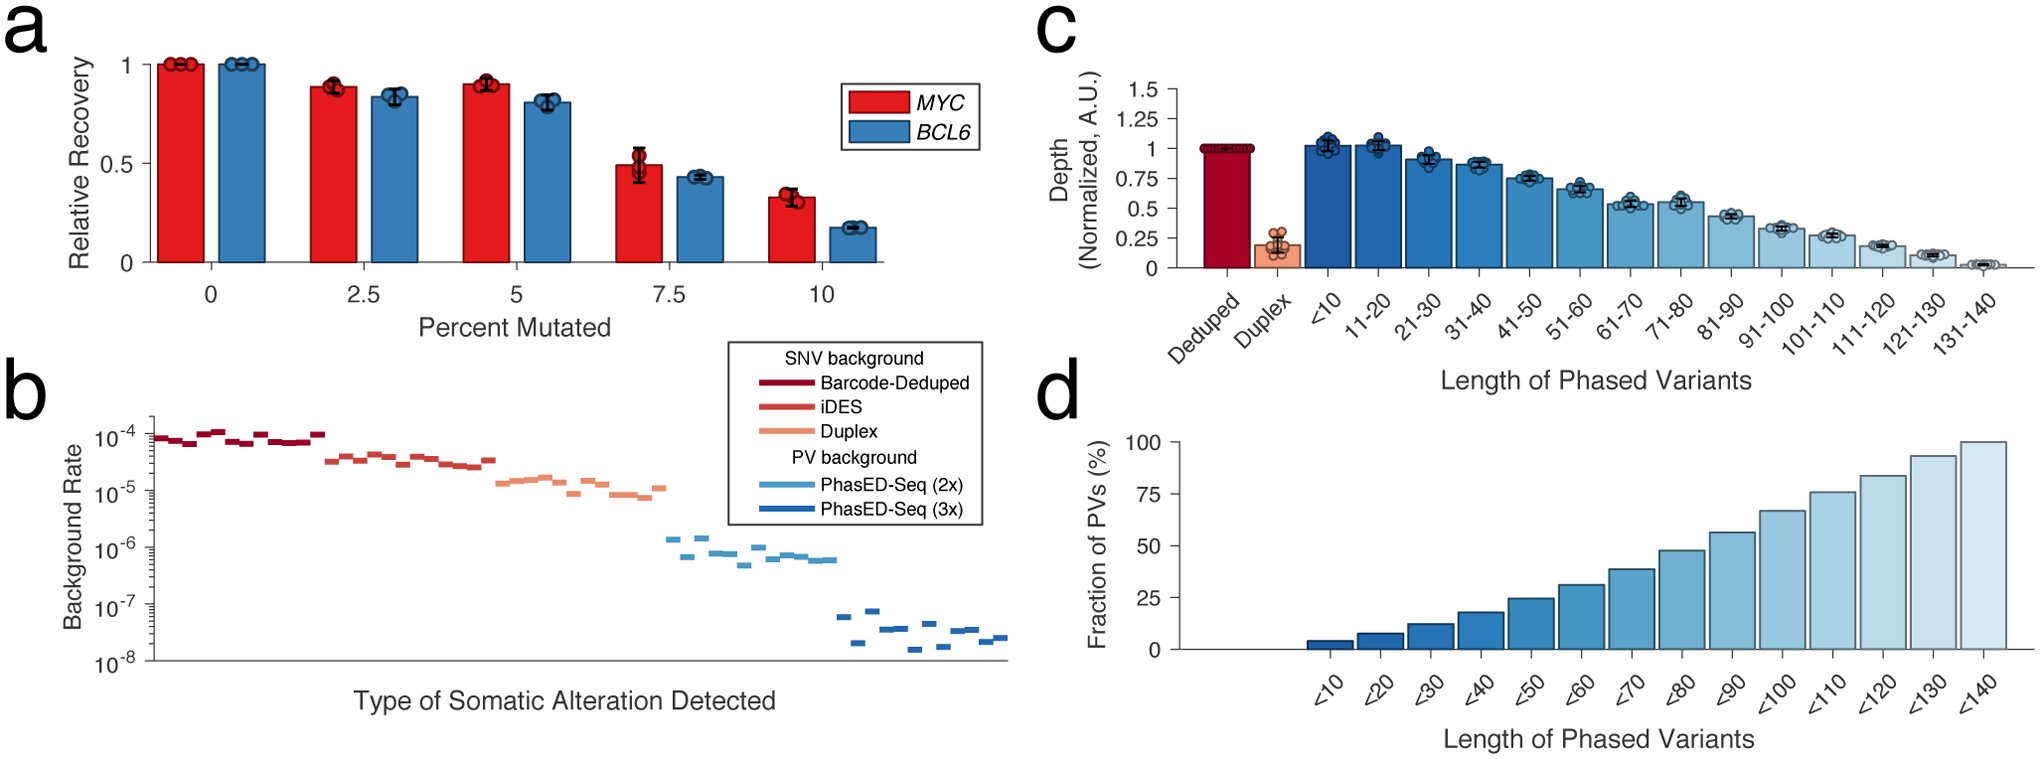
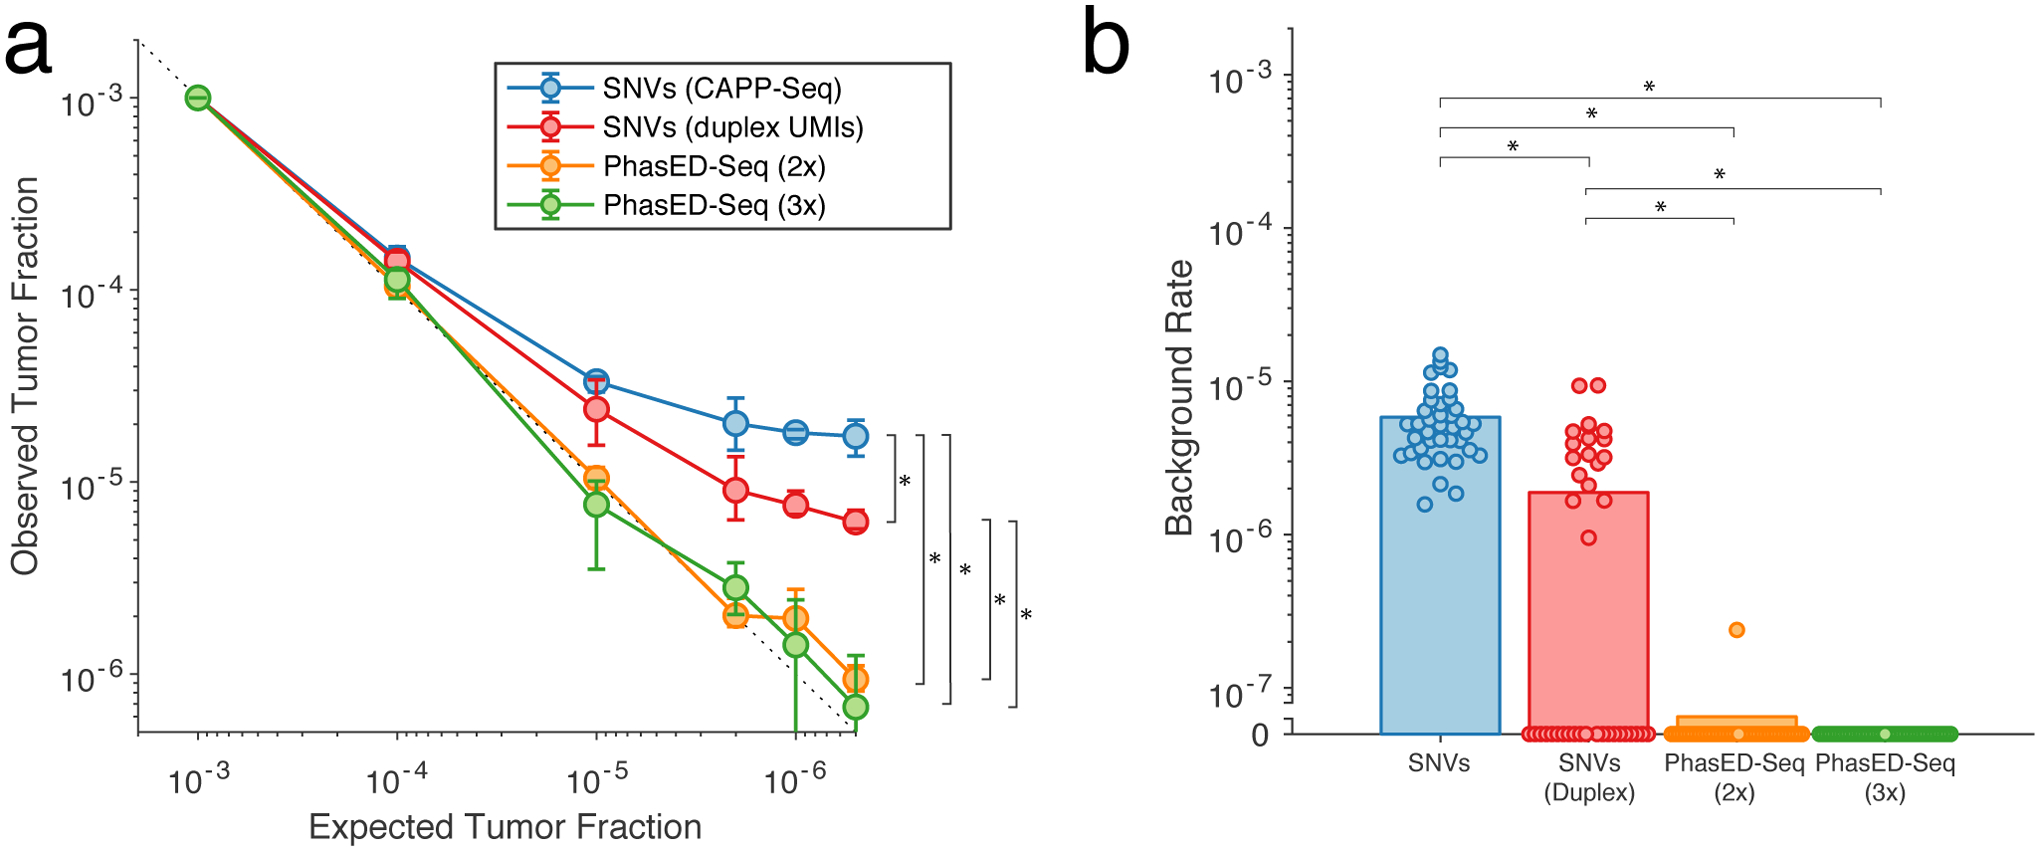
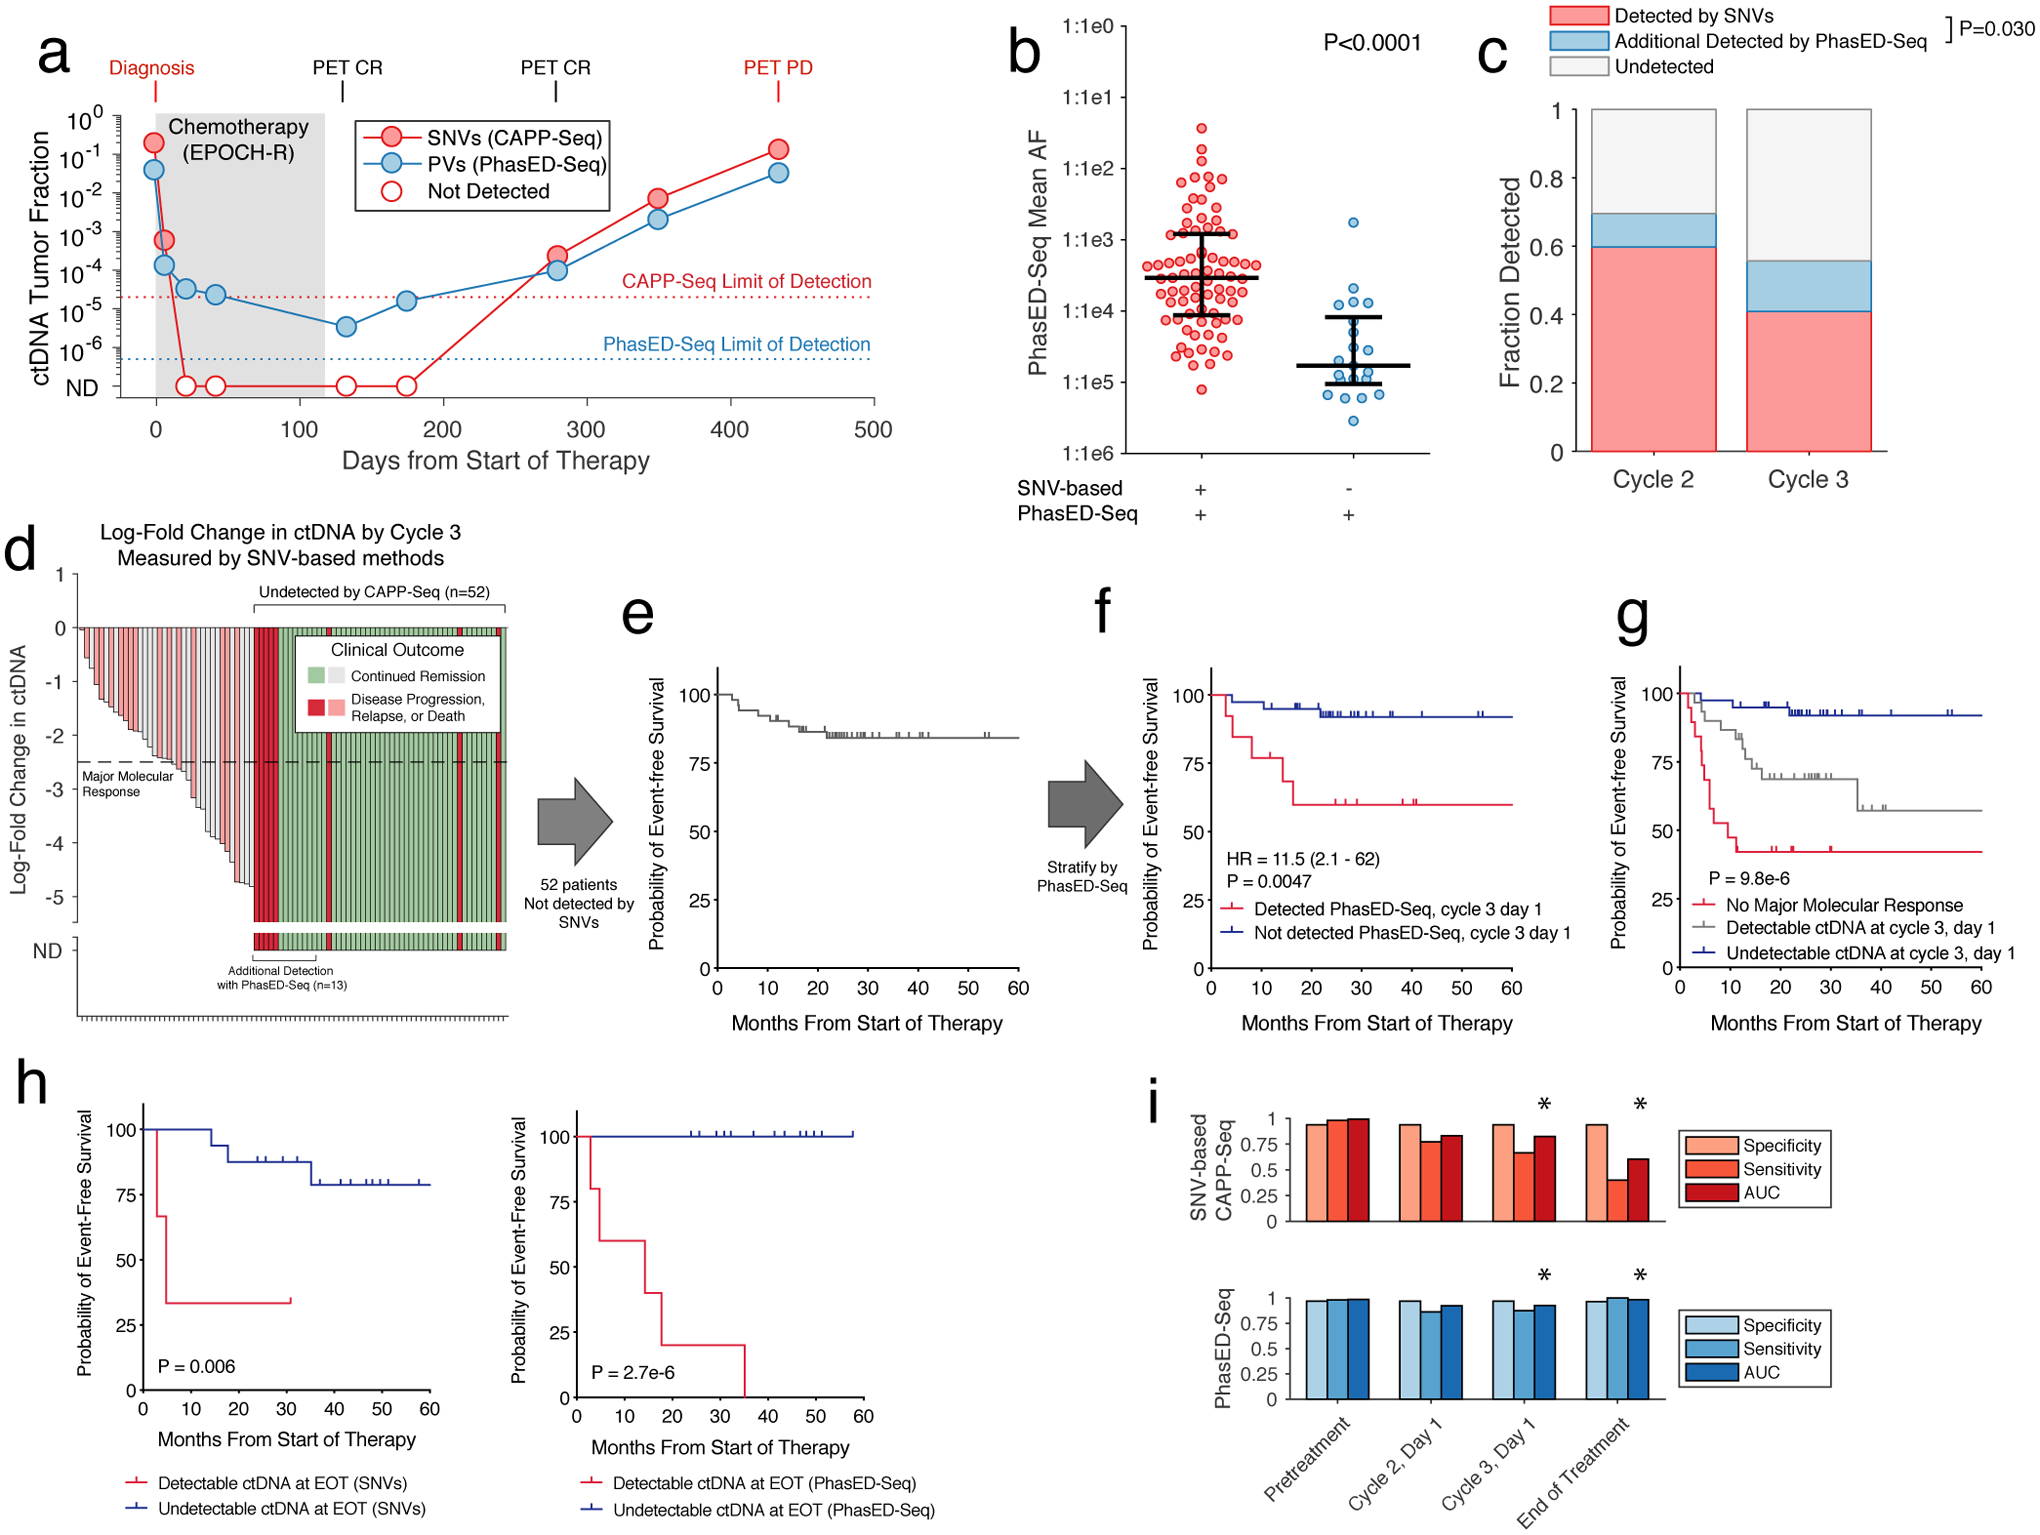
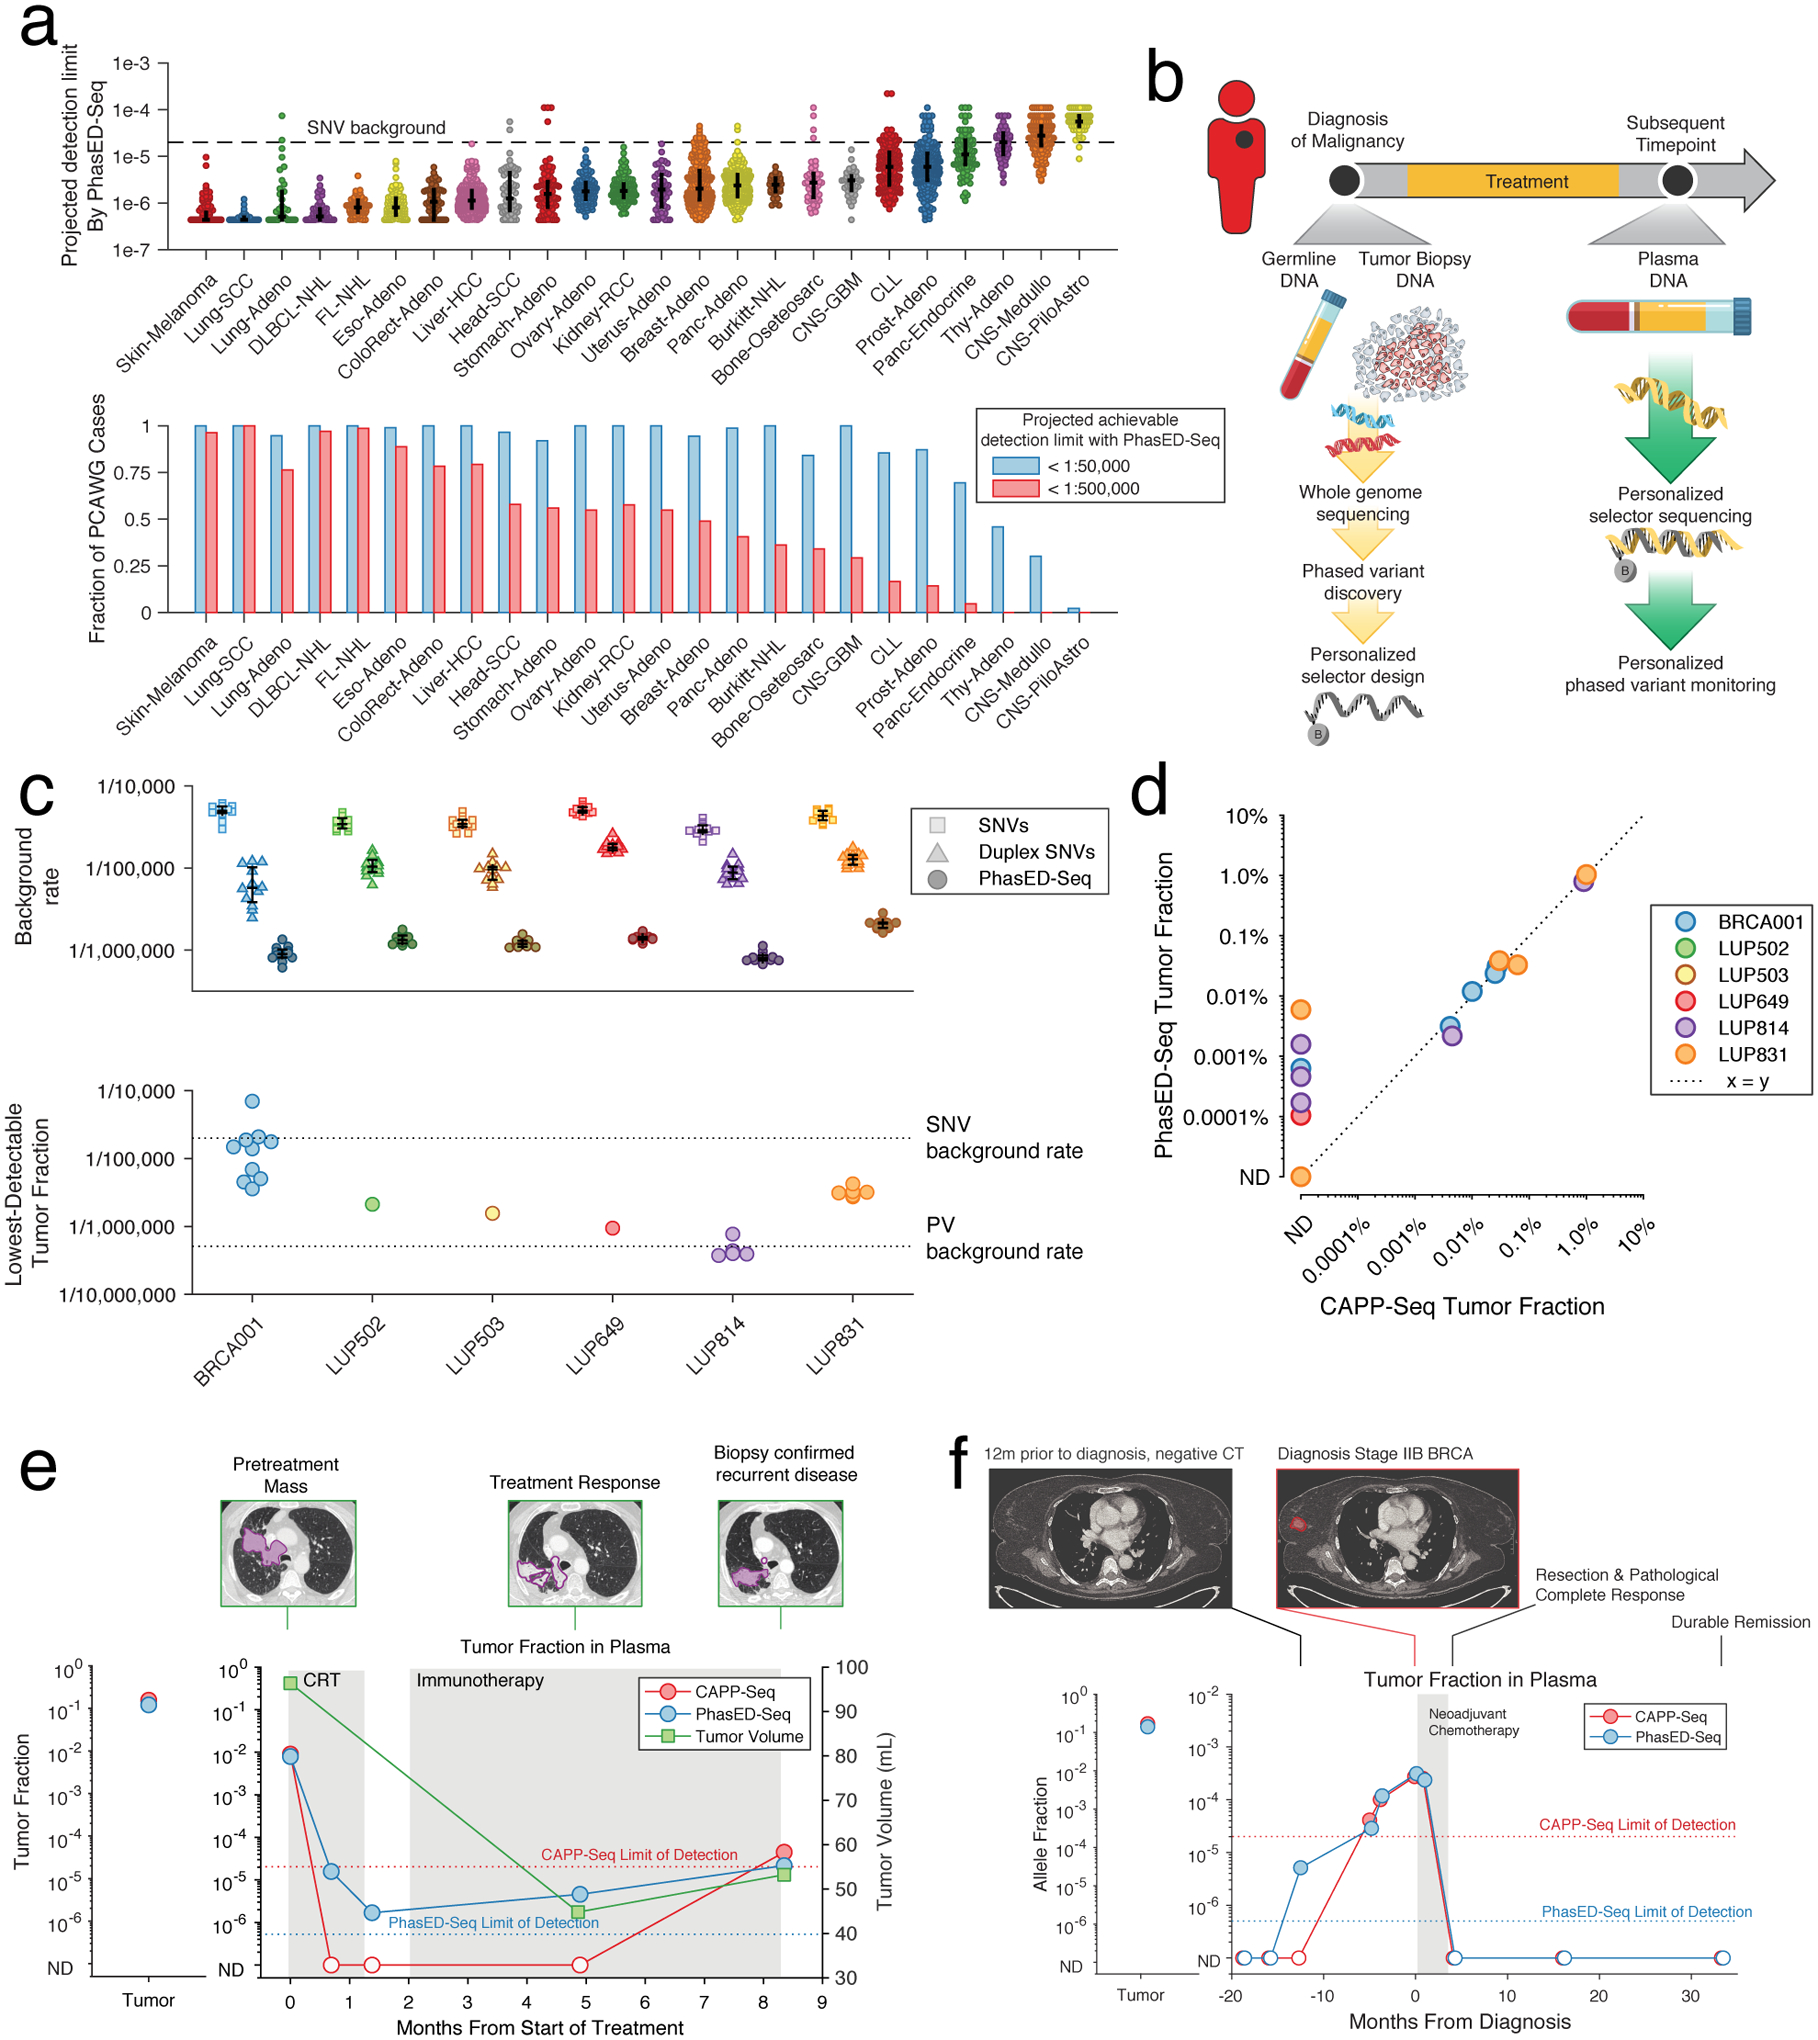
Circulating tumor-derived DNA (ctDNA) is an emerging biomarker for many cancers, but the limited sensitivity of current detection methods reduces its utility for diagnosing minimal residual disease. Here we describe phased variant enrichment and detection sequencing (PhasED-seq), a method that uses multiple somatic mutations in individual DNA fragments to improve the sensitivity of ctDNA detection. Leveraging whole-genome sequences from 2,538 tumors, we identify phased variants and their associations with mutational signatures. We show that even without molecular barcodes, the limits of detection of PhasED-seq outperform prior methods, including duplex barcoding, allowing ctDNA detection in the ppm range in participant samples. We profiled 678 specimens from 213 participants with B cell lymphomas, including serial cell-free DNA samples before and during therapy for diffuse large B cell lymphoma. In participants with undetectable ctDNA after two cycles of therapy using a next-generation sequencing-based approach termed cancer personalized profiling by deep sequencing, an additional 25% have ctDNA detectable by PhasED-seq and have worse outcomes. Finally, we demonstrate the application of PhasED-seq to solid tumors.


Figures

Extended Data Figure 1.
Extended Data Figure 1.. Comparison of duplex sequencing to phased variant sequencing.
a) A schema comparing error-suppressed sequencing by duplex sequencing vs. recovery of phased variants. In duplex sequencing, recovery of a single SNV observed on both strands of an original DNA double-helix (i.e., in trans) is required. This requires independent recovery of two molecules by sequencing as the plus and minus strands of the original DNA molecule go through library preparation and PCR independently. In contrast, recovery of PVs requires multiple SNVs observed on the same single strand of DNA (i.e., in cis). Thus, recovery of only the plus or the minus strand (rather than both) is sufficient for identification of PVs. b) A model showing the two possible reasons for limited sensitivity for ctDNA MRD assays. An assay can be limited by either having i) an insufficient number of cfDNA fragments evaluable for tumor content, or ii) an inadequate error-profile. This plot demonstrates the analytical sensitivity as the number of evaluable cfDNA fragments increase with either the amount of plasma input or the number of mutations tracked, until eventually becoming limited by the background signal (grey). Separate plots shown for single-stranded and double-stranded SNV based methods, assuming 8.92ng cfDNA/mL plasma; 50% efficiency of library preparation, and 20% efficiency of duplex sequencing.
Extended Data Figure 2.
Extended Data Figure 2.. Enumeration of SNVs and PVs in diverse cancers from WGS.
a-d) Univariate scatter plots showing the number of a) SNVs, b) 2x-PVs (2 SNVs in phase), c) 3x-PVs, and d) total 2x-PVs, controlling for total number of SNVs, from WGS data for 24 different histologies of cancer. Data are presented as median and interquartile range. (FL-NHL, follicular lymphoma; DLBCL-NHL, diffuse large B cell lymphoma; Burkitt-NHL, Burkitt lymphoma; Lung-SCC, squamous cell lung cancer; Lung-Adeno, lung adenocarcinoma; Kidney-RCC, renal cell carcinoma; Bone-Osteosarc, osteosarcoma; Liver-HCC, hepatocellular carcinoma; Breast-Adeno, breast adenocarcinoma; Panc-Adeno, pancreatic adenocarcinoma; Head-SCC, head and neck squamous cell carcinoma; Ovary-Adeno, ovarian adenocarcinoma; Eso-Adeno, esophageal adenocarcinoma; Uterus-Adeno, uterine adenocarcinoma; Stomach-Adeno, stomach adenocarcinoma; CLL, chronic lymphocytic leukemia; ColoRect-Adeno, colorectal adenocarcinoma; Prost-Adeno, prostate adenocarcinoma; CNS-GBM, glioblastoma multiforme; Panc-Endorcine, pancreatic neuroendocrine tumor; Thy-Adeno, thyroid adenocarcinoma; CNS-PiloAstro, piloastrocytoma; CNS-Medullo, medulloblastoma.)
Extended Data Figure 3.
Extended Data Figure 3.. Distribution of PVs in stereotyped regions across the genome.
Distribution of PVs occurring in stereotyped regions across the genome of multiple cancer types. In this plot, the genome was divided into 1000bp bins, and the fraction of samples of a given histology with a PV in each 1000bp bin was calculated. Only bins that have at least a 2 percent recurrence frequency in any cancer subtype are shown.
Extended Data Figure 4.
Extended Data Figure 4.. Performance of PhasED-Seq for recovery of PVs across lymphomas.
a) Univariate scatter plot comparing the fraction of all PVs across the genome identified by WGS (n=79) that were recovered by our previously reported lymphoma CAPP-Seq panel (left) compared to PhasED-Seq (right). b) Univariate scatter plot comparing the expected yield of SNVs per case identified from WGS using a previously established lymphoma CAPP-Seq panel or the PhasED-Seq panel. c) Univariate scatter comparing the expected yield of PVs per case identified from WGS using a previously established lymphoma CAPP-Seq panel or the PhasED-Seq panel. Data from three independent publicly available cohorts are shown in a-c). d-e) Plots showing the improvement in recovery of PVs by PhasED-Seq compared to CAPP-Seq in 16 patients sequenced by both assays. This includes improvement in d) two SNVs in phase (i.e., 2x or ‘doublet PVs’) and e) three SNVs in phase (3x or ‘triplet PVs’). Statistical testing in panels a-e) performed by 2-sided Wilcoxon signed-rank test. f) A cartoon describing the terminology for phased variants in this manuscript. The figure shows one region of an individual’s cancer genome (300bp). Phased variants on a single strand of DNA of DNA can occur with different numbers of SNVs, including 2 variants in phase (doublets) and 3 in phase (triplets). For the purpose of detecting ctDNA, ‘independent reporters’ are defined as PVs that will typically co-segregate on separate cfDNA molecules, resulting in independent evaluable fragments. Given the size of cfDNA molecules, these are separated in 150bp regions. g-j) These panels show the number of SNVs and PVs identified for patients with different types of lymphomas. These panels show the number of g) SNVs, h) doublet PVs, i) triplet PVs, and j) independent PV reporters; bars represent median and interquartile range. *, P<0.05 by two-sided Wilcoxon rank sum test; comparisons only shown for all histologies vs DLBCL. (DLBCL, diffuse large B-cell lymphoma; GCB, germinal center B-cell like DLBCL; ABC, activated B-cell like DLBCL; PMBCL, primary mediastinal B-cell lymphoma; FL, follicular lymphoma; HL, Hodgkin lymphoma; MCL, mantle cell lymphoma).
Extended Data Figure 5.
Extended Data Figure 5.. Technical aspects of PhasED-Seq by hybrid-capture sequencing.
a) Theoretical binding energy for 150-mers across the genome. Mutations were either clustered to one end (green), clustered in the middle (blue), or randomly throughout the sequence (red). Data represent the median and IQR from 10,000 in silico simulations. b) Histograms of summary metrics of the mutation rate of 151-bp windows from all patients in this study. c) The percentile of mutation rate across all mutated 151-bp windows across all patients in this study. d) Rate of background-signal in the PhasED-Seq panel for multiple variants, including SNVs (red), PVs (blue), and indels (green). Different methods of error-suppression for each variant type are shown. Bars represent median and IQR. UMIs, unique molecular identifiers; PhasED-Seq 2x, doublet PVs; PhasED-Seq 3x, triplet PVs. e) Error-rate for SNVs (left), doublet PVs (middle), and triplet PVs (right) by type of mutation. For triplet PVs, the x and y-axis represent the first and second type of base alteration in the PV. f) Error rate for doublet PVs across n=12 healthy cfDNA samples as a function of inter-SNV distance. Data show mean and standard deviation. g) Limiting dilution series simulating cfDNA similar to Fig 5a; cfDNA from 3 independent patient samples were used in each dilution. In this plot, PhasED-Seq is assessed without the use of UMIs. Data are presented as mean and range. *, P<0.05; CAPP-Seq vs duplex, P=3.2e-5; CAPP-Seq vs PhasED-Seq (2x), P=1.6e-4; CAPP-Seq vs PhasED-Seq (3x), P=1.9e-5; duplex vs PhasED-Seq (2x), 0.017; duplex vs PhasED-Seq (3x), 0.0046. h) Theoretical rate of detection for a sample with a given number of PV-containing regions, according to binomial sampling, assuming unique sequencing depth of 4000–6000x (shaded area; 5000x shown as line). i) Observed rate of detection given a true tumor fraction, with varying numbers of PV-containing regions. Filled-in points represent ‘wet’ experiments; open points represent in silico dilution experiments. Data represent mean and range. j) Predicted vs observed rate of detection for samples from the dilution series shown in panels h) and i). Error-bars are as described in h) and i) above (see Supplementary Methods).
Extended Data Figure 6.
Extended Data Figure 6.. Comparison of ctDNA quantitation by PhasED-Seq to CAPP-Seq and clinical applications.
a) ROC curve of the performance for detection of ctDNA from SNVs (i.e., CAPP-Seq) and PVs using PhasED-Seq. Positive samples are 107 pretreatment plasmas, negative samples are 40 control plasmas assessed for evidence of ctDNA using 107 personalized mutation lists for 4,280 total samples. Sensitivity and specificity at optimum point and AUC are shown. b) Quantity of ctDNA (measured as log10(haploid genome equivalents/mL)) as measured by CAPP-Seq vs. PhasED-Seq in individual samples. Samples taken prior to cycle 1 of RCHOP therapy (i.e., pretreatment), prior to cycle 2, and prior to cycle 3, are shown in independent colors (blue, green, and red respectively; 277 total samples). Undetectable levels fall on the axes. Spearman correlation and P-value are shown.
Extended Data Figure 7.
Extended Data Figure 7.. Detection of ctDNA after two cycles of systemic therapy.
a) Scatterplot shows the log-fold change in ctDNA after 2 cycles of therapy measured by CAPP-Seq or PhasED-Seq for patients receiving RCHOP therapy. Dotted lines show the previously established threshold of a 2.5-log reduction in ctDNA for molecular response. Undetectable samples fall on the axes; the correlation coefficient represents a Spearman rho for the samples detected by both CAPP-Seq and PhasED-Seq. b) Detection rate of ctDNA samples after 2 cycles of therapy by PhasED-Seq vs CAPP-Seq. Patients with eventual disease progression are shown in red, while patients without eventual disease progression are shown in blue. c) ROC curve for detection of ctDNA after 2 cycles of treatment. Positive samples include 24 samples from patients with eventual disease progression, and therefore are known to have residual disease. Negative samples are from 4,280 tests on healthy controls as described in Extended Data Fig 6a. d) Kaplan-Meier plots and two-sided log-rank test showing the event-free survival of 69 patients achieving an MMR stratified by ctDNA detection with CAPP-Seq (top) or PhasED-Seq (bottom).
Extended Data Figure 8.
Extended Data Figure 8.. Detection of ctDNA after one cycle of systemic therapy.
a) Scatterplot showing the log-fold change in ctDNA after 1 cycle of therapy measured by CAPP-Seq or PhasED-Seq for patients receiving RCHOP therapy. Dotted lines show the previously established threshold of a 2-log reduction in ctDNA for molecular response. Undetectable samples fall on the axes; the correlation coefficient represents a Spearman rho for the samples detected by both CAPP-Seq and PhasED-Seq. b) Detection rate of ctDNA samples after 1 cycle of therapy by PhasED-Seq vs CAPP-Seq. Patients with eventual disease progression are shown in red, while patients without eventual disease progression are shown in blue. c) ROC curve for detection of ctDNA after 2 cycles of treatment. Positive samples include 22 samples from patients with eventual disease progression, and therefore are known to have residual disease. Negative samples are from 4,280 tests on healthy controls as described in Extended Data Fig 6a. d) Waterfall plot showing the change in ctDNA levels measured by CAPP-Seq after 1 cycle of first-line therapy in patients with DLBCL. Patients with undetectable ctDNA by CAPP-Seq are shown as “ND” (“not detected”), in darker colors. The colors of the bars also indicate the eventual clinical outcomes for these patients. e) A Kaplan-Meier plot showing the event-free survival for 33 DLBCL patients with undetectable ctDNA measured by CAPP-Seq after 1 cycle of therapy. f) A Kaplan-Meier plot and two-sided log-rank test showing the event-free survival of 33 patients shown in f) (undetectable ctDNA by CAPP-Seq) stratified by ctDNA detection via PhasED-Seq at this same time-point (cycle 2, day 1). g) A Kaplan-Meier plot and two-sided log-rank test showing the event-free survival for 82 patients with DLBCL stratified by ctDNA at cycle 2, day 1 separated into 3 strata – patients failing to achieve an early molecular response (red), patients with an early molecular response who still have detectable ctDNA by PhasED-Seq and/or CAPP-Seq (grey), and patients who have a stringent molecular remission (undetectable ctDNA by PhasED-Seq and CAPP-Seq; blue).
Extended Data Figure 9.
Extended Data Figure 9.. Performance of ctDNA detection at the end of systemic therapy.
a) ROC curve for detection of ctDNA after the completion of planned systemic therapy. Positive samples include 5 samples from patients with eventual disease progression, and therefore are known to have residual disease. Negative samples are from 4,280 tests on healthy controls as described in Extended Data Fig 6a. b) The ctDNA profile of a patient with stage 4 DLBCL undergoing systemic chemotherapy, with pretreatment PET scan shown on the left. This patient only received one cycle of EPOCH-R chemotherapy from 6 planned treatments (dashed arrows – planned therapy that was not given). Following this, the patient self-discontinued treatment. This patient was found to have cleared their ctDNA by PhasED-Seq and continues in clinical remission after > 4 years.
Extended Data Figure 10.
Extended Data Figure 10.. Extension of PhasED-Seq to solid tumors.
a) A mathematical model showing the expected total unique molecular depth (blue) and duplex molecular depth (green) from an optimized hybrid-capture workflow (Chabon et al; Methods). b) A comparison in projected sensitivity for ctDNA detection using PVs versus structural variants (SVs) for various histologies from the PCAWG dataset. Comparison assumes a personalized sequencing panel targeting only patient-specific variants, 64ng of DNA input and 20 million sequencing reads, using the model of molecular recovery from a). c) A comparison in expected sensitivity for ctDNA detection using PVs versus duplex sequencing and SNVs for various histologies from the PCAWG dataset. Comparison assumes a personalized sequencing panel targeting only patient-specific variants, 64ng of DNA input and 20 million sequencing reads, using the model of molecular recovery from a). d) Detection of ctDNA for the 6 cases of patients with solid tumors, including lung cancer (n=5) and breast cancer (n=1) using SNV-based detection (i.e., CAPP-Seq) or PhasED-Seq with a personalized panel. Detection of ctDNA in patient plasma samples are shown in blue; samples detectable with PhasED-Seq but not SNV based approaches are in light blue. Specificity of the assay was assessed using 24 healthy control samples; detection of evidence of ctDNA by PhasED-Seq in these are shown on the right in pink across all 6 personalized panels, indicating 97% (139/144) specificity; CAPP-Seq on the same samples showed 95% (137/144) specificity. e) The ctDNA profile of a patient with stage 3 lung adenocarcinoma (LUP831) undergoing combined chemo-radiotherapy (CRT) and immunotherapy, measured by both CAPP-Seq and PhasED-Seq. The left panel shows the measured tumor fraction in the tumor biopsy sample using both methods. The right panel shows the tumor fraction from plasma DNA, including a sample detected by PhasED-Seq that is undetected by CAPP-Seq. ND: not detected.
Figure 1.
Figure 1.. Discovery of phased variants and their mutational signatures via analysis of whole-genome sequencing data.
a) A cartoon depicting the difference between a single nucleotide variant (SNV) (top) and multiple variants ‘in-phase’ (phased variants, PVs; bottom) on DNA molecules. In theory, PVs are more specific events than isolated SNVs. b) A scatter plot showing the distribution of PVs from WGS data for 24 different cancer histologies, normalized by total SNVs. Bars represent the median and interquartile range (IQR). (FL-NHL, follicular lymphoma; DLBCL-NHL, diffuse large B-cell lymphoma; Burkitt-NHL, Burkitt lymphoma; Lung-SCC, squamous cell lung cancer; Lung-Adeno, lung adenocarcinoma; Kidney-RCC, renal cell carcinoma; Bone-Osteosarc, osteosarcoma; Liver-HCC, hepatocellular carcinoma; Breast-Adeno, breast adenocarcinoma; Panc-Adeno, pancreatic adenocarcinoma; Head-SCC, head and neck squamous cell carcinoma; Ovary-Adeno, ovarian adenocarcinoma; Eso-Adeno, esophageal adenocarcinoma; Uterus-Adeno, uterine adenocarcinoma; Stomach-Adeno, stomach adenocarcinoma; CLL, chronic lymphocytic leukemia; ColoRect-Adeno, colorectal adenocarcinoma; Prost-Adeno, prostate adenocarcinoma; CNS-GBM, glioblastoma multiforme; Panc-Endorcine, pancreatic neuroendocrine tumor; Thy-Adeno, thyroid adenocarcinoma; CNS-PiloAstro, piloastrocytoma; CNS-Medullo, medulloblastoma.) c) Heatmap demonstrating enrichment in SBS mutational signatures for PVs versus single SNVs across cancer types. Blue represents signatures enriched in PVs; red represents signatures where un-phased, single SNVs are enriched. Only signatures with a significant difference between PVs and unphased SNVs after correcting for multiple hypotheses are shown; other signatures are grey (Methods). See https://phasedseq.stanford.edu for additional details. d) Bar plots showing the distribution of PVs in stereotyped regions across the genome in B-lymphoid malignancies and lung adenocarcinoma. The genome was divided into 1000bp bins, and the fraction of sampleswith a PV in each bin was calculated. Only bins that have at least a 2 percent recurrence frequency in any cancer subtype are shown.
Figure 2.
Figure 2.. Design of phased variant enrichment sequencing.
a) A cartoon showing the design of PhasED-Seq. WGS data from DLBCL tumors were aggregated (left), and recurrent PVs were identified (middle). A panel capturing regions recurrently containing PVs was designed (right). The top right panel shows the expected number of PVs / kb for increasing panel sizes. The dashed line shows the selected regions. The bottom right panel shows the median total expected PVs per case for increasing panel sizes. The dark area shows the selected regions. b) A schematic for the use of PhasED-Seq in patients with B-cell malignancies. At time of diagnosis, a tumor or plasma sample, along with matched germline, are sequenced to identify a personalized set of PVs. These PVs can then be tracked in future plasma samples.
Figure 3.
Figure 3.. Validation and application of phased variant enrichment sequencing.
a) Two panels comparing the yield of SNVs (left) and PVs (right) for sequencing tumor and/or cell-free DNA and matched germline by a previously established lymphoma CAPP-Seq panel or PhasED-Seq (2-sided Wilcoxon signed-rank test). PVs include doublet, triplet, and quadruplet phased events. b) Scatterplot showing the frequency and Pearson correlation of PVs in 1000bp bins for patients with DLBCL, identified either by WGS or PhasED-Seq. c) Scatterplots comparing the frequency of PVs by location (in 50bp bins) for subtypes of lymphoma. The colored circles show the frequency of PVs in 50bp bins from a gene of interest; the other (grey) circles show the frequency of PVs in 50bp bins from the remainder of the PhasED-Seq sequencing panel. Statistical testing performed by two-sided Wilcoxon rank sum of all 50bp bins in a given gene against all other bins (Methods). See https://phasedseq.stanford.edu for additional details. d) Volcano plots summarizing the difference in relative frequency of PVs in specific loci between types of lymphoma, including ABC-DLBCL vs. GCB-DLBCL (red, left); PMBCL vs DLBCL (blue, middle); and HL vs. DLBCL (green, right). (Methods).
Figure 4.
Figure 4.. Technical performance of PhasED-Seq.
a) Bar plot showing the performance of hybrid capture sequencing across n=3 replicates for recovery of synthetic 150bp oligonucleotides from two loci (MYC and BCL6, Table S6) with increasing degree of mutation. Data are presented as mean +/- 95% C.I. normalized to the unmutated condition. b) Plot demonstrating the background rate (see Methods) for different sequencing methods from 12 control cfDNA samples. c) Bar plot showing the unique molecular depth of sequencing from n=12 independent cfDNA samples for single-stranded and duplex deduplication, and recovery of PVs of increasing distance between SNVs in-phase. Data are presented as mean +/- S.D. d) Bar plot showing the cumulative fraction of PVs that have a maximal distance between SNVs less than a given number of base pairs.
Figure 5.
Figure 5.. Dilution series to determine detection limits.
a) A limiting dilution series simulating cfDNA containing patient-specific tumor fractions of 1×10⁻³ to 0.5×10⁻⁶; cfDNA from n=3 independent patient samples were used in each dilution. We analyzed the same sequencing data using multiple methods, including iDES-enhanced CAPP-Seq, duplex sequencing, and PhasED-Seq (both for recovery of doublet and triplet molecules). Data presented are the mean and range across the three independent patient samples. The difference between observed and expected tumor fractions for sample < 1:10,000 were compared via paired t-test. *, P<0.05; CAPP-Seq vs duplex, P=3.2e-5; CAPP-Seq vs PhasED-Seq (2x), P=1.1e-4; CAPP-Seq vs PhasED-Seq (3x), P=1.9e-5; duplex vs PhasED-Seq (2x), 0.0047; duplex vs PhasED-Seq (3x), 0.0016. b) Plot demonstrating the background signal of tumor-specific alleles in 12 unrelated control cfDNA samples, and the control cfDNA sample used for limiting dilution series (n=13 total samples). In each sample, we assessed for tumor-specific SNVs or PVs from the 3 patient samples utilized in the limiting dilution experiment, for a total of 39 assessments. Bars represent the mean across all 39 assessments; statistical comparison performed by Wilcoxon rank-sum test. *, P<0.05; CAPP-Seq vs duplex, P=3.7e-8; CAPP-Seq vs PhasED-Seq (2x), P=4.4e-16; CAPP-Seq vs PhasED-Seq (3x), P=2.9e-16; duplex vs PhasED-Seq (2x), 9.0e-6; duplex vs PhasED-Seq (3x), 3.1e-6.
Figure 6.
Figure 6.. Clinical application of PhasED-Seq for ultra-sensitive disease detection and response monitoring in DLBCL.
a) Plot showing ctDNA levels for a patient with DLBCL undergoing first-line therapy measured by both CAPP-Seq and PhasED-Seq. Open circles represent undetectable levels by CAPP-Seq. ND, not detected. b) Univariate scatter plot showing the mean tumor allele fraction of n=98 independent clinical samples measured by PhasED-Seq after 1 or 2 cycles of therapy for DLBCL. The plot is divided by detection with CAPP-Seq; P-value from Wilcoxon rank-sum test. Bars show median and IQR. c) Bar plot showing the fraction of DLBCL patients who are ctDNA+ by CAPP-Seq after 1/2 treatment cycles (red), and the fraction of additional patients ctDNA+ with addition of PhasED-Seq (blue). P-value from Fisher’s Exact Test across 170 total samples. d) Waterfall plot showing the change in CAPP-Seq ctDNA after 2 cycles in DLBCL patients. ND, not detected by CAPP-Seq. e) Kaplan-Meier plot showing the event-free survival (EFS) for 52 DLBCL patients who are ctDNA-negative by CAPP-Seq after 2 cycles. f) Kaplan-Meier plot and two-sided log-rank test showing the EFS of the 52 patients shown in e) stratified by ctDNA detection with PhasED-Seq. g) Kaplan-Meier plot and two-sided log-rank test showing the EFS for 88 patients with DLBCL stratified by ctDNA at cycle 3, day 1 separated into 3 strata – patients failing to achieve a MMR (red), patients achieving MMR with detectable ctDNA by PhasED-Seq and/or CAPP-Seq (grey), and patients with undetectable ctDNA by PhasED-Seq and CAPP-Seq. h) Kaplan-Meier plots and two-sided log-rank test showing EFS for 19 DLBCL patients with >24 months of follow-up stratified by EOT ctDNA detection by CAPP-Seq (left) or PhasED-Seq (right). i) Bar-plots summarizing the performance of ctDNA by CAPP-Seq (top, red) and PhasED-Seq (bottom, blue) at various time-points. True-positives included patients with a new diagnosis of lymphoma pretreatment (n=107), or patients known to have eventual disease progression for detection at cycle 2, cycle 3, or end of therapy (n=22, 24, and 5 respectively). True-negatives are healthy control cfDNAs compared to patient-specific sets of PVs (4280 total tests). * - P < 0.05 for AUC comparison by two-sided DeLong test; cycle 3 P = 0.043; EOT P = 0.022.
Figure 7.
Figure 7.. Extension of PhasED-Seq for disease monitoring to patients with solid tumors.
a) Plot showing the projected detection limit using PVs for ctDNA in cases from PCAWG. This represents the lowest tumor fraction predicted to be detectable with 95% sensitivity, determined by assuming a personalized PhasED-Seq panel and inferring the number of DNA fragments evaluable for tumor content assuming 64ng of input and 20 million sequencing reads (see Methods). The maximum analytical sensitivity is assumed to be 1:2,000,000. Top: case-level data; bars represent median and IQR. Bottom: the fraction of cases with at least 1:50,000 and 1:500,000 sensitivity. The background rate for SNVs is shown at 2e-5 (1 in 50,000). b) A schematic for personalized PhasED-Seq. At the time of diagnosis, tumor and germline WGS are performed to identify a personalized set of PVs. A personalized panel targeting these PVs is then designed. Future cfDNA samples can then be captured and sequenced using this personalized panel. c) The performance of personalized PhasED-Seq across six patients. The top panel shows the background rate of SNVs (squares), duplex SNVs (triangles), or PVs (circles); bars represent median and IQR. The bottom panel shows the lowest detectable tumor fraction for each sample. The background rate for SNVs is shown at 2e-5 and for PVs at 5e-7. d) Comparison between the recovered tumor fraction by CAPP-Seq (x-axis) and PhasED-Seq (y-axis) for all samples from the 6 patients with solid tumors. e) The ctDNA profile of a patient with stage III lung adenocarcinoma (LUP814). The left panel shows the measured tumor fraction in the tumor biopsy, the right panel shows the tumor fraction from cfDNA. While CAPP-Seq fails to detect multiple samples with low-burden MRD, PhasED-Seq successfully measures disease in all samples. The measured tumor volume and representative CT scan images are also shown. f) The ctDNA profile of a patient with stage II breast adenocarcinoma (BRCA001). Samples were banked prior to the diagnosis of breast cancer as part of a biomarker study, including at the time of a CT scan for unrelated disease 12 months prior to diagnosis. At this timepoint, ctDNA is not detected using CAPP-Seq (red), but is detected using PhasED-Seq.

Comment in

Similar articles

Cited by

References

    1. Diehl F et al. Circulating mutant DNA to assess tumor dynamics. Nature medicine 14, 985–990, doi:10.1038/nm.1789 (2008). - DOI - PMC - PubMed
    1. Newman AM et al. Integrated digital error suppression for improved detection of circulating tumor DNA. Nature biotechnology 34, 547–555, doi:10.1038/nbt.3520 (2016). - DOI - PMC - PubMed
    1. Scherer F et al. Distinct biological subtypes and patterns of genome evolution in lymphoma revealed by circulating tumor DNA. Science translational medicine 8, 364ra155, doi:10.1126/scitranslmed.aai8545 (2016). - DOI - PMC - PubMed
    1. Chabon JJ et al. Circulating tumour DNA profiling reveals heterogeneity of EGFR inhibitor resistance mechanisms in lung cancer patients. Nature communications 7, 11815, doi:10.1038/ncomms11815 (2016). - DOI - PMC - PubMed
    1. Bettegowda C et al. Detection of circulating tumor DNA in early- and late-stage human malignancies. Science translational medicine 6, 224ra224, doi:10.1126/scitranslmed.3007094 (2014). - DOI - PMC - PubMed

Publication types

MeSH terms