

Diagnosis of Alzheimer's disease using laser-induced breakdown spectroscopy and machine learning
- PMID: 34295017
- PMCID: PMC8293921
- DOI: 10.1016/j.sab.2020.105931
Diagnosis of Alzheimer's disease using laser-induced breakdown spectroscopy and machine learning
Abstract
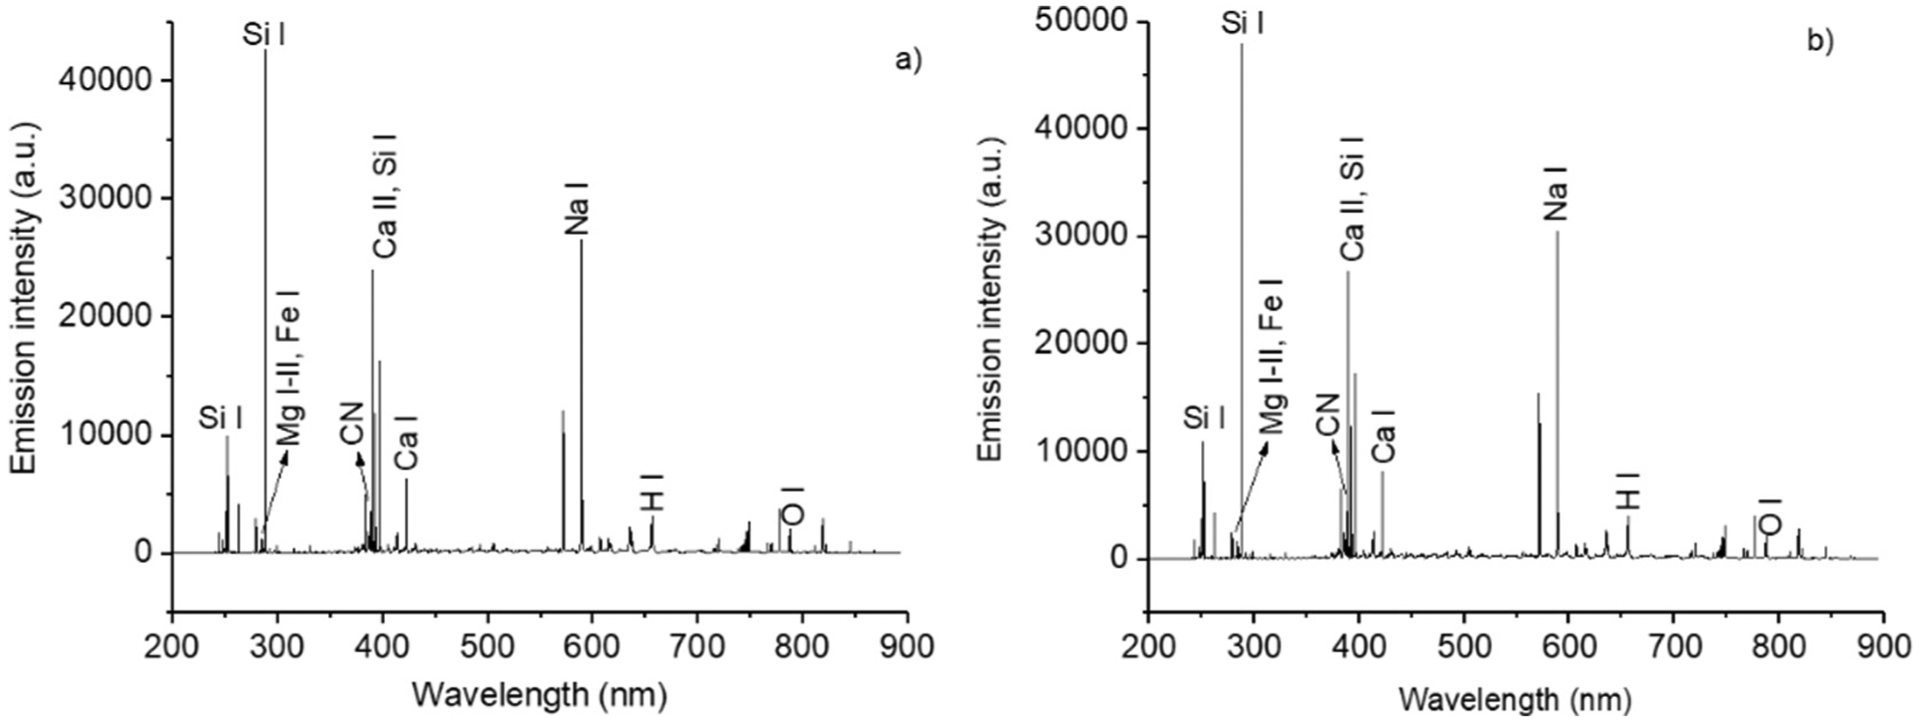
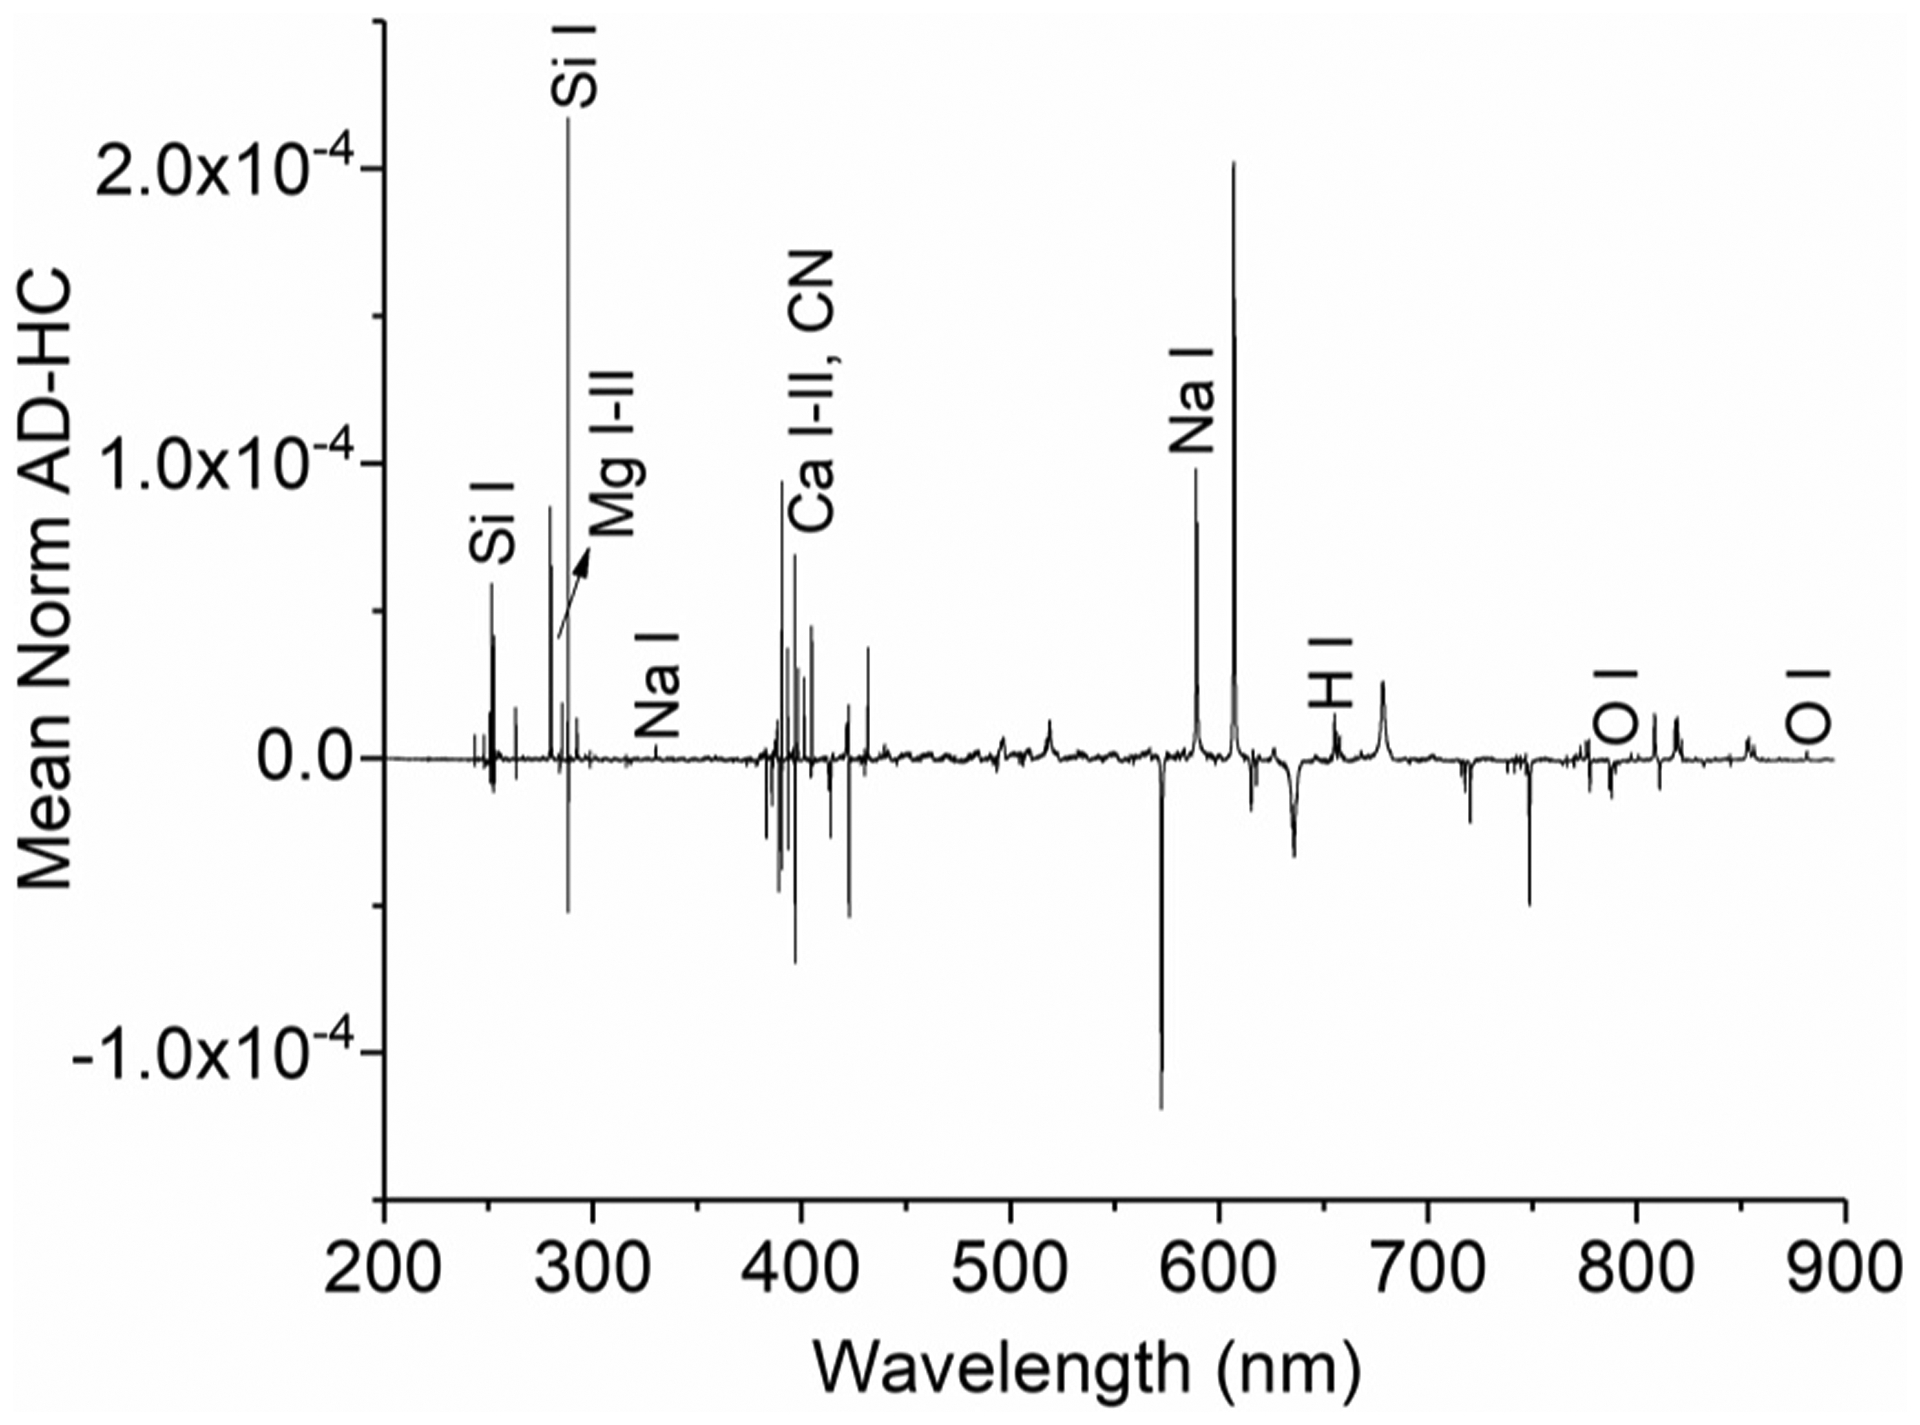
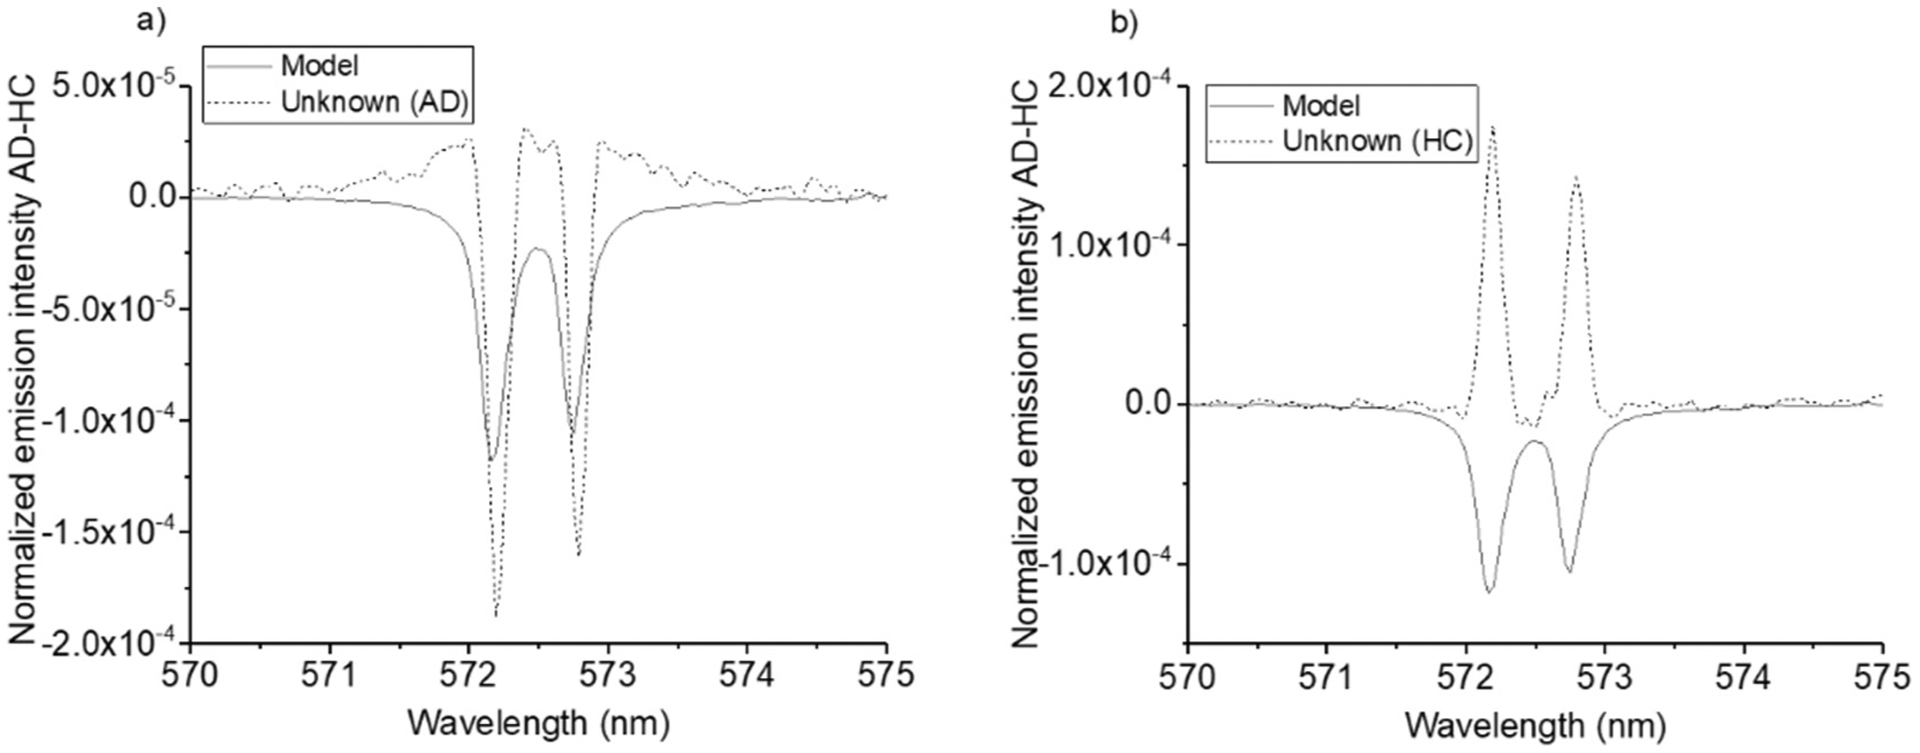
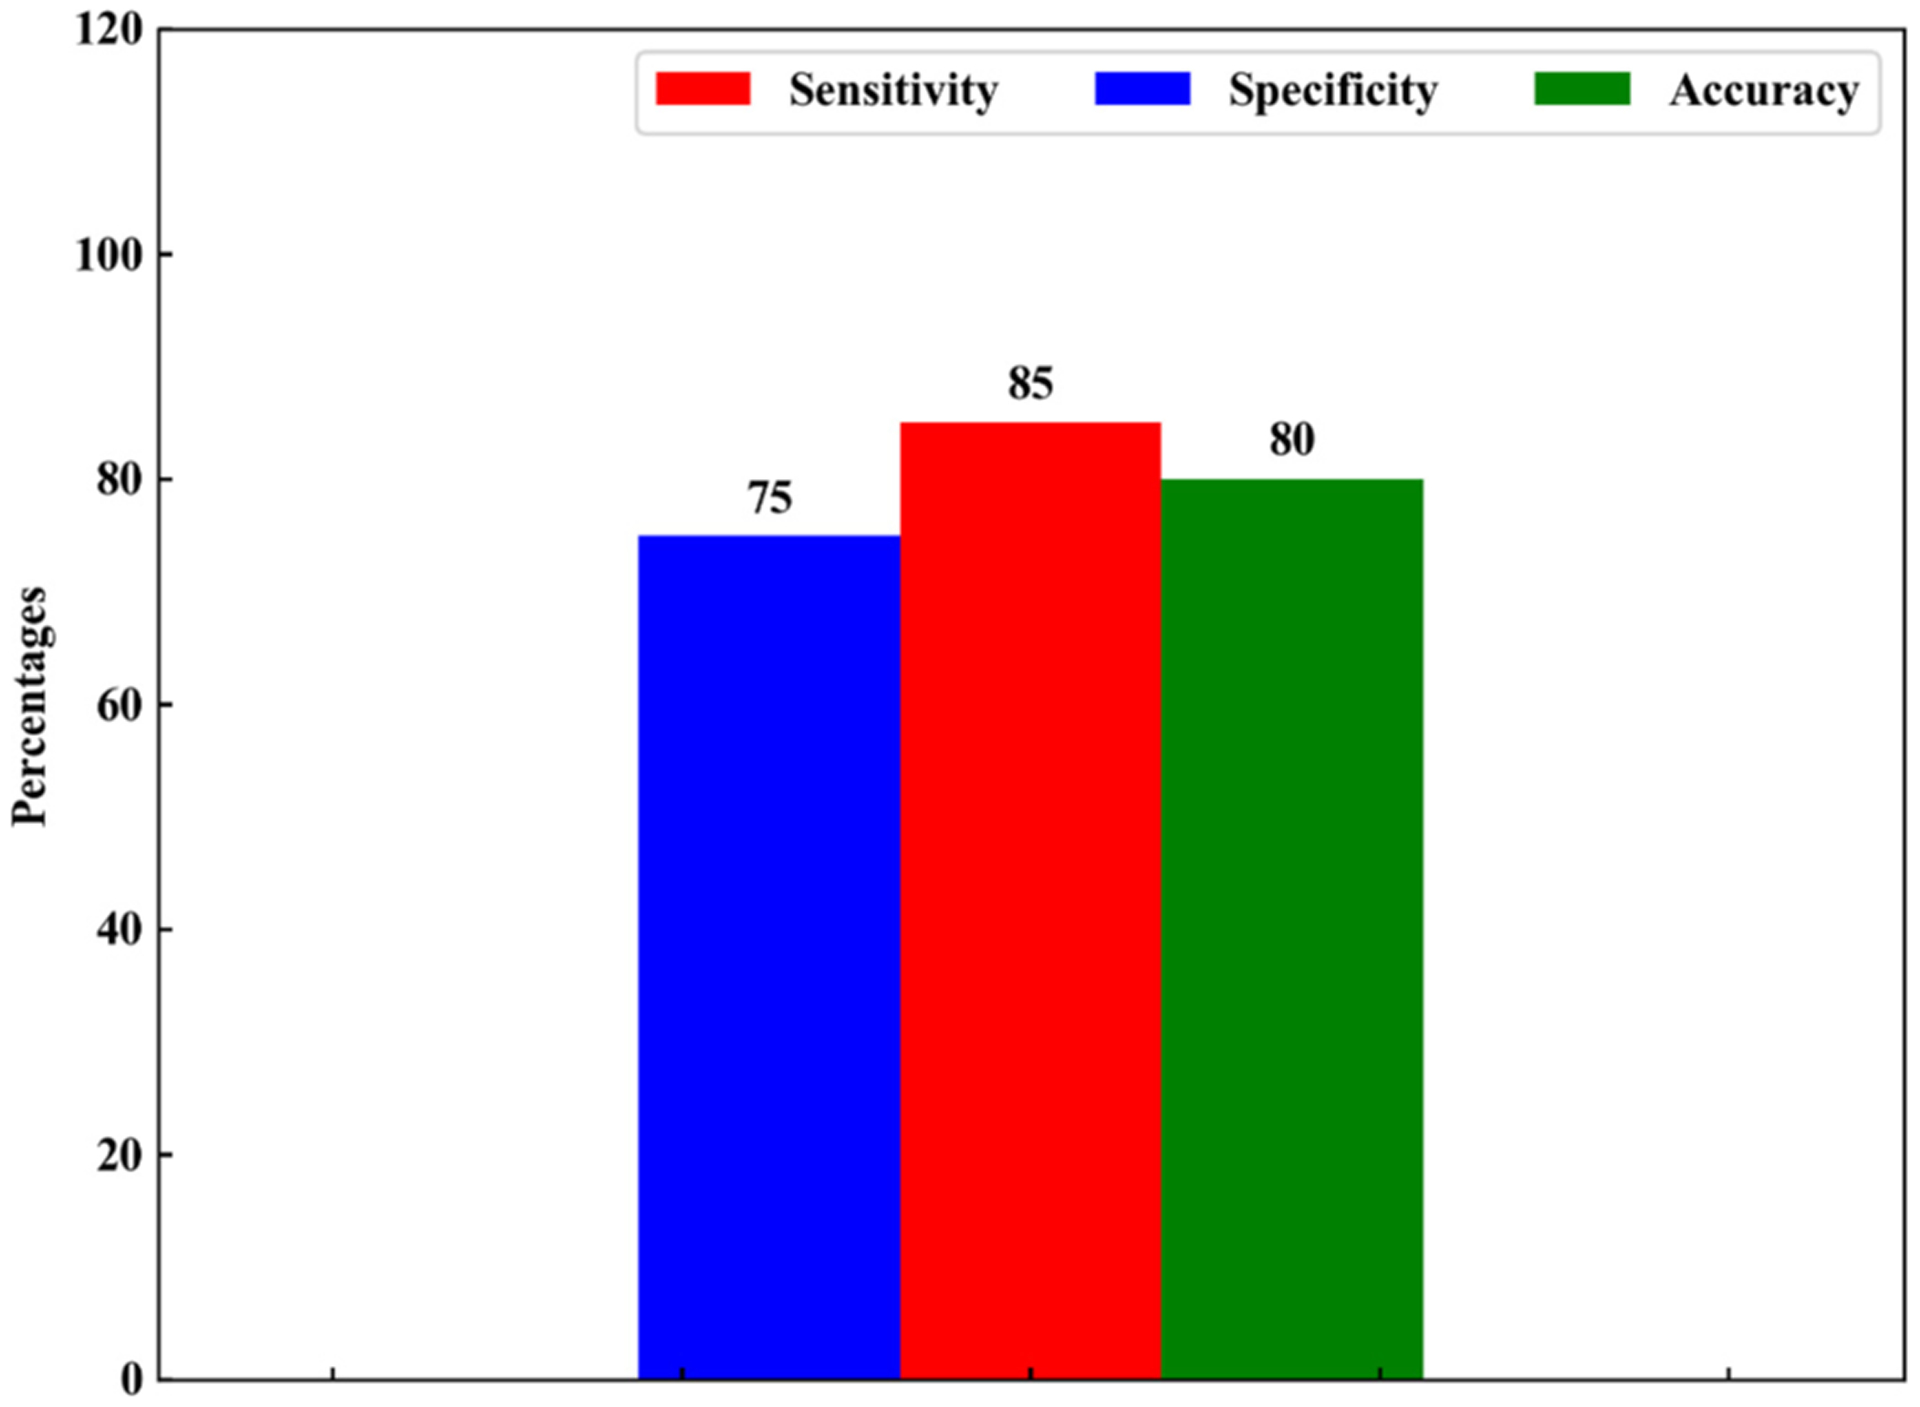
Alzheimer's disease (AD) is a progressive incurable neurodegenerative disease and a major health problem in aging population. We show that the combined use of Laser-Induced Breakdown Spectroscopy (LIBS) and machine learning applied for the analysis of micro-drops of plasma samples of AD and healthy controls (HC) yields robust classification. Following the acquisition of LIBS spectra of 67 plasma samples from a cohort of 31 AD patients and 36 healthy controls (HC), we successfully diagnose late-onset AD (> 65 years old), with a total classification accuracy of 80%, a specificity of 75% and a sensitivity of 85%.
Conflict of interest statement
Declaration of Competing Interest The authors declare no conflicts of interest. The views expressed in this article are those of the authors and do not represent the views of the US Department of Veterans Affairs or the US Government.
Figures
References
-
- Huang C, Isidoro C, Raman spectrometric detection methods for early and non-invasive diagnosis of Alzheimer’s disease, J. Alzheimers Dis 57 (2017) 1145–1156. - PubMed
-
- Olsson B, Lautner R, Andreasson U, Öhrfelt A, Portelius E, Bjerke M, Hölttä M, er Rosén C, Olsson C, Strobel G, Wu E, Dakin K, Petzold M, Blennow K, Zetterberg H, CSF and blood biomarkers for the diagnosis of Alzheimer’s disease: a systematic review and meta-analysis, Lancet Neurol. 15 (2016) 673–684. - PubMed
-
- Radziemski LJ, Cremers DA (Eds.), Laser-induced Plasma and Applications, Marcel Dekker, New York, NY, USA, 1989.
-
- Radziemski LJ, Cremers DA (Eds.), Handbook of Laser-Induced Breakdown Spectroscopy, Second edition, John Wiley & Sons, Ltd, 2013.
Grants and funding
LinkOut - more resources
Full Text Sources