The Transcriptome of Paired Major and Minor Salivary Gland Tissue in Patients With Primary Sjögren's Syndrome
- PMID: 34295332
- PMCID: PMC8291032
- DOI: 10.3389/fimmu.2021.681941
The Transcriptome of Paired Major and Minor Salivary Gland Tissue in Patients With Primary Sjögren's Syndrome
Abstract
Background: While all salivary glands (SGs) can be involved in primary Sjögren's syndrome (pSS), their respective role in pathogenesis remains unclear. Our objective was to assess immunopathway activation in paired parotid and labial gland tissue from biopsy-positive and biopsy-negative pSS and non-SS sicca patients.
Methods: Paraffin-embedded, paired parotid and labial salivary gland tissue and peripheral blood mononuclear cells were obtained from 39 pSS and 20 non-SS sicca patients. RNA was extracted, complementary DNA libraries were prepared and sequenced. For analysis of differentially expressed genes (DEGs), patients were subdivided based on fulfillment of ACR-EULAR criteria and histopathology.
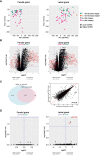
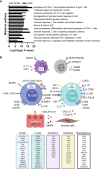
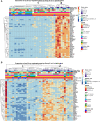
Results: With principal component analysis, only biopsy-positive pSS could be separated from non-SS sicca patients based on SG gene expression. When comparing the transcriptome of biopsy-positive pSS and biopsy-negative non-SS sicca patients, 1235 and 624 DEGs (FDR<0.05, log2FC<-1 or >1) were identified for parotid and labial glands, respectively. The number of DEGs between biopsy-negative pSS and non-SS sicca patients was scarce. Overall, transcript expression levels correlated strongly between parotid and labial glands (R2 = 0.86, p-value<0.0001). Gene signatures present in both glands of biopsy-positive pSS patients included IFN-α signaling, IL-12/IL-18 signaling, CD3/CD28 T-cell activation, CD40 signaling in B-cells, DN2 B-cells, and FcRL4+ B-cells. Signature scores varied considerably amongst pSS patients.
Conclusion: Transcriptomes of paired major and minor SGs in pSS were overall comparable, although significant inter-individual heterogeneity in immunopathway activation existed. The SG transcriptome of biopsy-negative pSS was indistinguishable from non-SS sicca patients. Different patterns of SG immunopathway activation in pSS argue for personalized treatment approaches.
Keywords: B cell abnormalities; Sjogren’s syndrome; T cell activation, salivary gland; autoimmune disease; transcriptome (RNA-seq).
Copyright © 2021 Verstappen, Gao, Pringle, Haacke, van der Vegt, Liefers, Patel, Hu, Mukherjee, Carman, Menard, Spijkervet, Vissink, Bootsma and Kroese.
Conflict of interest statement
LG, YH, and LM are employed at BMS. VP is past employee of BMS and currently employed at Novartis. SM is past employee of BMS and currently employed at GlaxoSmithKline. JC is past employee of BMS and currently employed at Johnson&Johnson. BV is scientific advisory board member of Visiopharm. HB received unrestricted grants from BMS and Roche, is consultant for BMS, Roche, Novartis, Medimmune, Union Chimique Belge, speaker for BMS and Novartis. FK received unrestricted grants from BMS, is consultant for BMS, speaker for BMS, Roche and Janssen-Cilag. The remaining authors declare that the research was conducted in the absence of any commercial or financial relationships that could be construed as a potential conflict of interest.
Figures


References
-
- Shiboski CH, Shiboski SC, Seror R, Criswell LA, Labetoulle M, Lietman TM, et al. . American College of Rheumatology/European League Against Rheumatism Classification Criteria for Primary Sjögren’s Syndrome: A Consensus and Data-Driven Methodology Involving Three International Patient Cohorts. Arthritis Rheumatol (2017) 69:35–45. doi: 10.1002/art.39859 - DOI - PMC - PubMed
-
- Kroese FGM, Haacke EA, Bombardieri M. The Role of Salivary Gland Histopathology in Primary Sjögren’s Syndrome: Promises and Pitfalls - PubMed. Clin Exp Rheum (2018) 36:222–33. - PubMed
Publication types
MeSH terms
Substances
LinkOut - more resources
Full Text Sources
Medical
Molecular Biology Databases
Research Materials

