Comparative Study
. 2021 Jul;10(9):e12121.
doi: 10.1002/jev2.12121. Epub 2021 Jul 15.

Extracellular vesicle miRNA predict FDG-PET status in patients with classical Hodgkin Lymphoma

Affiliations
Comparative Study

Extracellular vesicle miRNA predict FDG-PET status in patients with classical Hodgkin Lymphoma

Esther E E Drees et al. J Extracell Vesicles. 2021 Jul.

Abstract

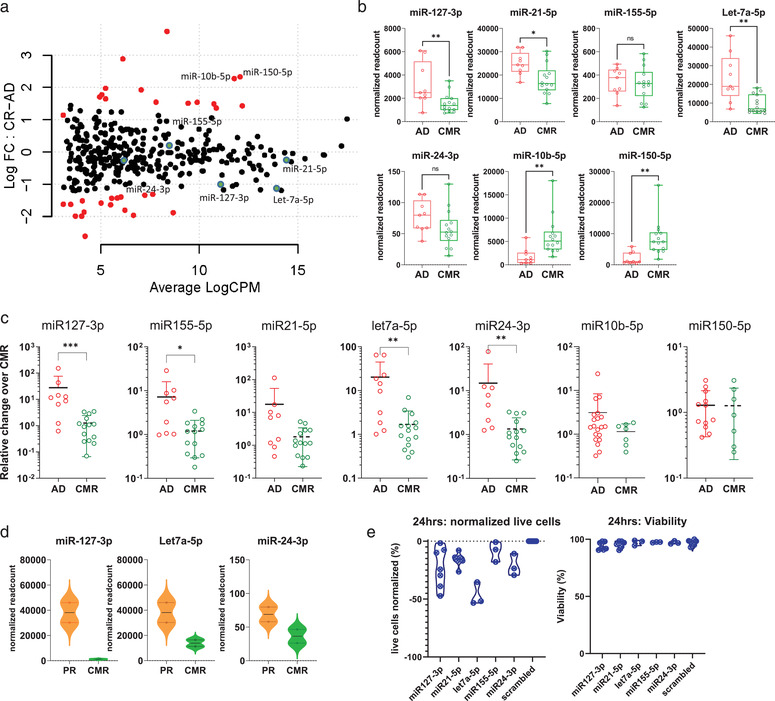
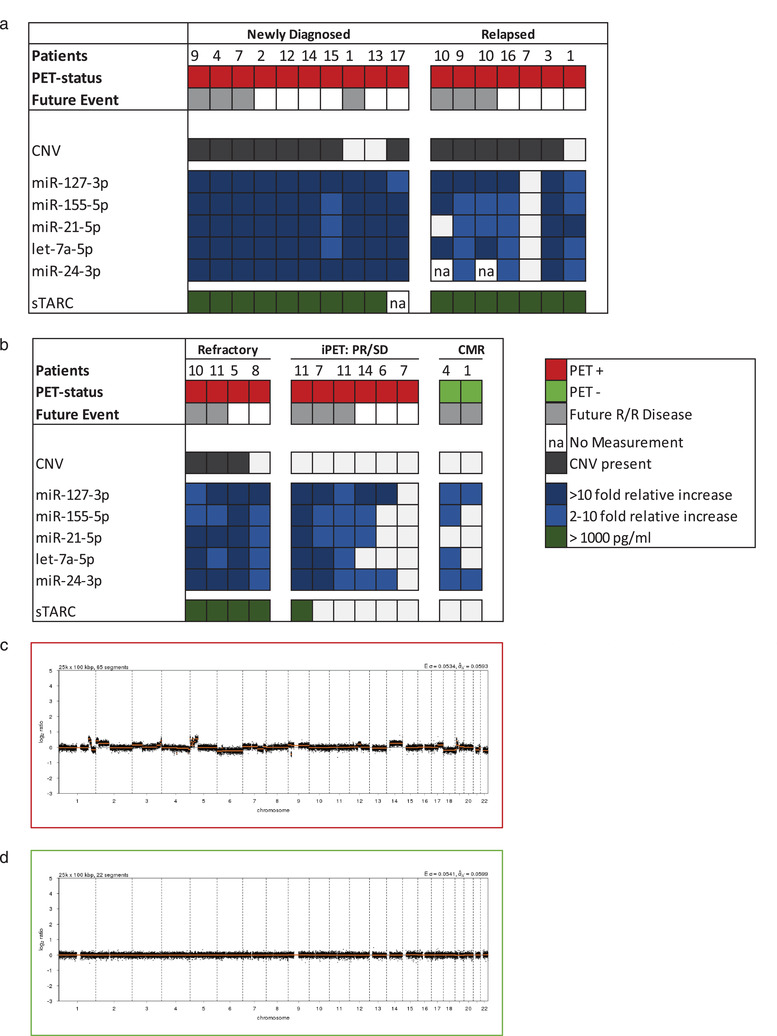
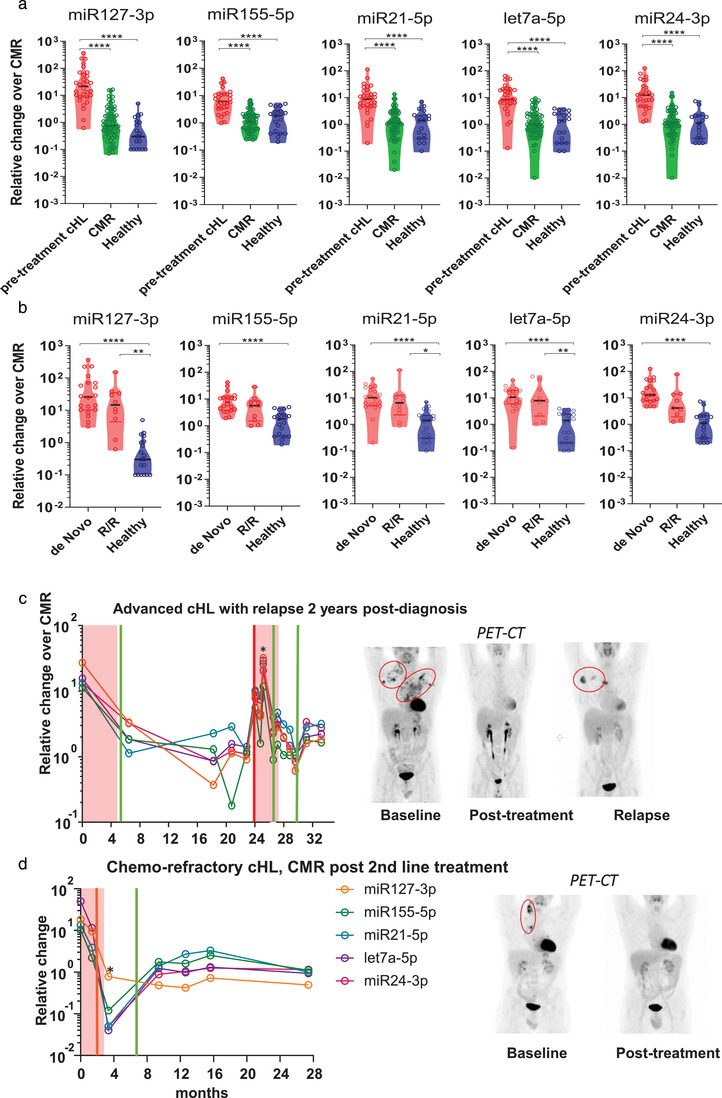
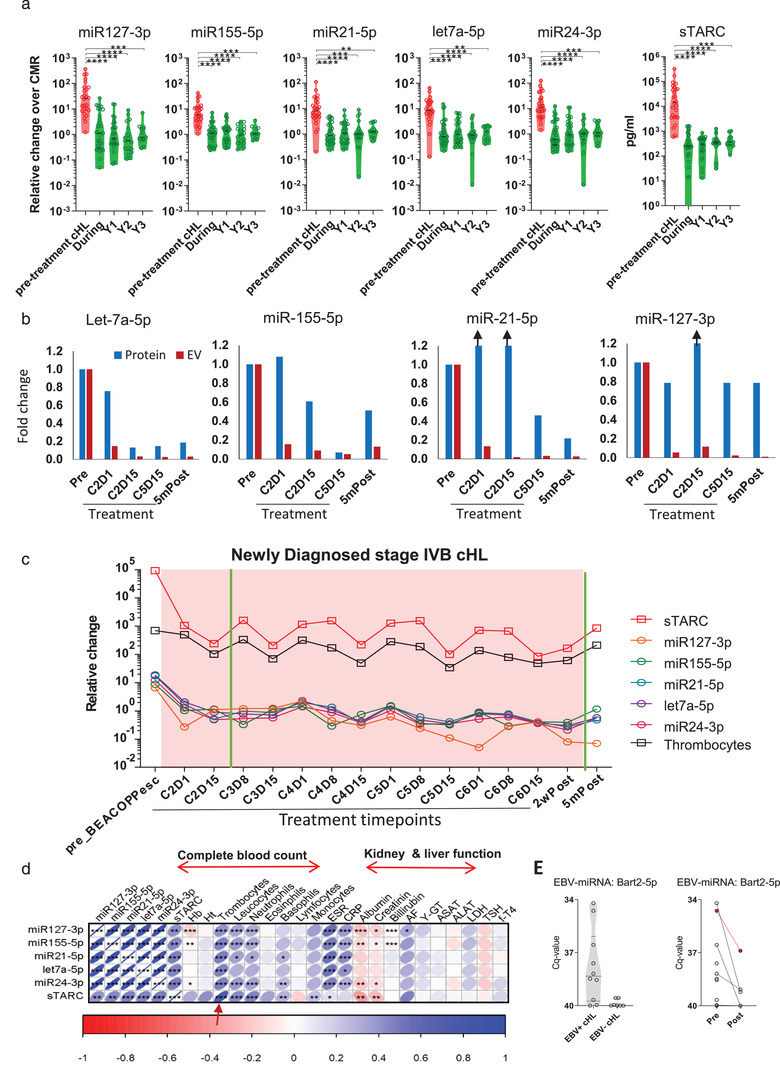
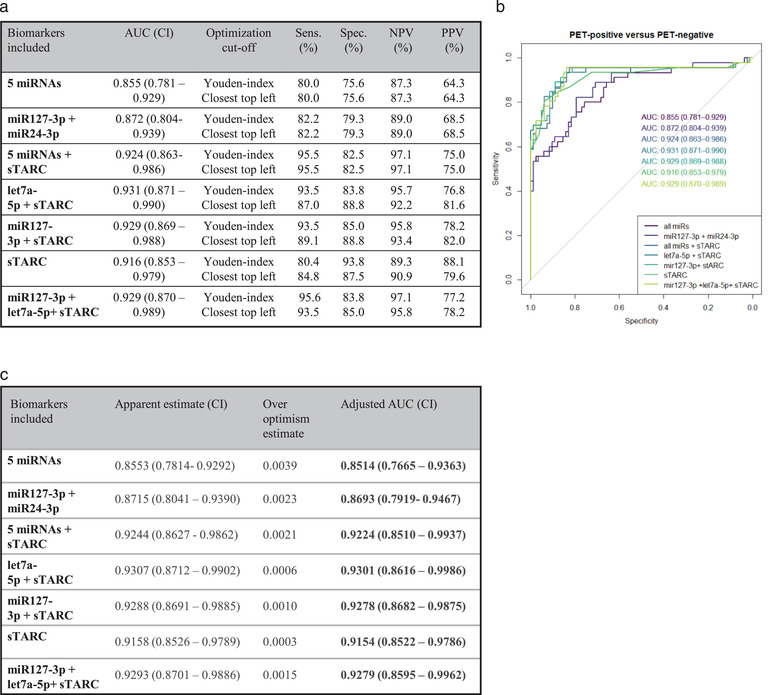
Minimally-invasive tools to assess tumour presence and burden may improve clinical management. FDG-PET (metabolic) imaging is the current gold standard for interim response assessment in patients with classical Hodgkin Lymphoma (cHL), but this technique cannot be repeated frequently. Here we show that microRNAs (miRNA) associated with tumour-secreted extracellular vesicles (EVs) in the circulation of cHL patients may improve response assessment. Small RNA sequencing and qRT-PCR reveal that the relative abundance of cHL-expressed miRNAs, miR-127-3p, miR-155-5p, miR-21-5p, miR-24-3p and let-7a-5p is up to hundred-fold increased in plasma EVs of cHL patients pre-treatment when compared to complete metabolic responders (CMR). Notably, in partial responders (PR) or treatment-refractory cases (n = 10) the EV-miRNA levels remain elevated. In comparison, tumour specific copy number variations (CNV) were detected in cell-free DNA of 8 out of 10 newly diagnosed cHL patients but not in patients with PR. Combining EV-miR-127-3p and/or EV-let-7a-5p levels, with serum TARC (a validated protein cHL biomarker), increases the accuracy for predicting PET-status (n = 129) to an area under the curve of 0.93 (CI: 0.87-0.99), 93.5% sensitivity, 83.8/85.0% specificity and a negative predictive value of 96%. Thus the level of tumour-associated miRNAs in plasma EVs is predictive of metabolic tumour activity in cHL patients. Our findings suggest that plasma EV-miRNA are useful for detection of small residual lesions and may be applied as serial response prediction tool.

Keywords: Hodgkin lymphoma; blood; extracellular vesicles; liquid biopsy; miRNA; response monitoring.


Conflict of interest statement

Dirk Michiel Pegtel and Michael Hackenberg are co‐founders of Exbiome BV. Dirk Michiel Pegtel is CSO of ExBiome BV and has received travel compensation from Takeda.

Figures

FIGURE 1
FIGURE 1
plasma EV miRNAs as determined by small RNAseq and qRT‐PCR distinguish cHL patients with active disease from complete responders. (a) Mapplot of differential expression analysis comparing active disease samples (pre‐treatment plus partial responders) (= 9) to complete responders (= 10). On the y‐axis the normalized log fold change (log FC) is shown and on the x‐axis the average log count per million (CPM, i.e. normalized read counts). Each dot is a miRNA in the analysis. Red dots are significantly differently miRNAs. The green dots highlight the five candidate miRNAs. (b) Normalized read counts per EV‐miRNAs as determined by RNAseq. AD = active disease which is defined as FDG‐PET positive cHL, including partial responders (n = 9). CMR = complete metabolic response (n = 14). Every point is a single sample. Boxes show the 25%–75% percentile; whiskers show the minimum‐maximum; and lines represent the median. *< 0.05, ** P < 0.01, *** < 0.001, **** < 0.0001 (Mann Whitney test). (c) qRT‐PCR of miR‐127‐3p, miR‐155‐5p, miR‐21‐5p, Let‐7a‐5p, miR‐24‐3p, miR‐10b‐5p and miR‐150‐5p cHL patients samples. For the qRT‐PCR plot of miR‐127‐3p, miR‐155‐5p, miR‐21‐5p, Let‐7a‐5p, miR‐24‐3p, active disease samples (n = 9), complete metabolic responders (= 14) are depicted. For miR‐150‐5p: Active disease (n = 12), complete metabolic responders (= 8). For miR10‐5p: Active disease (n = 20), complete metabolic responders (= 7). *< 0.05, ** P < 0.01, *** < 0.001, **** < 0.0001 (Mann Whitney test). Relative change is the qRT‐PCR normalized to the mean of the CMR‐group. (d) Normalized read counts from the plasma samples at time at interim‐PET. CMR = complete metabolic response and PR = partial response. (e) Cell count and viability data from KMH2 cell line electroporated with miRNA‐zippers, 24 h post electroporation. miRNA target of the zipper depicted on the x‐axis. In the first plot, the absolute live cell counts at 24 h normalized to the live cell count of the negative control are depicted on the Y‐axis in percentages. Every point is the mean of the two technical replicates of one experiment. Viability is the percentage of live cells divided by the total amount of cells present.
FIGURE 2
FIGURE 2
EV‐miRNAs and sTARC outperform CNV detection in cfDNA for blood‐based cHL detection. Overview of the matched analyses of copy‐number variations (CNV), EV‐miRNAs and sTARC in 29 samples from 17 cHL patients in (a) and (b). (a) Depicts the pre‐treatment samples from newly‐diagnosed or relapsed cHL patients and (b) depict the during and post‐treatment samples. Colour legend is depicted in the figure. (c) Copy number profile of cHL patient, analysed using QDNAseq. On the x‐axis the different chromosomes are depicted, and on the y‐axis the normalized log2 ratio is shown. This is a representative example of a profile scored positive. (d) Copy number profile of cHL patient, analysed using QDNAseq. On the x‐axis the different chromosomes are depicted, and on the y‐axis the normalized log2 ratio is shown. This is a representative example of a profile scored negative. In figure (a) and (b) a negative profile is depicted as a white box.
FIGURE 3
FIGURE 3
EV‐miRNAs stably differentiate FDG‐PET active cHL patients from complete responders and healthy donors. (a) qRT‐PCR analysis of EV‐associated miR‐127‐3p, miR‐155‐5p, miR‐21‐5p, Let‐7a‐5p, miR‐24‐3p in FDG‐PET active cHL samples prior to treatment (n = 30) versus post treatment complete metabolic responders (= 66) and healthy donors (= 19). Each point in violin plot is an sample, horizontal black line is the median. Relative change is the qRT‐PCR normalized to the mean of the CMR‐group. *< 0.05, ** P < 0.01, *** < 0.001, **** < 0.0001 (Kruskall Wallis test). (b) qRT‐PCR of miR‐127‐3p, miR‐155‐5p, miR‐21‐5p, Let‐7a‐5p and miR‐24‐3p in newly diagnosed cHL patients (= 20) versus relapsed and/or refractory (R/R) patients pre‐treatment (= 10) and healthy donors (= 19). Each point in violin plot is an sample, horizontal black line is the median. Relative change is the qRT‐PCR normalized to the mean of the CMR‐group. (c) EV‐miRNA levels (measured by qRT‐PCR) in longitudinally collected samples of a newly diagnosed cHL patient who presented with advanced stage and relapsed 24 months after inclusion and first‐line treatment. The asterisks depict a timepoint where the patient was hospitalized with neutropenic fever and symptoms of respiratory tract infection. (d) EV‐miRNA levels (measured by qRT‐PCR) in longitudinally collected samples of a cHL patient who presented with refractory disease during first‐line treatment as in (c). The sample with an asterisk is taken 14 days post BEAM and autologous stem cell transplantation. Image panels depicts the FDG‐PET data in Maximum intensity Projections (MIPs). The red boxes in the graphs (c) and (d) depict the treatment phase(s). The x‐axis depicts the time in months after inclusion. The vertical green lines in the graphs depict the timepoint where the patient has no disease activity based on PET‐CT. Vertical orange line is a timepoint in where the patient has a partial response on PET‐CT and the red line is the moment in where PET‐CT shows a relapse.
FIGURE 4
FIGURE 4
EV‐miRNAs of complete responders decrease early during treatment and are indistinguishable from post‐treatment levels. (a) qRT‐PCR of miR‐127‐3p, miR‐155‐5p, miR‐21‐5p, let‐7a‐5p, miR‐24‐3p and sTARC analysis by ELISA for cHL patient samples pre‐treatment (= 30), during treatment samples from complete responders (during), and year 1 through 3 (Y1‐3) post‐treatment follow up samples. Line represents the mean and upper whisker is the standard deviation. Relative change is the qRT‐PCR normalized to the mean of the CMR‐group. * < 0.05, ** < 0.01, *** < 0.001, **** < 0.0001 (Kruskall‐Wallis test). (b) qRT‐PCR of miR‐127‐3p, miR‐155‐5p, miR‐21‐5p and let‐7a‐5p on the size exclusion chromatography EV‐ and protein‐fractions. Different timepoints from the same patient are analysed. The bars depict the log‐fold change in respect to the pre‐treatment sample. Black arrows depict samples which are higher than 1.2 fold change. Full graph of this patient is shown in Supplementary Figure 4. C = treatment cycle, D = day. (c) Longitudinal EV‐miRNA and sTARC profile of an advanced stage, newly diagnosed cHL patient who receives six cycles of BEACOPPesc. The red boxes depict the phase in where the patient receive treatment. The y‐axis depicts the time in months after inclusion. The x‐axis for sTARC is pg/ml and for thrombocytes 109/litre. The vertical green lines in the graph depict the timepoint in where patient showed no FDG‐activity on PET‐CT. (d) Correlation matrix of qRT‐PCR miRNAs and sTARC data versus laboratory parameters measured at the same day of blood draw. Number of samples per correlation are depicted in supplemental Table 11. Hb = haemoglobin; Ht = haematocrit. (e) qRT‐PCR analysis of EBV‐miRNA Bart2‐5p in plasma (protein‐fraction) of pre‐treatment cHL samples (left). qRT‐PCR analysis of Bart2‐5p pre‐ (= 8) and post‐treatment (n = 7) in EBV+ cHL (right). The patient in red is diagnosed with a relapse 1 year after the post‐treatment sample.
FIGURE 5
FIGURE 5
EV‐miRNAs correctly classify FDG‐PET status in cHL patients and has potential for individual therapy response monitoring. (a) Table with the Area Under de Curve (AUC), sensitivity (Sens.), specificity (Spec.), negative predictive value (NPV) and positive predictive value (PPV) of the Generalized linear mixed effect models (GLMEM) as depicted in (b). Cut‐off to determine sensitivity and specificity is done using a Youden‐index or closest‐top‐left calculation. (B) ROC curve generated by GLMEM on 129 cHL samples pre‐, during and post‐treatment. (c) Bootstrap validation of GLMEM models, over optimism estimate and adjusted AUC are depicted in this table. CI = confidence interval.

References

    1. Adams, H. J. A. , Nievelstein, R. A. J. , & Kwee, T. C. (2015). Prognostic value of interim FDG‐PET in Hodgkin lymphoma: Systematic review and meta‐analysis. British Journal of Haematology, 170(3), 356–366. - PubMed
    1. Amant, F. , Verheecke, M. , Wlodarska, I. , Dehaspe, L. , Brady, P. , Brison, N. , Van Den Bogaert, K. , Dierickx, D. , Vandecaveye, V. , Tousseyn, T. , Moerman, P. , Vanderstichele, A. , Vergote, I. , Neven, P. , Berteloot, P. , Putseys, K. , Danneels, L. , Vandenberghe, P. , Legius, E. , & Vermeesch, J. R. (2015). Presymptomatic Identification of Cancers in Pregnant Women During Noninvasive Prenatal Testing. JAMA Oncology, 1(6), 814–819. 10.1001/jamaoncol.2015.1883. - DOI - PubMed
    1. Anfossi, S. , Babayan, A. , Pantel, K. , & Calin, G. A. (2018). Clinical utility of circulating non‐coding RNAs — an update. Nature Reviews Clinical Oncology, 15(9), 541–563. - PubMed
    1. Aparicio‐Puerta, E. , Lebrón, R. , Rueda, A. , Gómez‐Martín, C. , Giannoukakos, S. , Jaspez, D. , Medina, J. M. , Zubkovic, A. , Jurak, I. , Fromm, B. , Marchal, J. A. , Oliver, J. , & Hackenberg, M. (2019). sRNAbench and sRNAtoolbox 2019: Intuitive fast small RNA profiling and differential expression. Nucleic Acids Research, 47(W1), W530–W535. - PMC - PubMed
    1. Barturen, G. , Rueda, A. , Hamberg, M. , Alganza, A. , Lebron, R. , Kotsyfakis, M. , Shi, B.‐J. , Koppers‐Lalic, D. , & Hackenberg, M. (2014). sRNAbench: profiling of small RNAs and its sequence variants in single or multi‐species high‐throughput experiments. Methods in Next Generation Sequencing, 1(1), 10.2478/mngs-2014-0001. - DOI

Publication types