

Comparative Study on Temperature Response of Hydropower Development in the Dry-Hot Valley
- PMID: 34296051
- PMCID: PMC8285752
- DOI: 10.1029/2021GH000438
Comparative Study on Temperature Response of Hydropower Development in the Dry-Hot Valley
Abstract
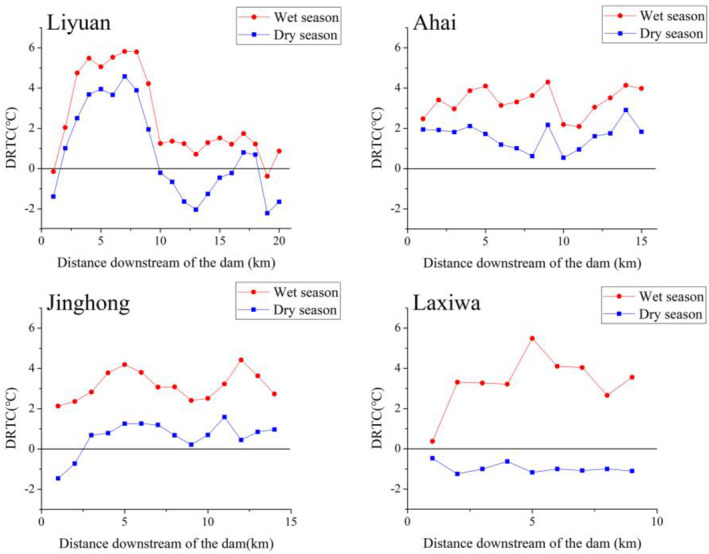
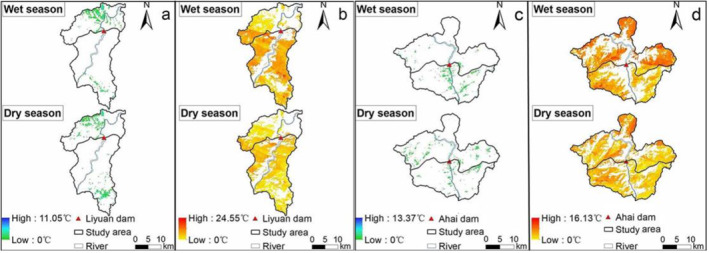
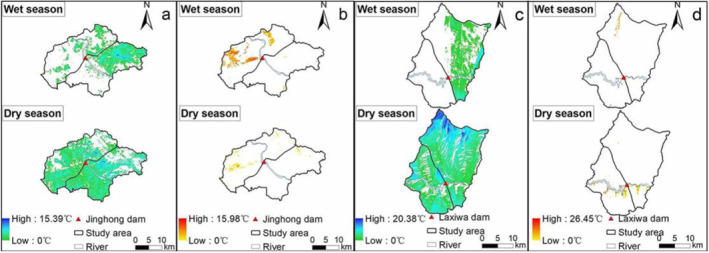
Due to the specific hydrothermal conditions of dry-hot valleys, temperature changes caused by the development of large-scale hydropower projects may be more extreme than they are in other regions. In this study, we analyzed these temperature changes at four hydropower stations in both dry-hot and non-dry-hot valleys. Based on the calculated relative temperatures of the downstream river and the areas surrounding the reservoirs, we employed two indices to quantify the influence of the reservoirs on the temperatures of these two regions: the downstream river temperature change and the reservoir effect change intensity. Our results are as follows: (a) In the downstream rivers, the temperature regulation effect was more pronounced in the wet season; in the regions surrounding the reservoirs, the temperature regulation effect was more pronounced in the dry season. (b) The downstream river temperature in both the dry-hot and wet-hot valleys exhibited noticeable warming in both the wet and dry seasons, while the cold-dry valley was characterized by cooling in the dry season and warming in the wet season. With the exception of the Liyuan station (where the influence of the reservoir on the downstream temperatures only extended to a distance of 9 km from the dam) during the dry season, the existence of the hydropower stations affected the temperatures of the entire downstream region. (c) For the areas surrounding the reservoir, the presence of a hydropower station mainly caused the temperatures in the dry-hot valleys to rise and the temperatures in the non-dry-hot valleys to decrease.
Keywords: comparative study; downstream river temperature change; dry‐hot valley; relative temperature; reservoir effect change intensity.
© 2021. The Authors. GeoHealth published by Wiley Periodicals LLC on behalf of American Geophysical Union.
Conflict of interest statement
The authors declare no conflict of interest. The founding sponsors had no role in the design of the study; in the collection, analysis, or interpretation of data; in the writing of the manuscript; or in the decision to publish the results.
Figures
Similar articles
-
Spatial-temporal distribution and transport flux of polycyclic aromatic hydrocarbons in a large hydropower reservoir of Southeast China: Implication for impoundment impacts.Environ Pollut. 2020 Feb;257:113603. doi: 10.1016/j.envpol.2019.113603. Epub 2019 Nov 9. Environ Pollut. 2020. PMID: 31767238
-
Determining the limiting water level of early flood season by combining multiobjective optimization scheduling and copula joint distribution function: A case study of three gorges reservoir.Sci Total Environ. 2020 Oct 1;737:139789. doi: 10.1016/j.scitotenv.2020.139789. Epub 2020 May 30. Sci Total Environ. 2020. PMID: 32526576
-
Realizing ecosystem-safe hydropower from dams.Renew Wind Water Sol. 2020;7(1):2. doi: 10.1186/s40807-020-00060-9. Epub 2020 Jun 1. Renew Wind Water Sol. 2020. PMID: 32647609 Free PMC article.
-
Future changes in Yuan River ecohydrology: Individual and cumulative impacts of climates change and cascade hydropower development on runoff and aquatic habitat quality.Sci Total Environ. 2018 Aug 15;633:1403-1417. doi: 10.1016/j.scitotenv.2018.03.309. Epub 2018 Apr 3. Sci Total Environ. 2018. PMID: 29758893
-
Transboundary river basins: Scenarios of hydropower development and operation under extreme climate conditions.Sci Total Environ. 2022 Jan 10;803:149828. doi: 10.1016/j.scitotenv.2021.149828. Epub 2021 Aug 23. Sci Total Environ. 2022. PMID: 34500272
Cited by
-
A Preliminary Study on the Whole-Plant Regulations of the Shrub Campylotropis polyantha in Response to Hostile Dryland Conditions.Metabolites. 2024 Sep 13;14(9):495. doi: 10.3390/metabo14090495. Metabolites. 2024. PMID: 39330502 Free PMC article.
References
-
- Cai, H. , Piccolroaz, S. , Huang, J. , Liu, Z. , Liu, F. , & Toffolon, M. (2018). Quantifying the impact of the Three Gorges Dam on the thermal dynamics of the Yangtze River. Environmental Research Letters, 13(5), 054016. 10.1088/1748-9326/aab9e0 - DOI
-
- Degu, A. M. , Hossain, F. , Niyogi, D. , Pielke, R. , Shepherd, J. M. , Voisin, N. , & Chronis, T. (2011). The influence of large dams on surrounding climate and precipitation patterns. Geophysical Research Letters, 38(4). 10.1029/2010gl046482 - DOI
-
- Du, C. , Ren, H. , Qin, Q. , Meng, J. , & Li, J. (2014). Split‐window algorithm for estimating land surface temperature from Landsat 8 TIRS data. IEEE Geoscience and Remote Sensing Symposium, 2014, 3578–3581. 10.1109/igarss.2014.6947256 - DOI
-
- Duan, X. , Zhang, G. , Rong, L. , Fang, H. , He, D. , & Feng, D. (2015). Spatial distribution and environmental factors of catchment‐scale soil heavy metal contamination in the dry‐hot valley of Upper Red River in southwestern China. CATENA, 135, 59–69. 10.1016/j.catena.2015.07.006 - DOI
Associated data
LinkOut - more resources
Full Text Sources