. 2021 Jul 20;3(3):lqab065.
doi: 10.1093/nargab/lqab065. eCollection 2021 Sep.

DeepCOMBI: explainable artificial intelligence for the analysis and discovery in genome-wide association studies

Affiliations

DeepCOMBI: explainable artificial intelligence for the analysis and discovery in genome-wide association studies

Bettina Mieth et al. NAR Genom Bioinform. .

Abstract

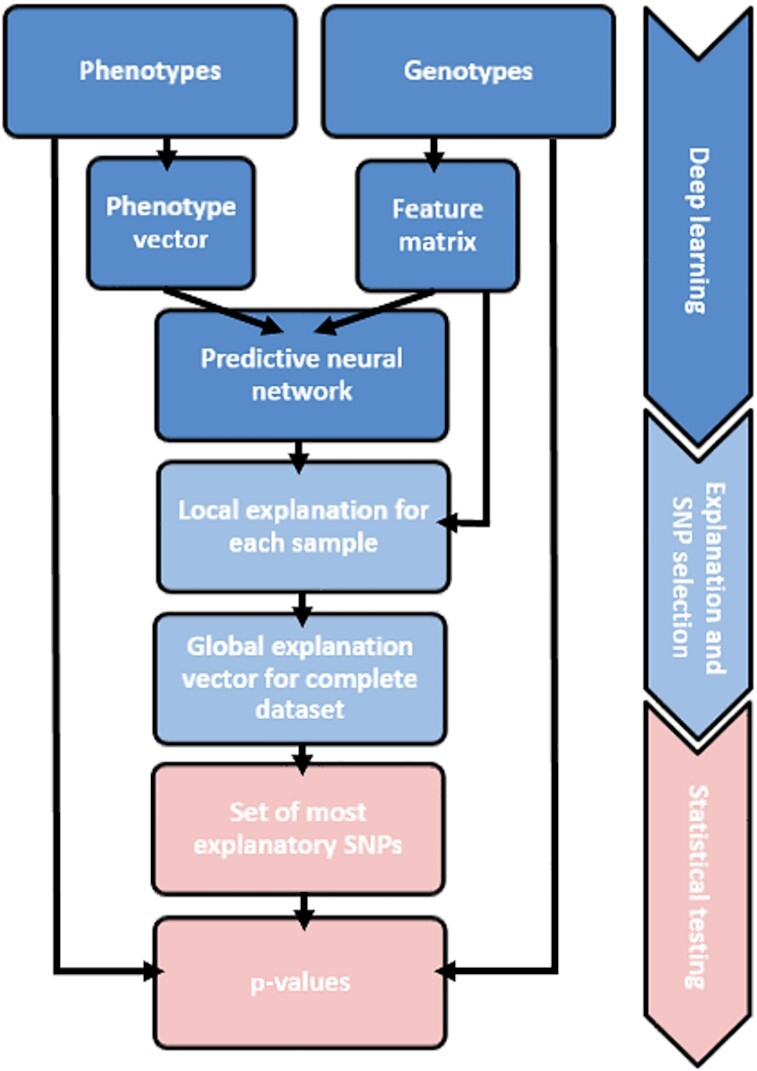
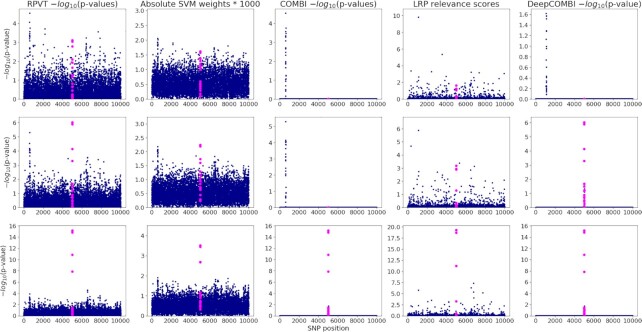
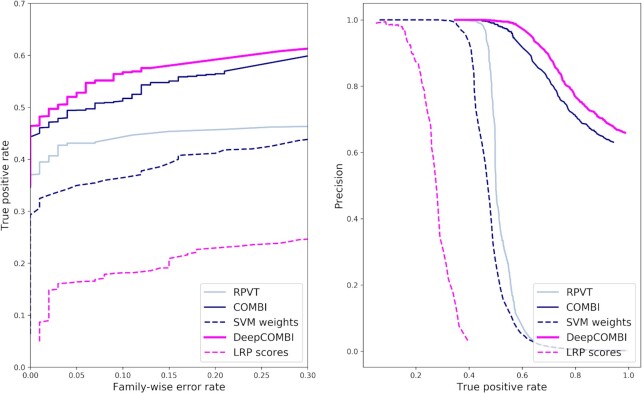
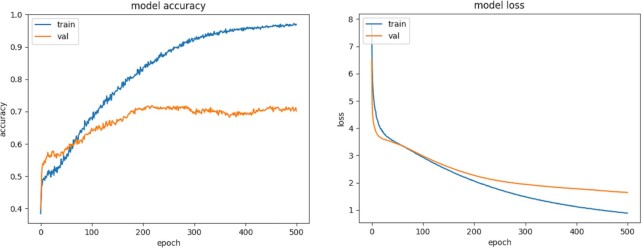
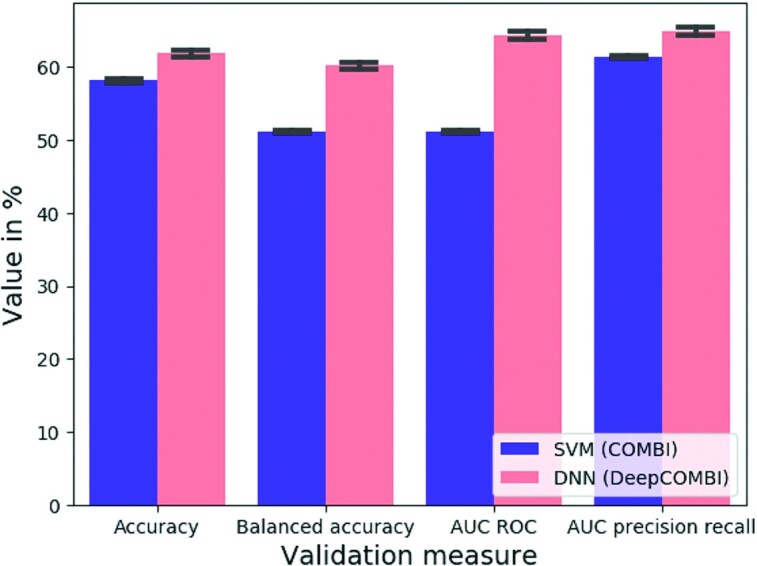
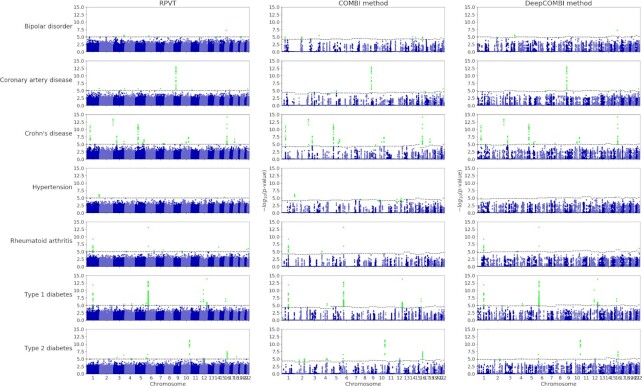
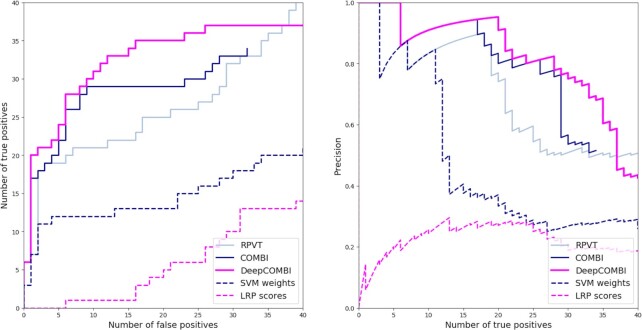
Deep learning has revolutionized data science in many fields by greatly improving prediction performances in comparison to conventional approaches. Recently, explainable artificial intelligence has emerged as an area of research that goes beyond pure prediction improvement by extracting knowledge from deep learning methodologies through the interpretation of their results. We investigate such explanations to explore the genetic architectures of phenotypes in genome-wide association studies. Instead of testing each position in the genome individually, the novel three-step algorithm, called DeepCOMBI, first trains a neural network for the classification of subjects into their respective phenotypes. Second, it explains the classifiers' decisions by applying layer-wise relevance propagation as one example from the pool of explanation techniques. The resulting importance scores are eventually used to determine a subset of the most relevant locations for multiple hypothesis testing in the third step. The performance of DeepCOMBI in terms of power and precision is investigated on generated datasets and a 2007 study. Verification of the latter is achieved by validating all findings with independent studies published up until 2020. DeepCOMBI is shown to outperform ordinary raw P-value thresholding and other baseline methods. Two novel disease associations (rs10889923 for hypertension, rs4769283 for type 1 diabetes) were identified.


Figures

Figure 1.
Figure 1.
Overview of the DeepCOMBI method. Receiving genotypes and phenotypes of a GWAS as input, the DeepCOMBI method first applies a deep learning step to train a DNN for the classification of subjects. Afterward, in the explanation step, it selects the most relevant SNPs by applying LRP to calculate relevance scores for each SNP. Finally, for this set of most relevant SNPs, DeepCOMBI calculates P-values and corresponding significance thresholds in a statistical testing step. This figure is an adjusted version of Figure 1 presented by Mieth et al. (31).
Figure 2.
Figure 2.
Three exemplary generated datasets and the corresponding COMBI and DeepCOMBI results. We present the results of three exemplary replications: one with weak (first row), one with medium (second row) and one with strong (third row) association of the 20 informative SNPs at position 5001–5020 (highlighted in all subfigures). Standard RPVT P-values are plotted in the first column of subfigures. Absolute SVM weights and corresponding P-values of the COMBI method are shown in the second and third columns. Finally, LRP relevance scores and the corresponding P-values of DeepCOMBI are presented in the fourth and last column.
Figure 3.
Figure 3.
ROC and PR curves of DeepCOMBI and all competitor methods on generated datasets. Performance curves of all methods averaged over the 1000 generated datasets are shown. ROC curves are presented on the left and PR curves on the right side.
Figure 4.
Figure 4.
Training and validation metrics on an exemplary WTCCC dataset. Evolution of model metrics during DNN training on Crohn’s disease chromosome 3 dataset in 500 epochs. Model accuracy on both training and validation datasets is shown on the left and model loss (also on training and validation data) on the right.
Figure 5.
Figure 5.
Classification performance on WTCCC data. Mean validation measures of SVM (as in the first step of COMBI) and DNN (as in the first step of DeepCOMBI) averaged over all diseases and chromosomes are given with standard deviation. All datasets were split into 80% training and 20% validation data.
Figure 6.
Figure 6.
Manhattan plots for WTCCC data. The negative logarithmic formula imagetest P-values are plotted against position on each chromosome for all seven diseases. Results from the standard RPVT approach, the COMBI method and the DeepCOMBI method are shown. Thresholds indicating statistical significance are represented by dashed horizontal lines and significant P-values are highlighted. Please note that the y-axes of all plots have the same limits (0–15) to enable direct comparison.
Figure 7.
Figure 7.
ROC and PR curves of DeepCOMBI and all competitor methods on WTCCC datasets. Performance curves of all methods averaged over all diseases and chromosomes are shown. ROC curves are presented on the left and PR curves on the right side. Replicability according to the GWAS catalog was used for validation.

References

    1. Choi S., Bae S., Park T.. Risk prediction using genome-wide association studies on type 2 diabetes. Genomics Inform. 2016; 14:138–148. - PMC - PubMed
    1. Evans D.M., Visscher P.M., Wray N.R.. Harnessing the information contained within genome-wide association studies to improve individual prediction of complex disease risk. Hum. Mol. Genet. 2009; 18:3525–3531. - PubMed
    1. Kooperberg C., LeBlanc M., Obenchain V.. Risk prediction using genome-wide association studies. Genet. Epidemiol. 2010; 34:643–652. - PMC - PubMed
    1. Wei Z., Wang W., Bradfield J., Li J., Cardinale C., Frackelton E., Kim C., Mentch F., Van Steen K., Visscher P.M.et al. .. Large sample size, wide variant spectrum, and advanced machine-learning technique boost risk prediction for inflammatory bowel disease. Am. J. Hum. Genet. 2013; 92:1008–1012. - PMC - PubMed
    1. Okser S., Pahikkala T., Airola A., Salakoski T., Ripatti S., Aittokallio T.. Regularized machine learning in the genetic prediction of complex traits. PLoS Genet. 2014; 10:e1004754. - PMC - PubMed