. 2020 Nov;1(11):1097-1112.
doi: 10.1038/s43018-020-00121-4. Epub 2020 Oct 26.

Multimodal Mapping of the Tumor and Peripheral Blood Immune Landscape in Human Pancreatic Cancer

Affiliations

Multimodal Mapping of the Tumor and Peripheral Blood Immune Landscape in Human Pancreatic Cancer

Nina G Steele et al. Nat Cancer. 2020 Nov.

Abstract

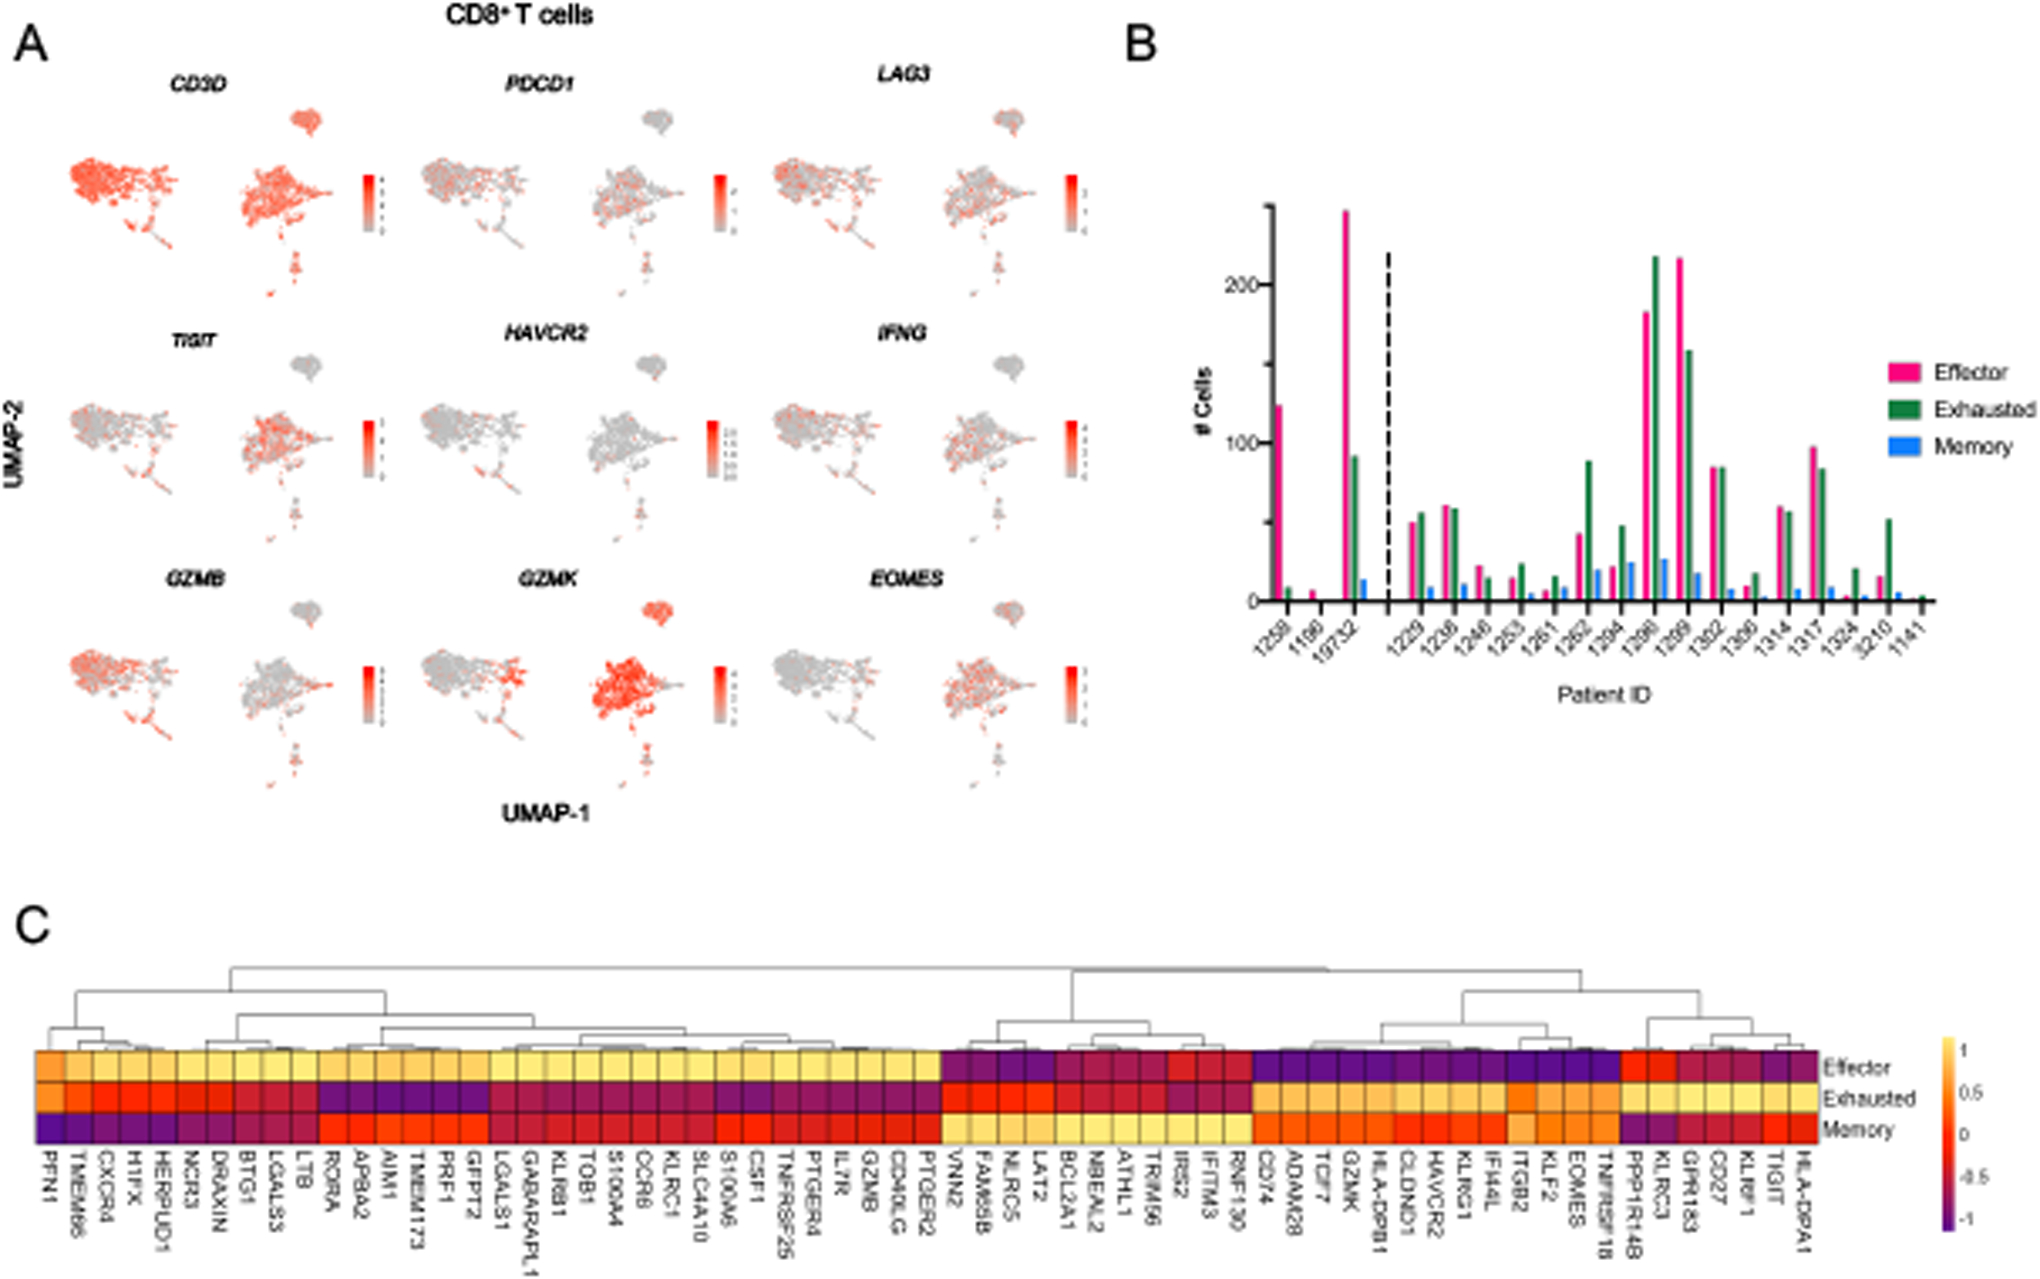
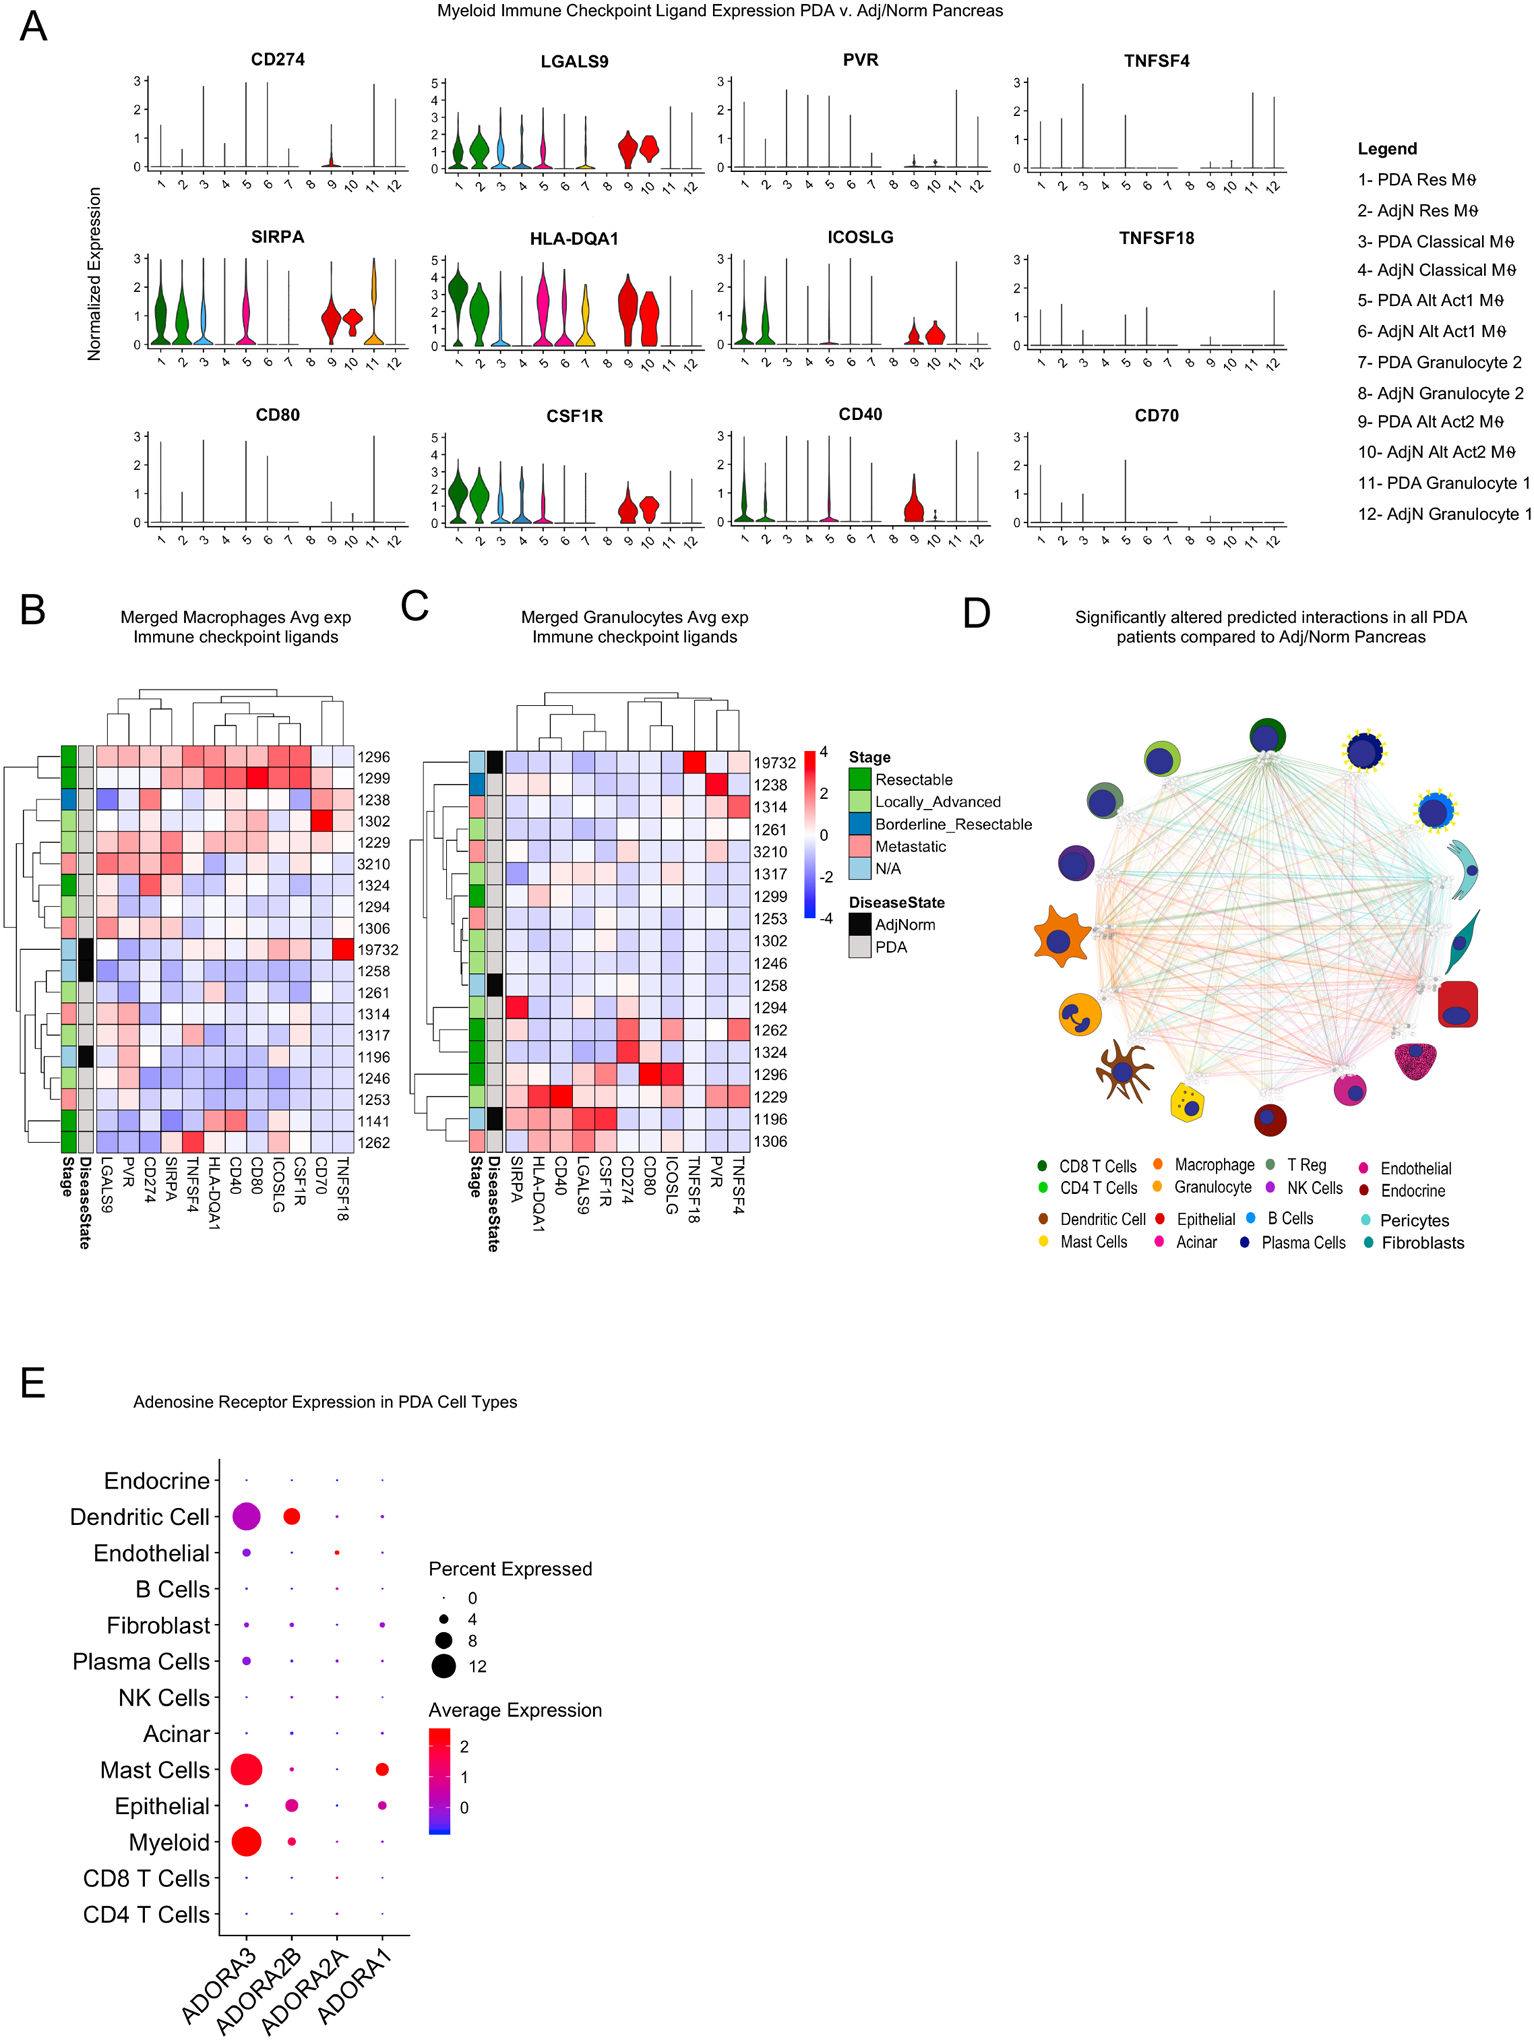
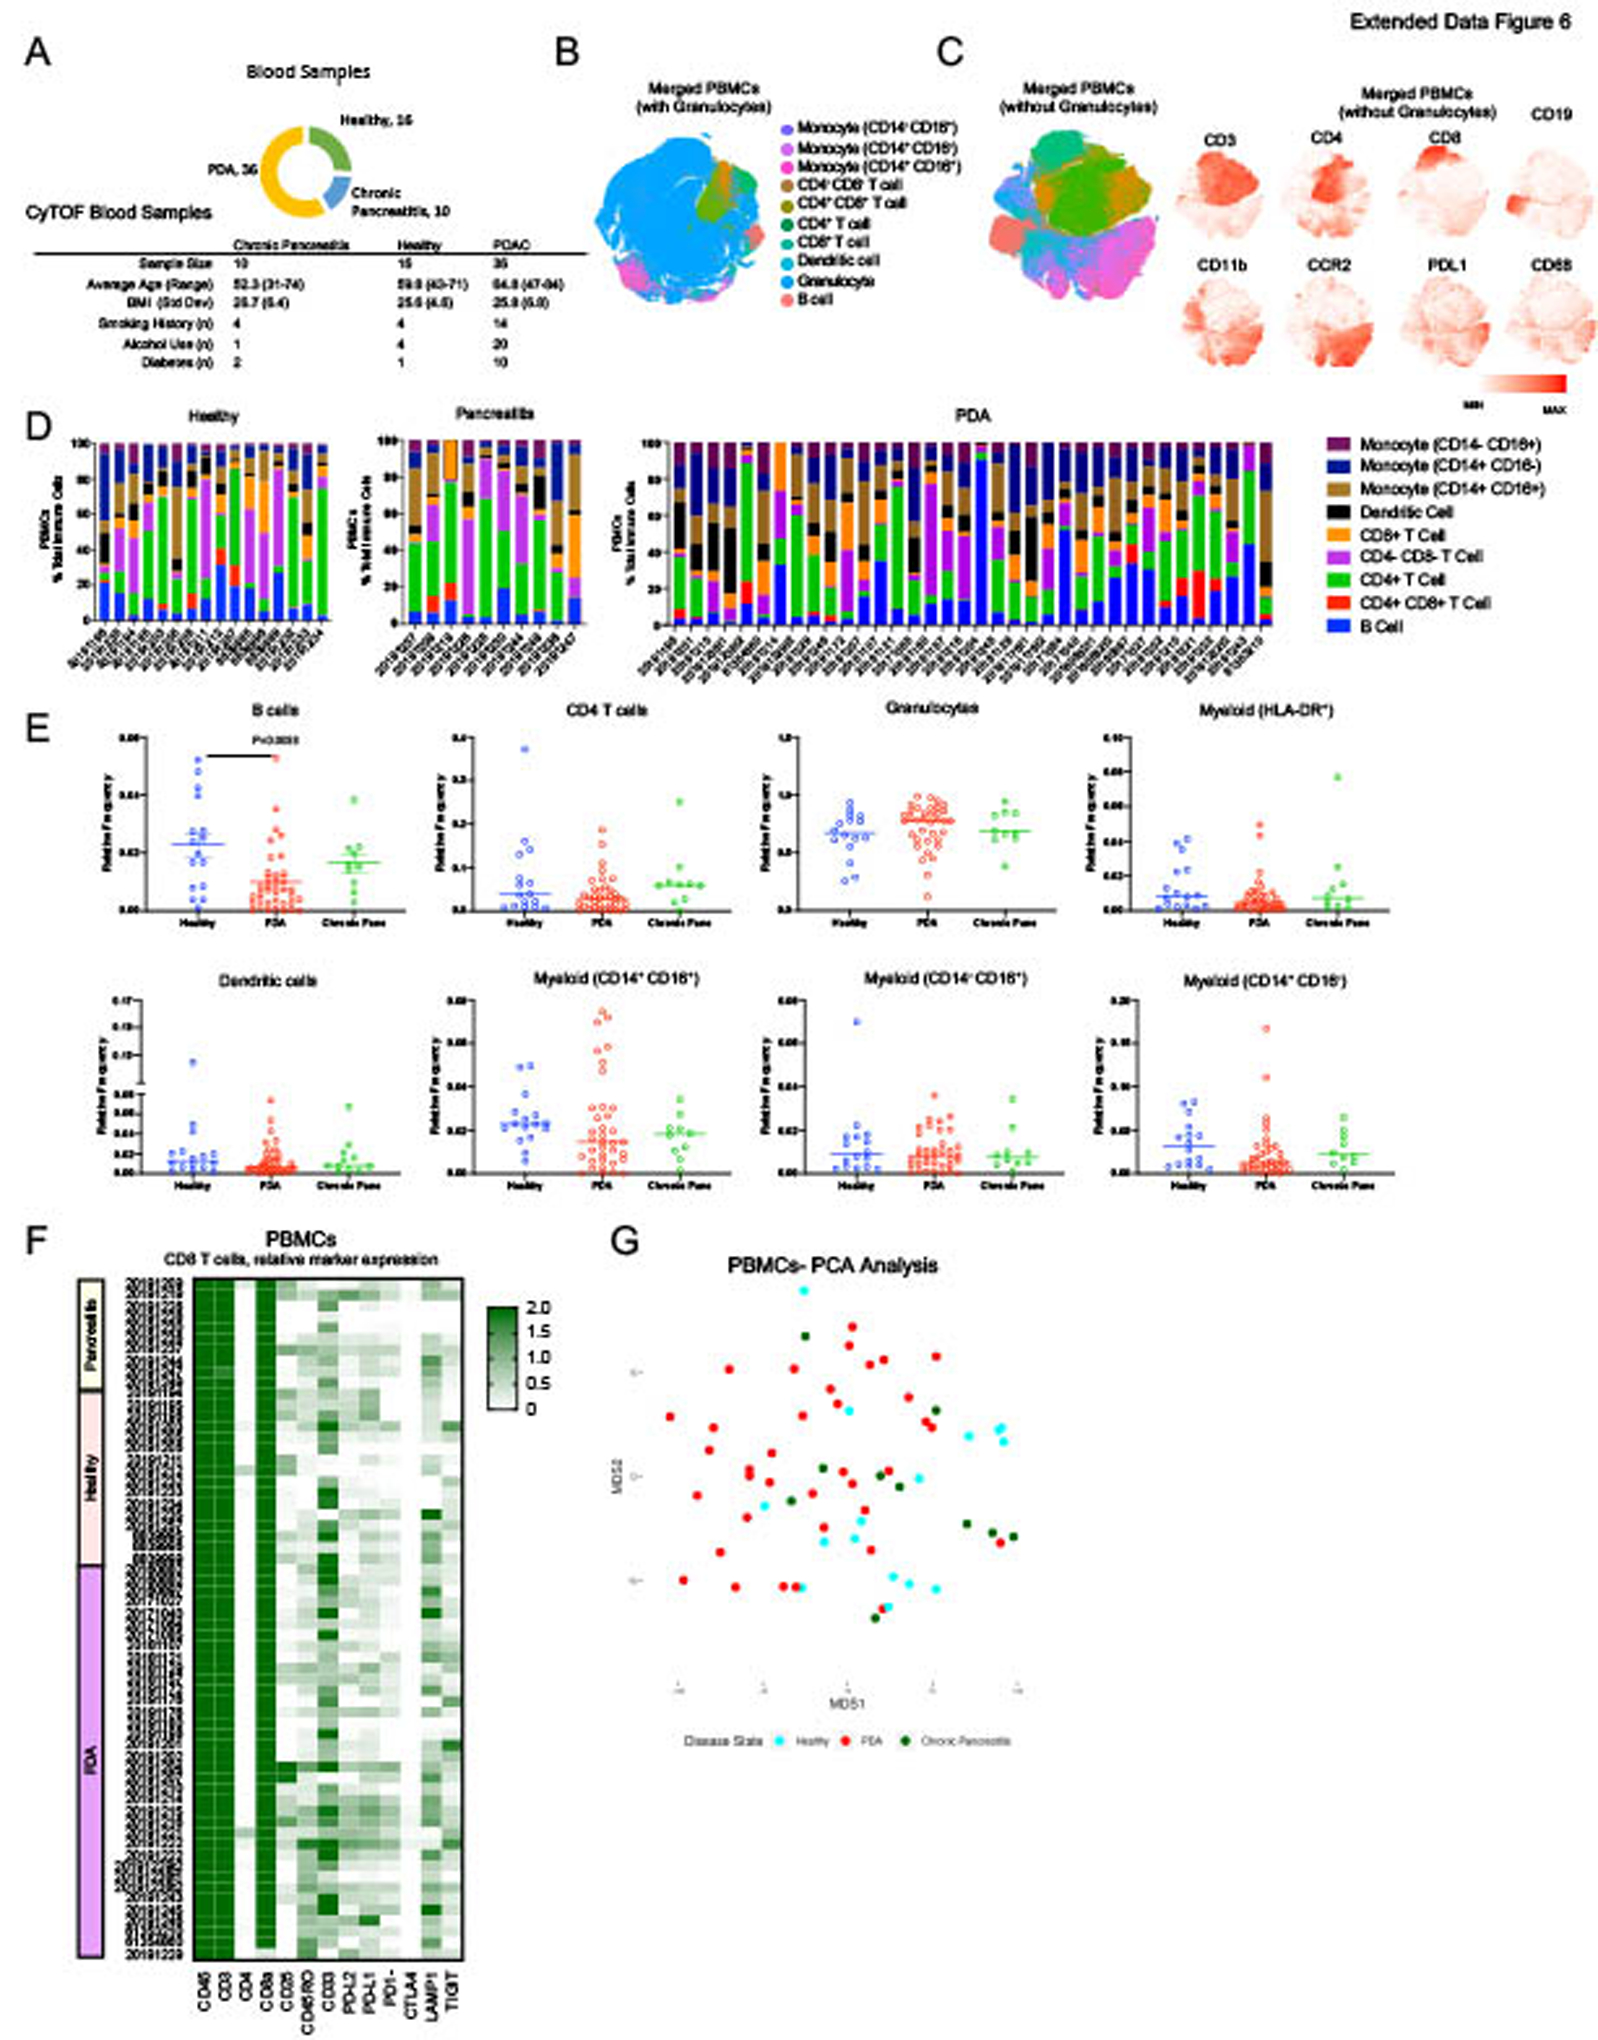
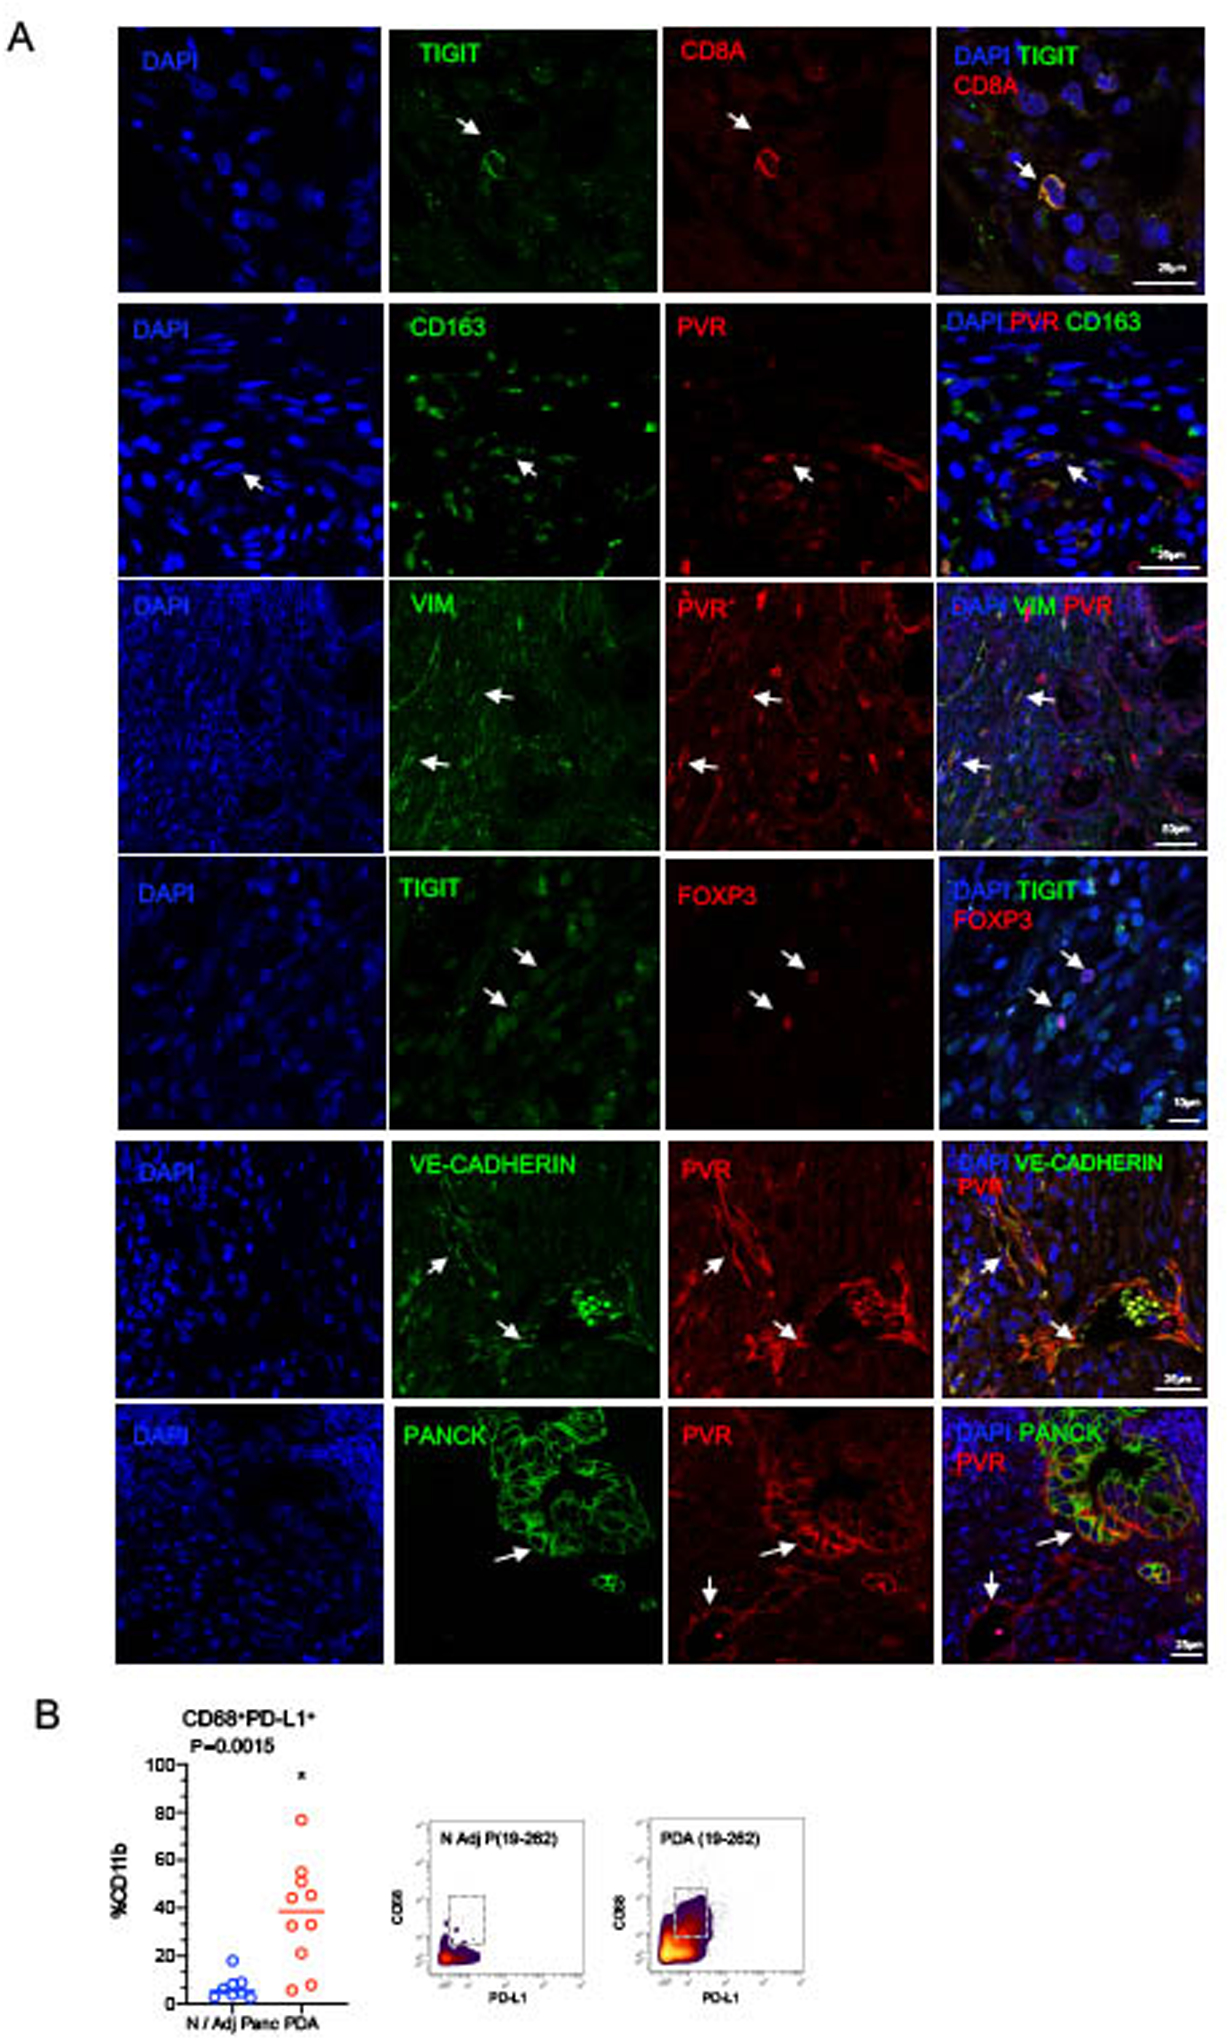
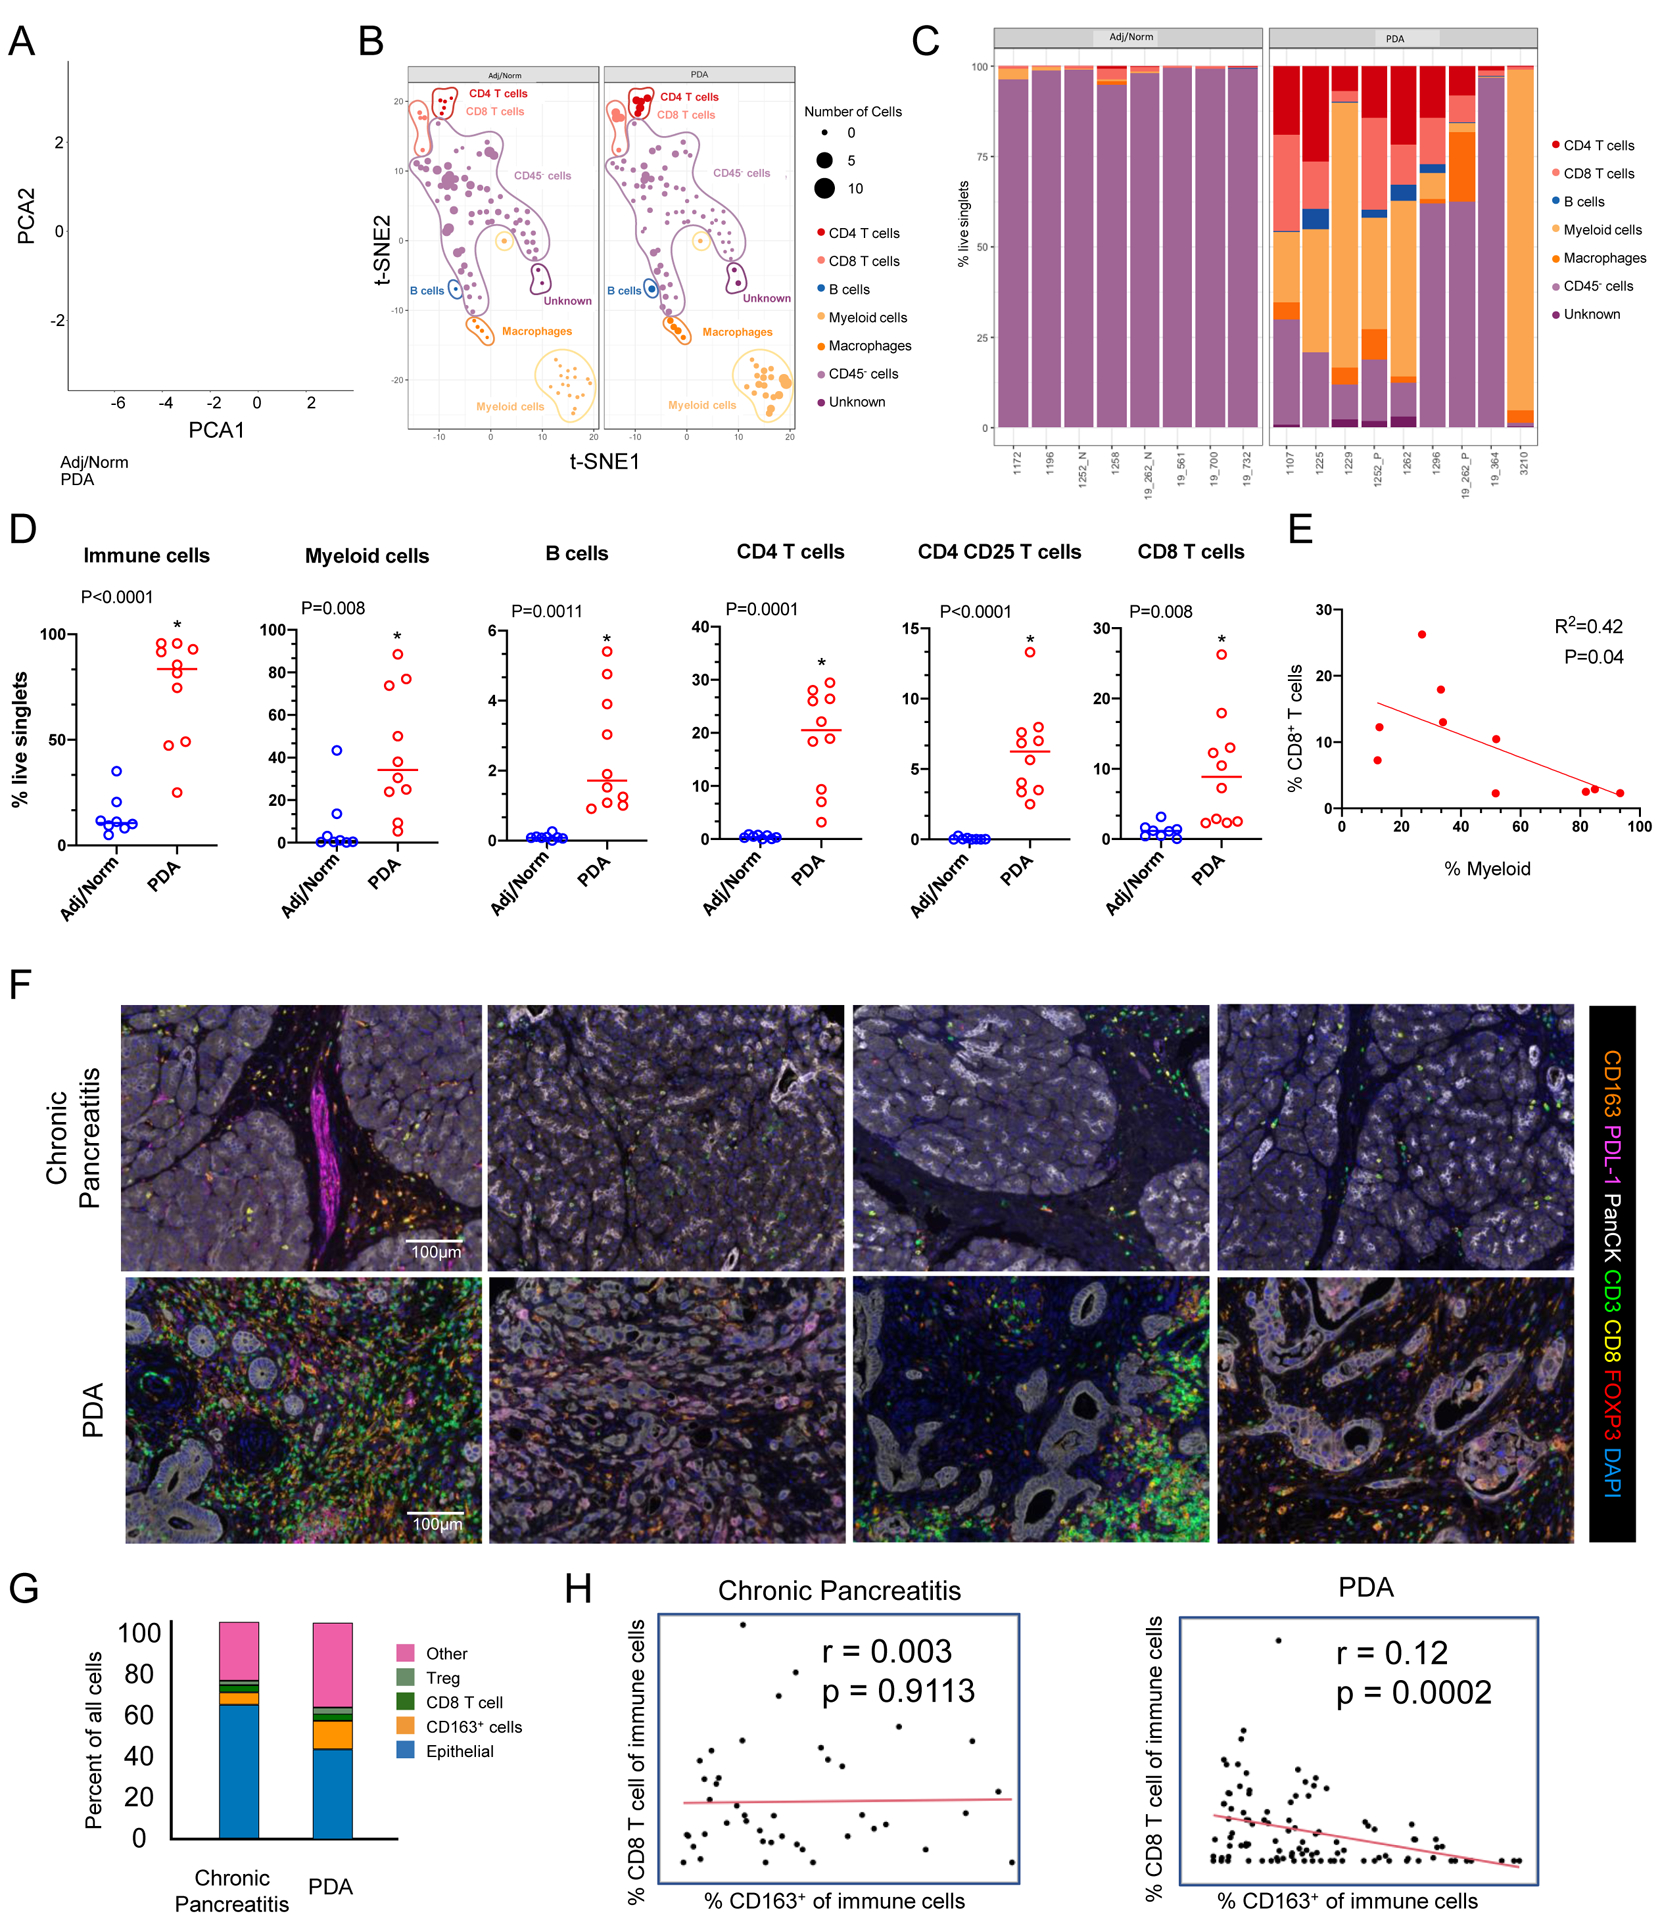
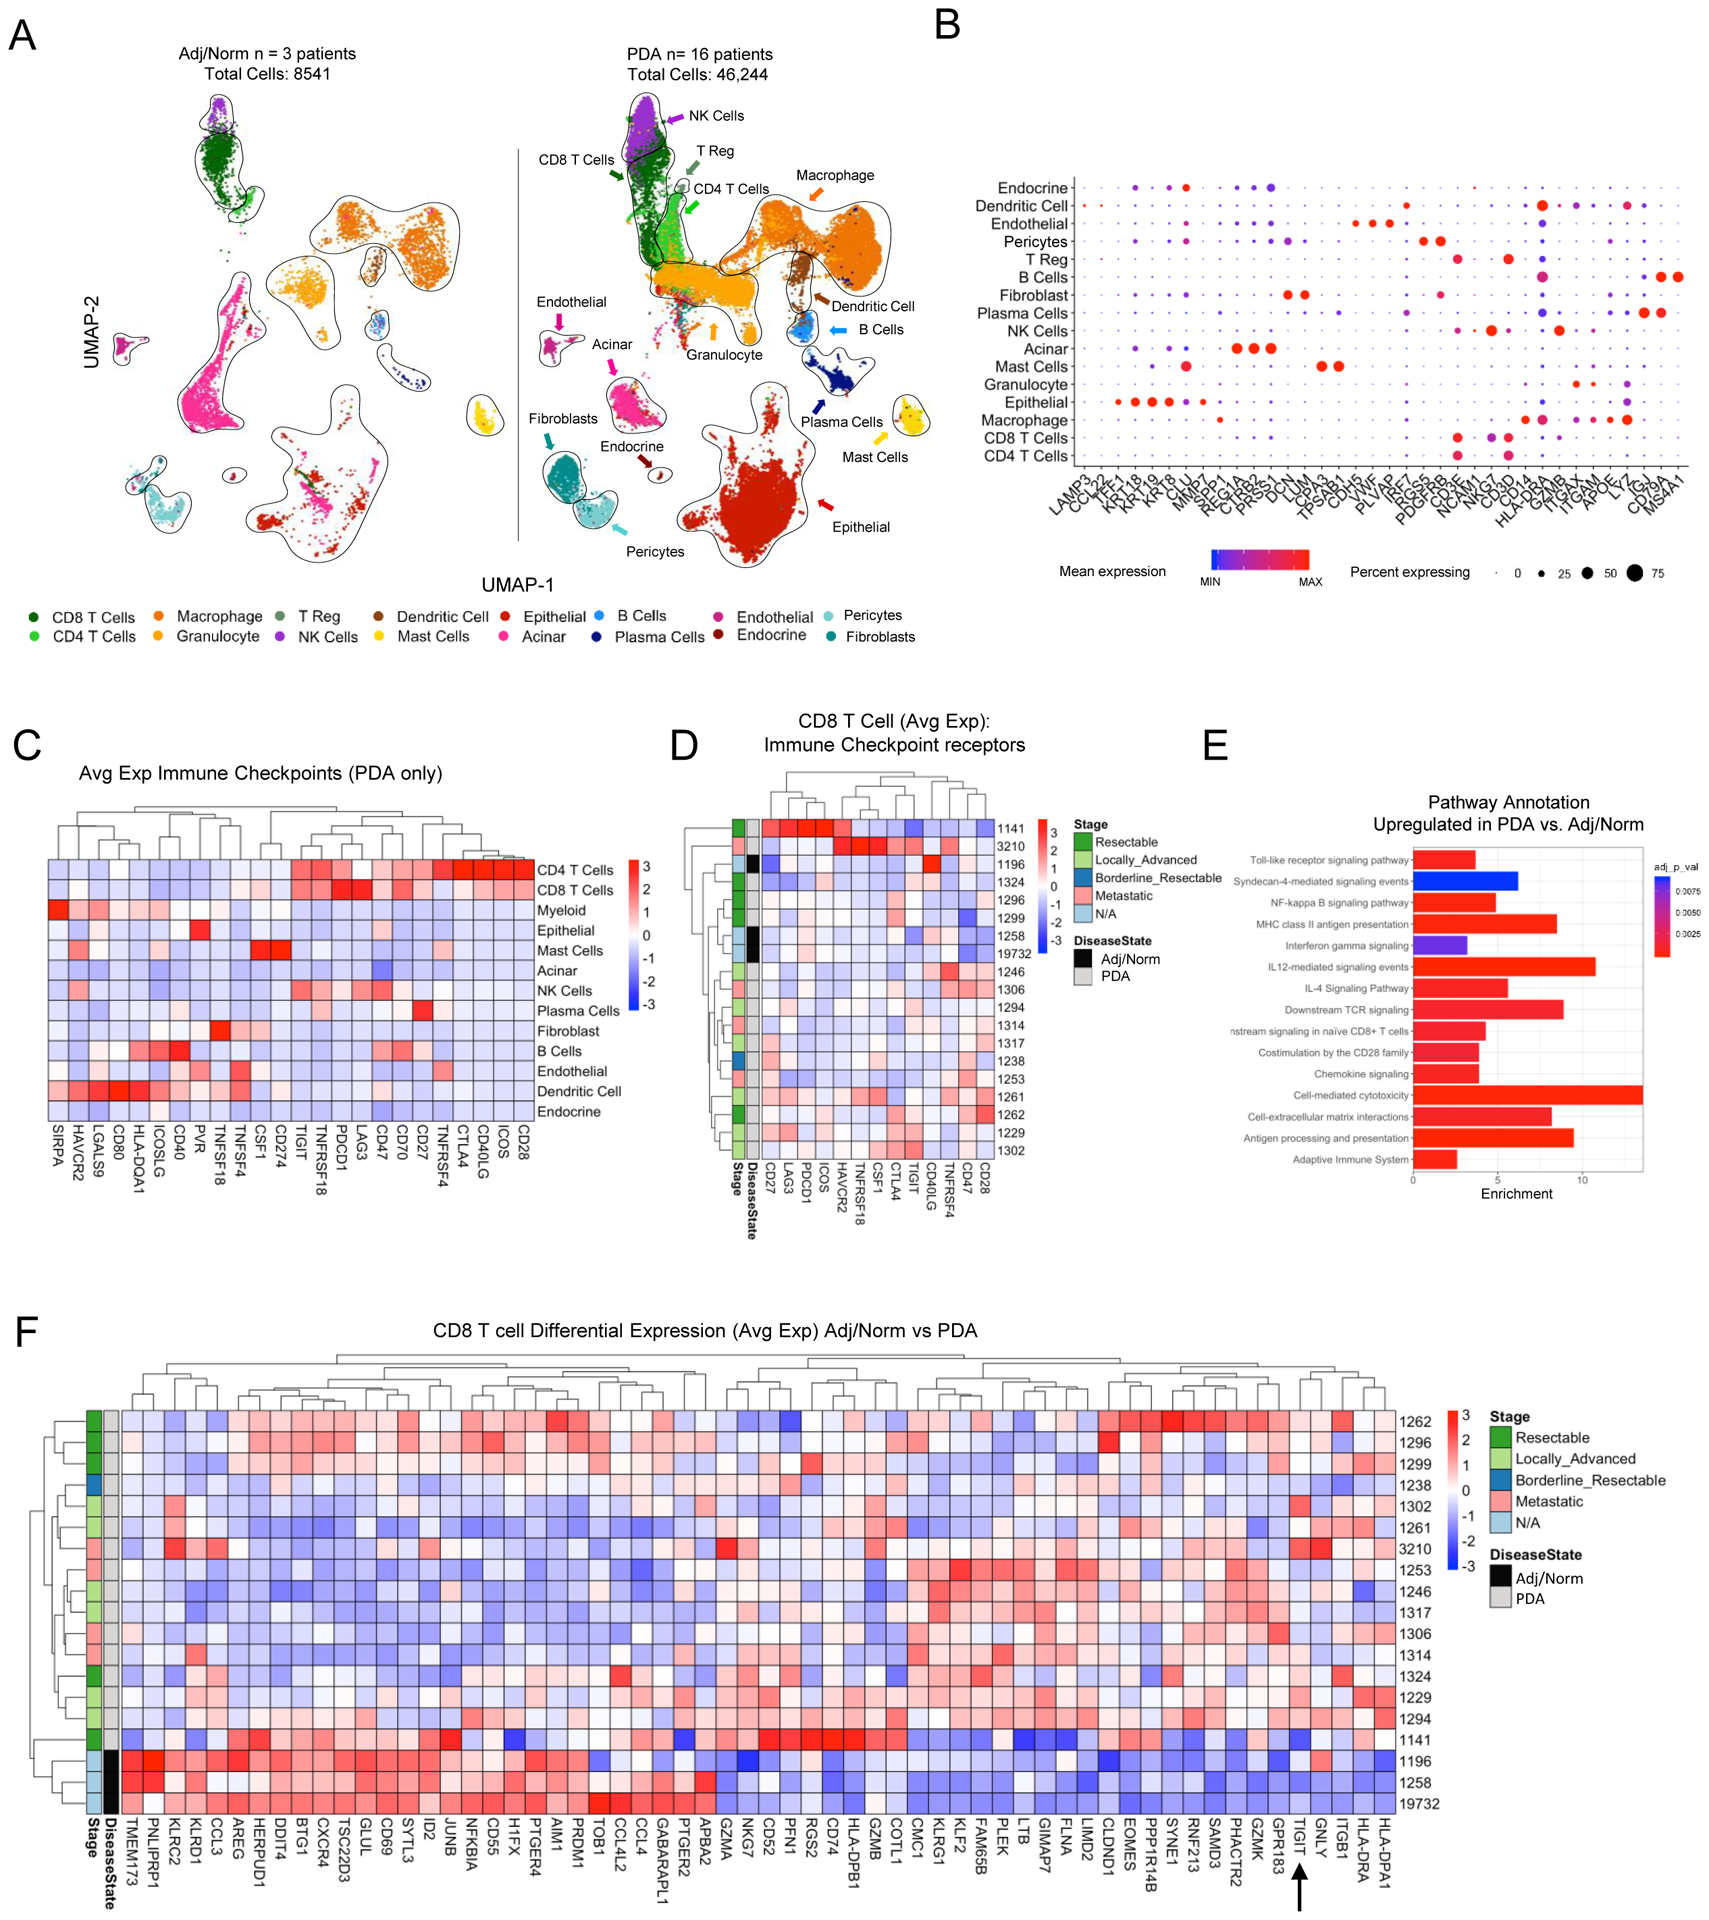
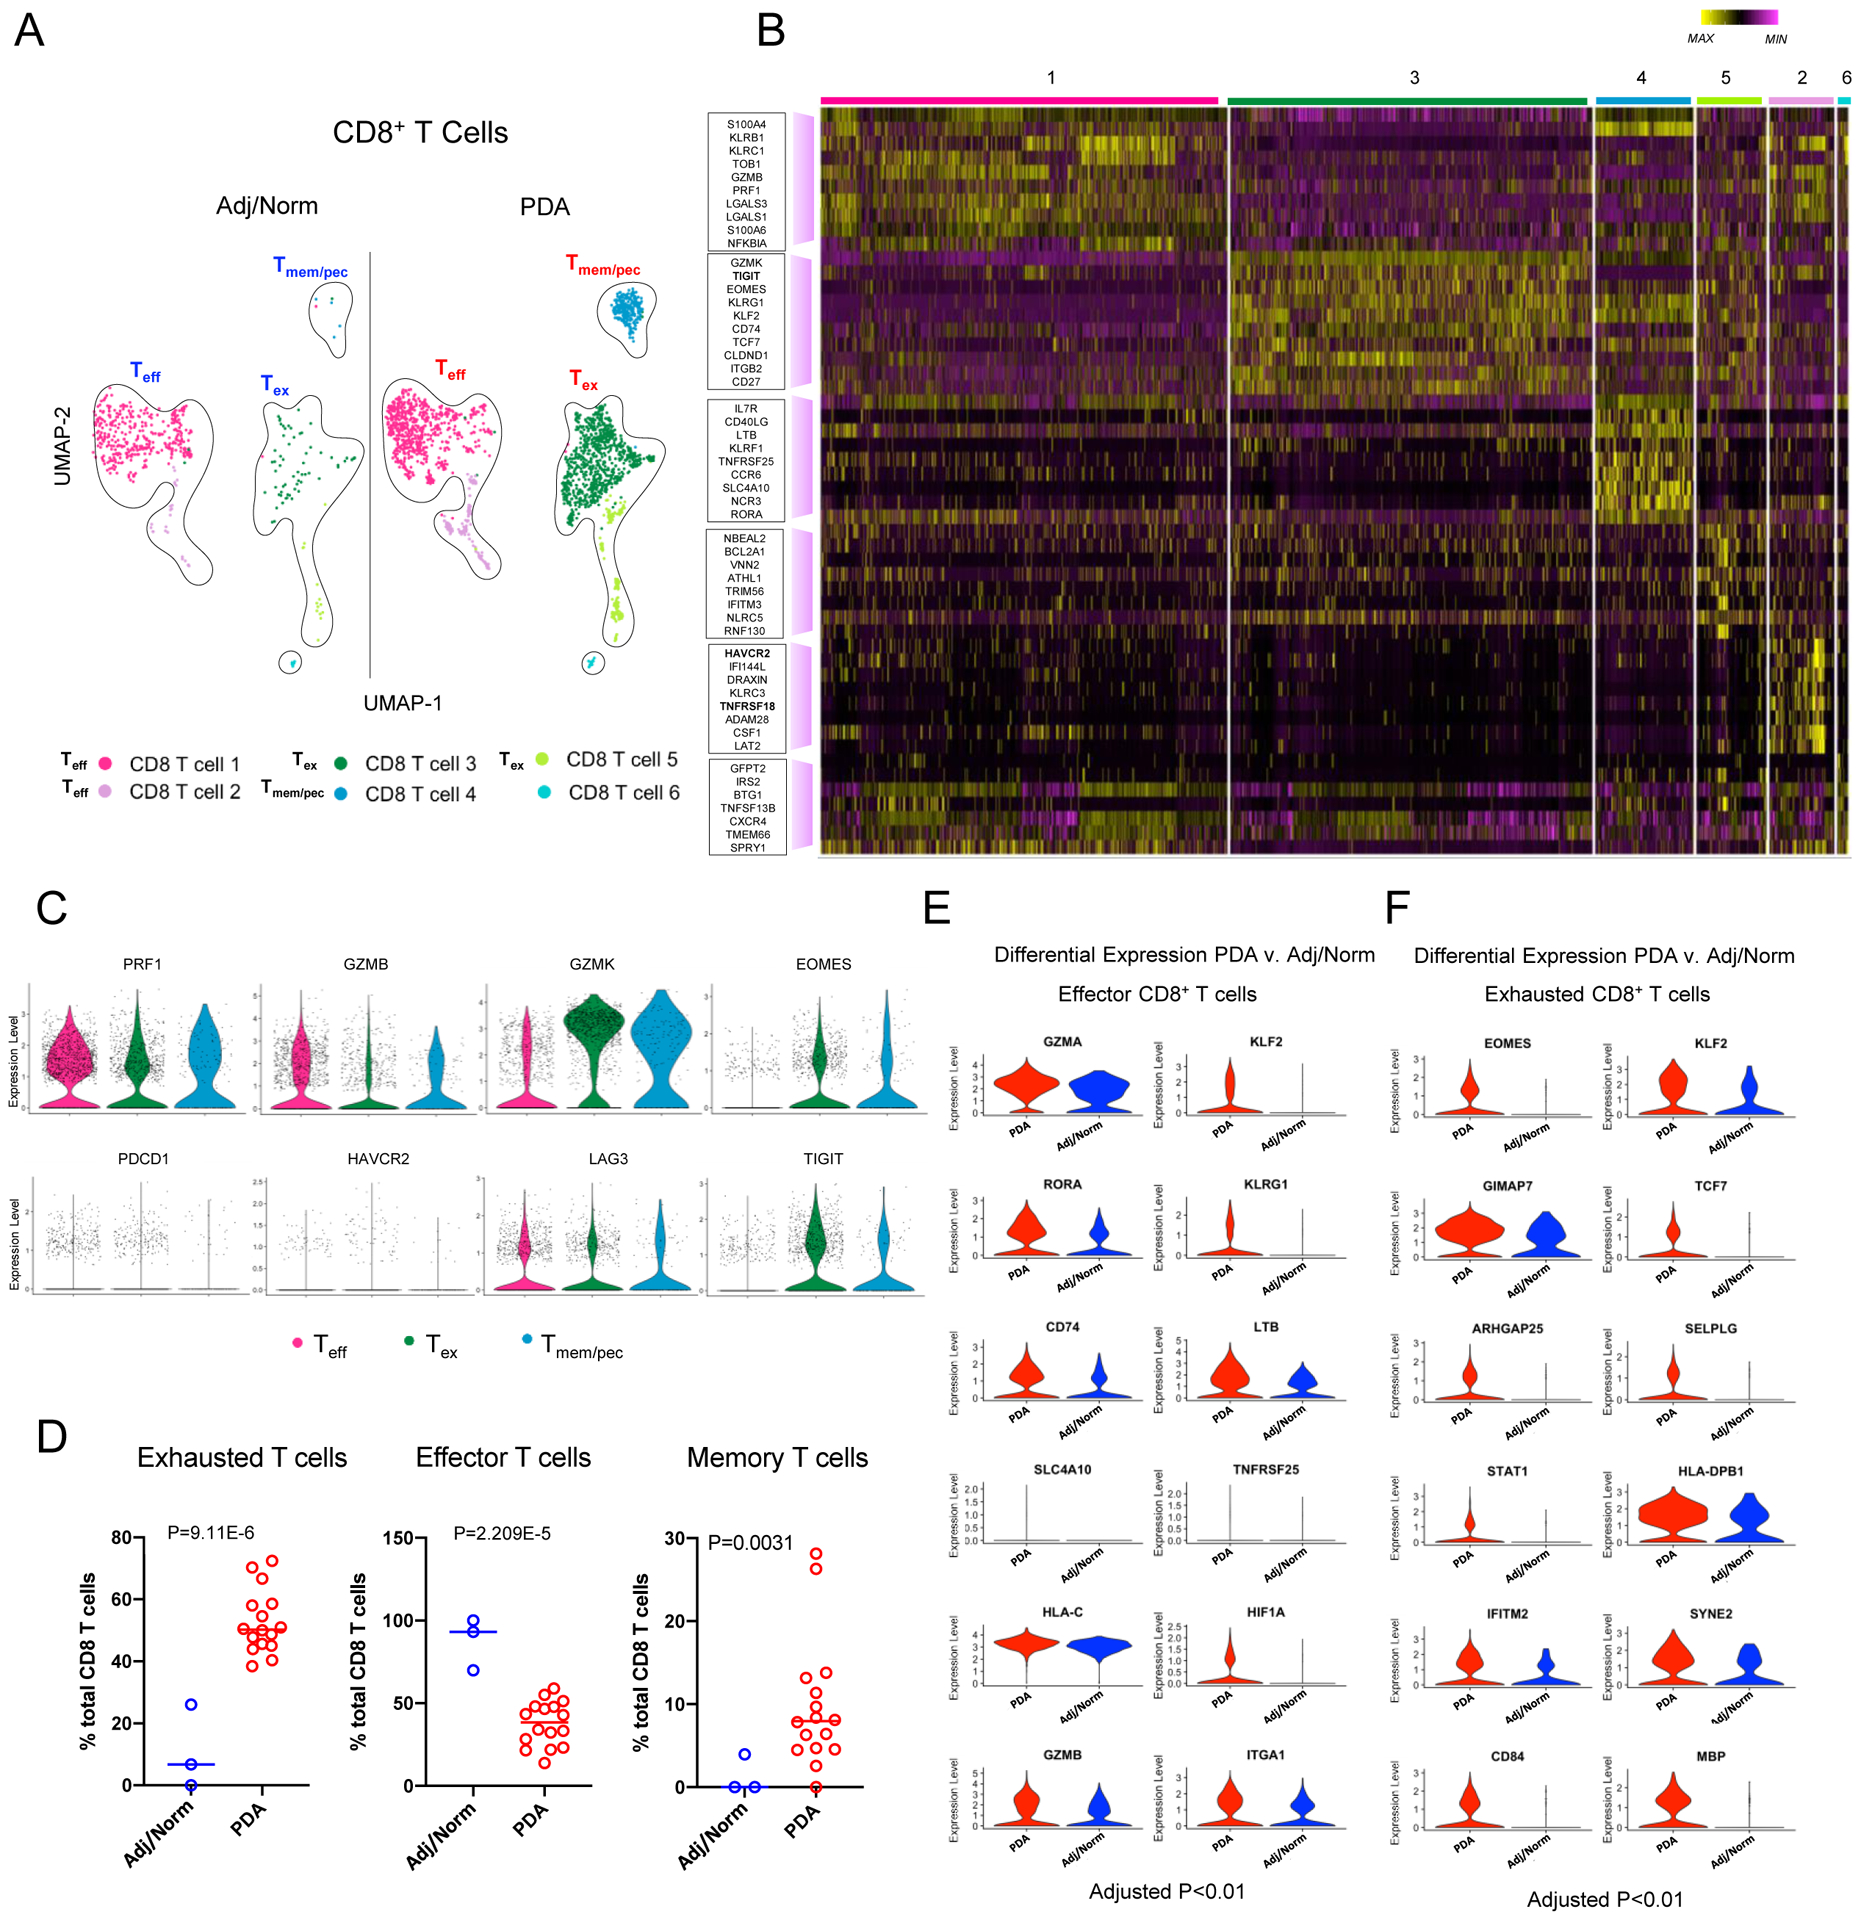
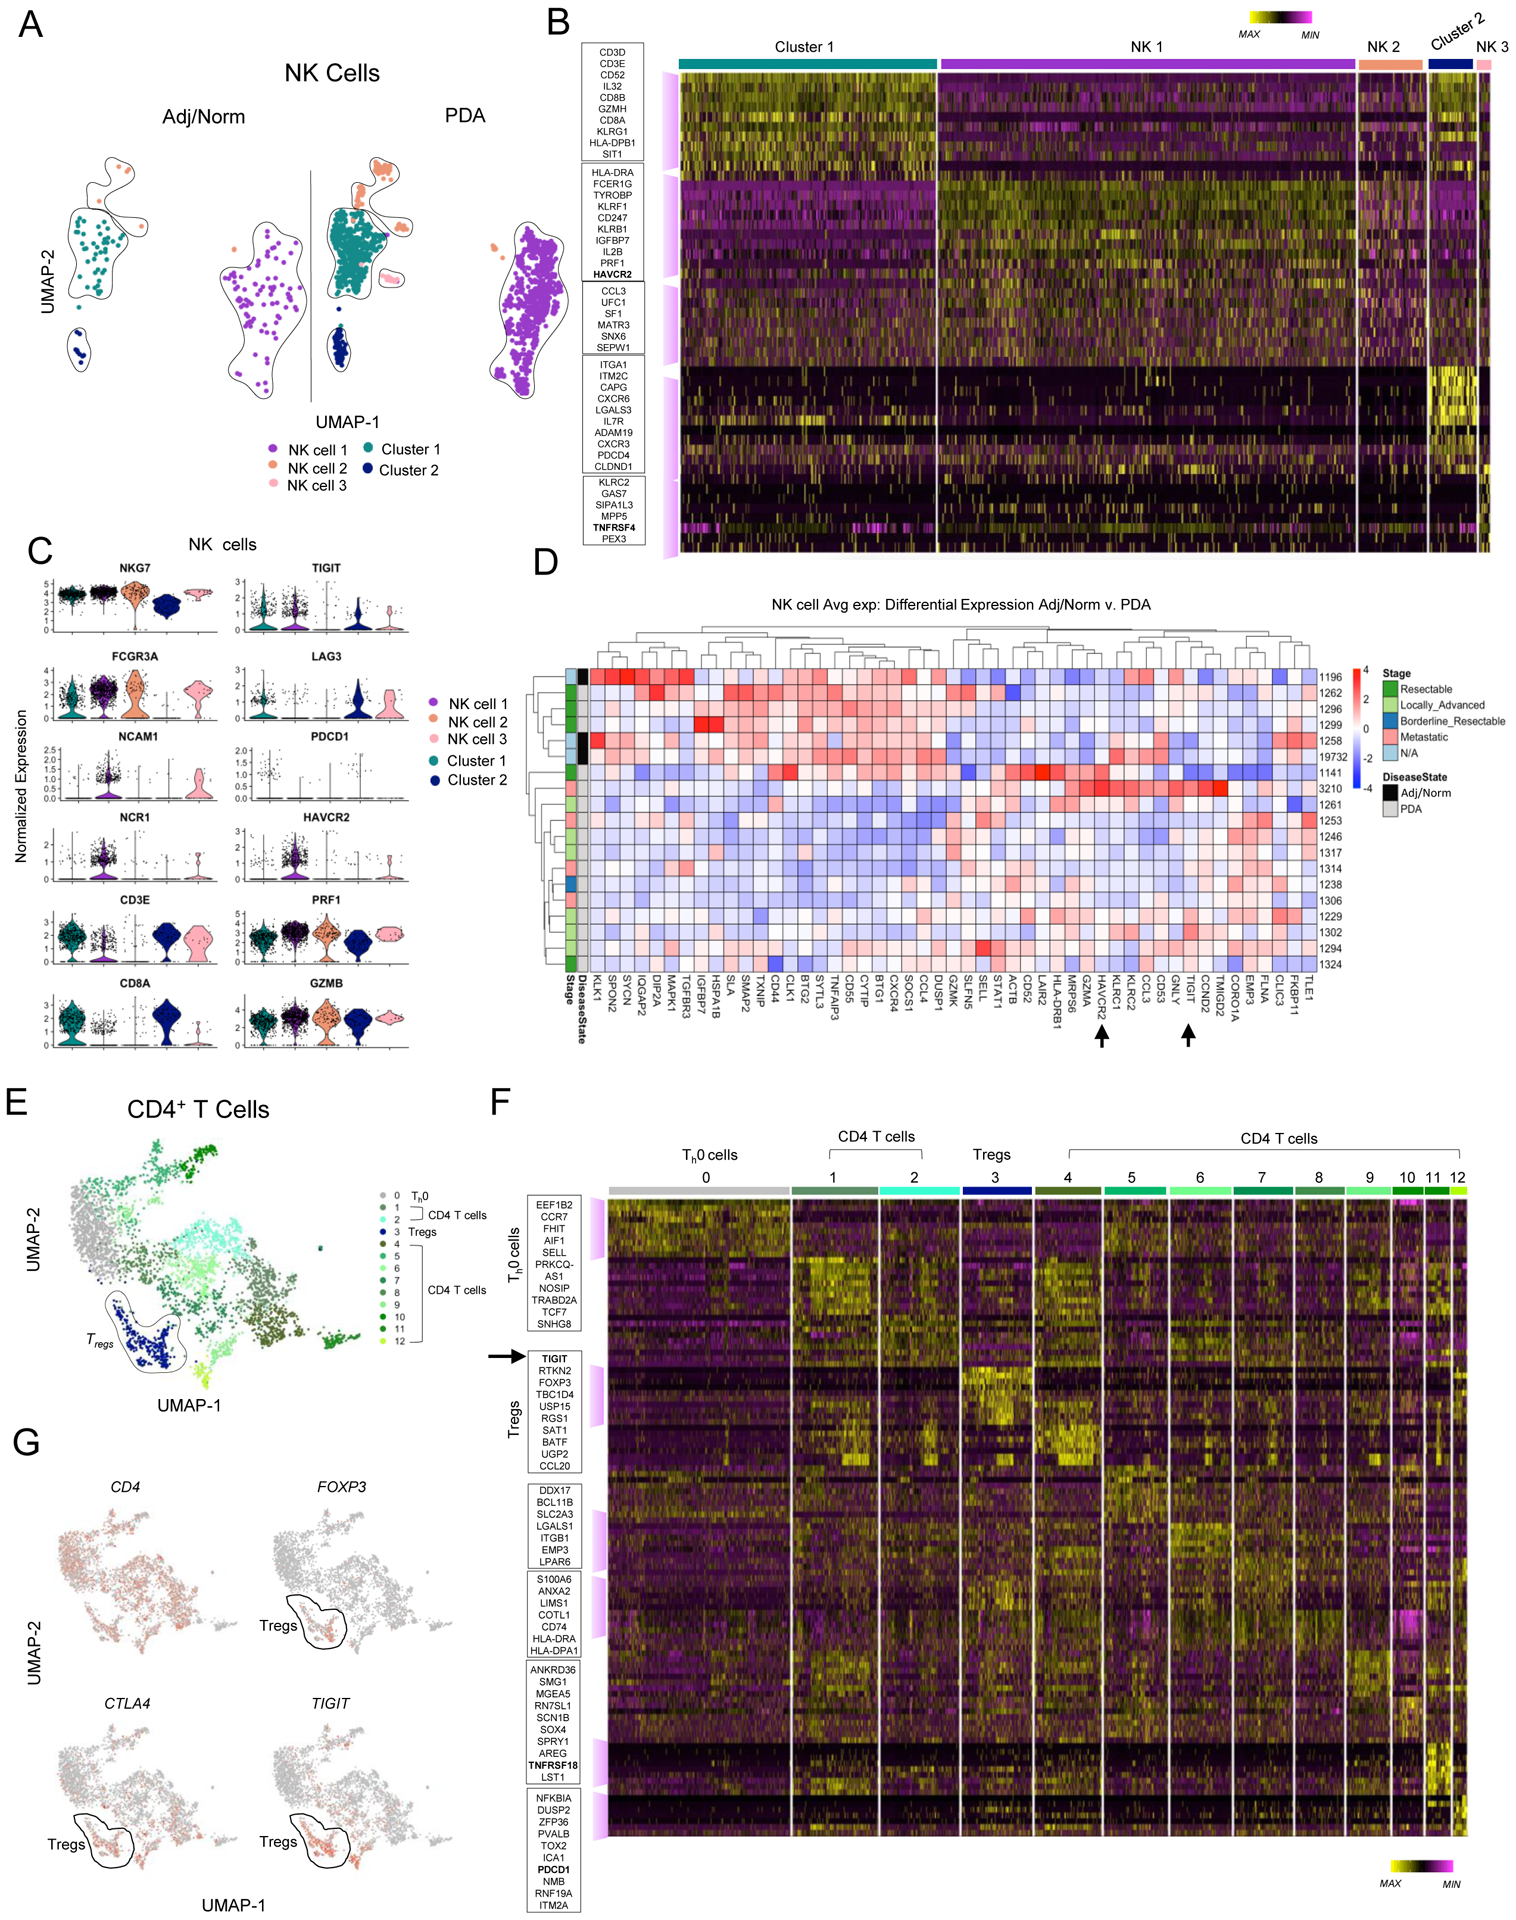
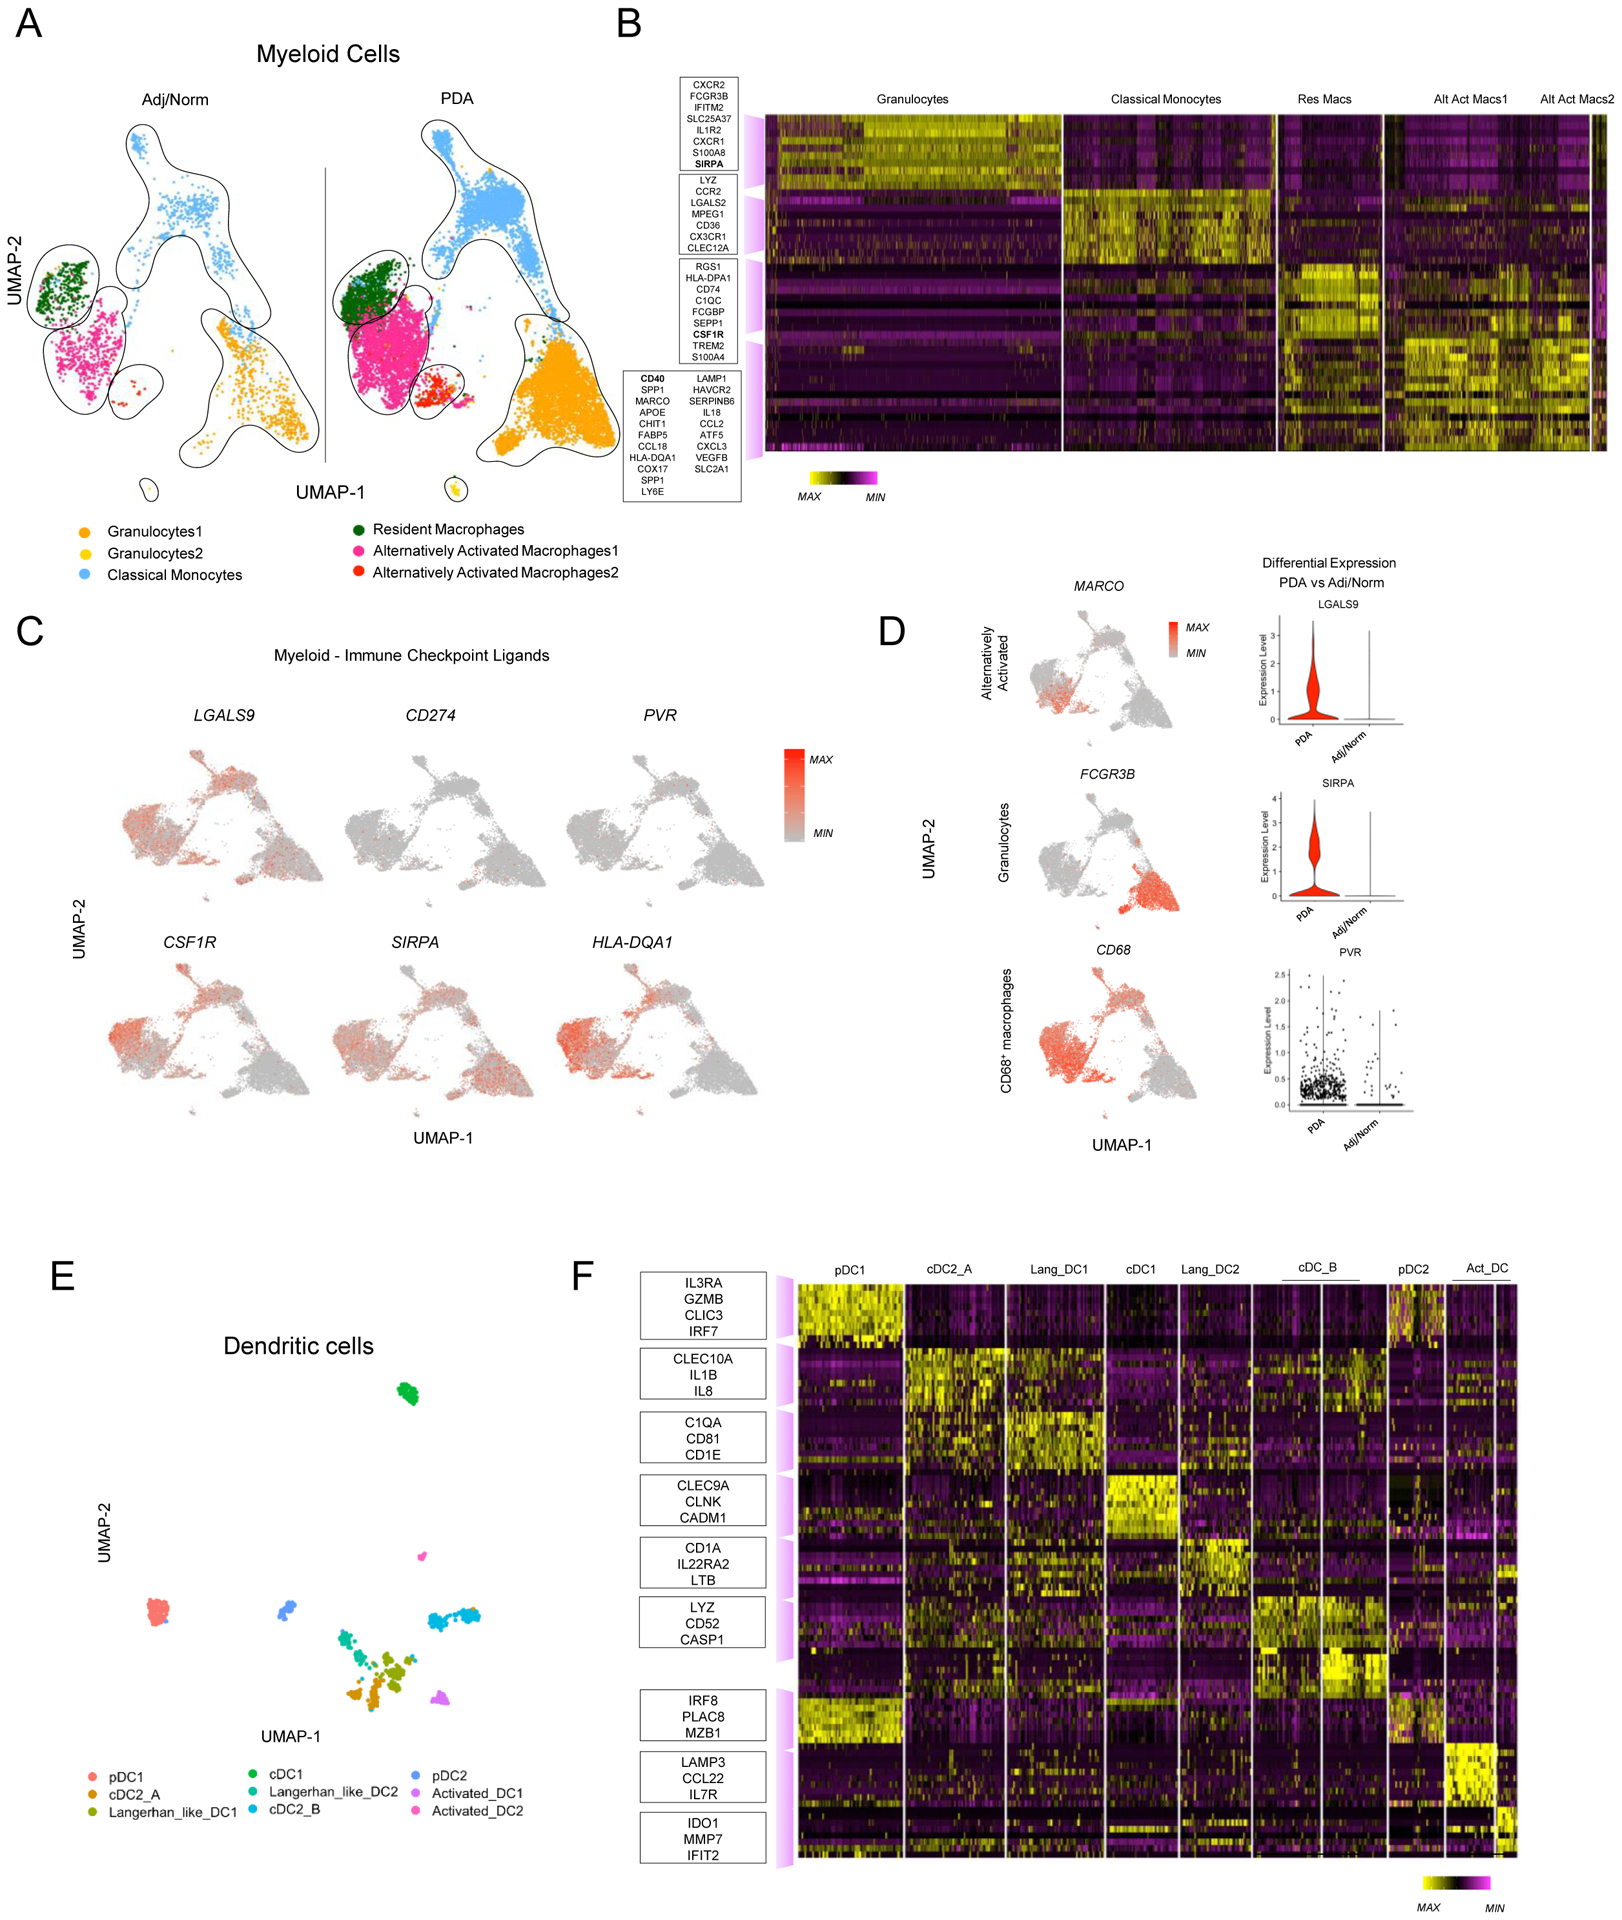
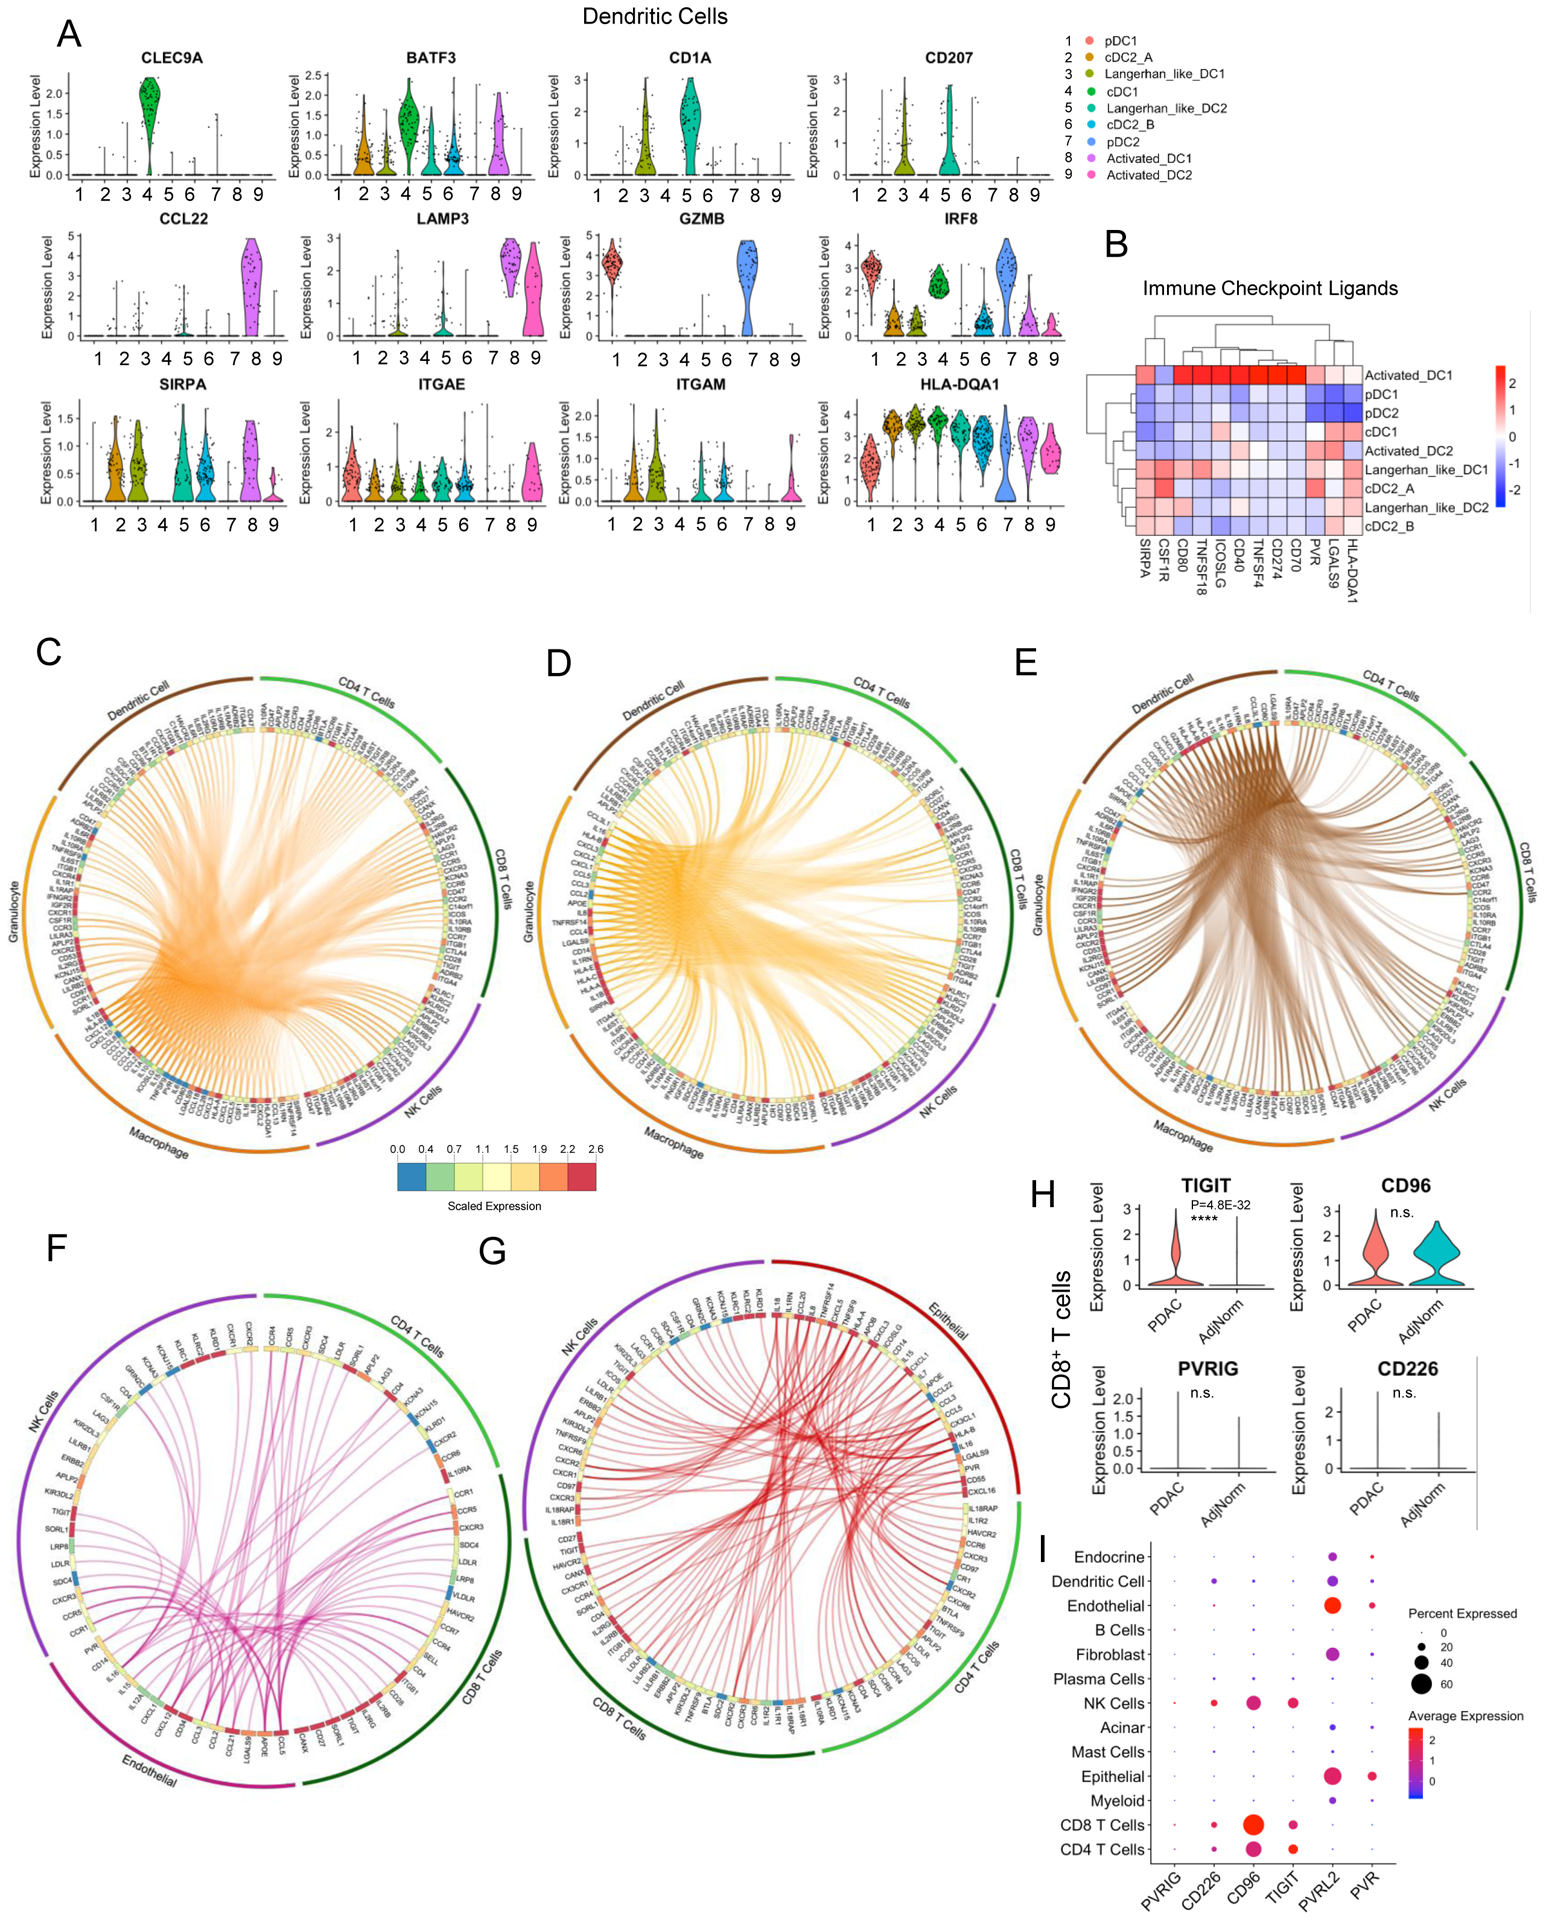
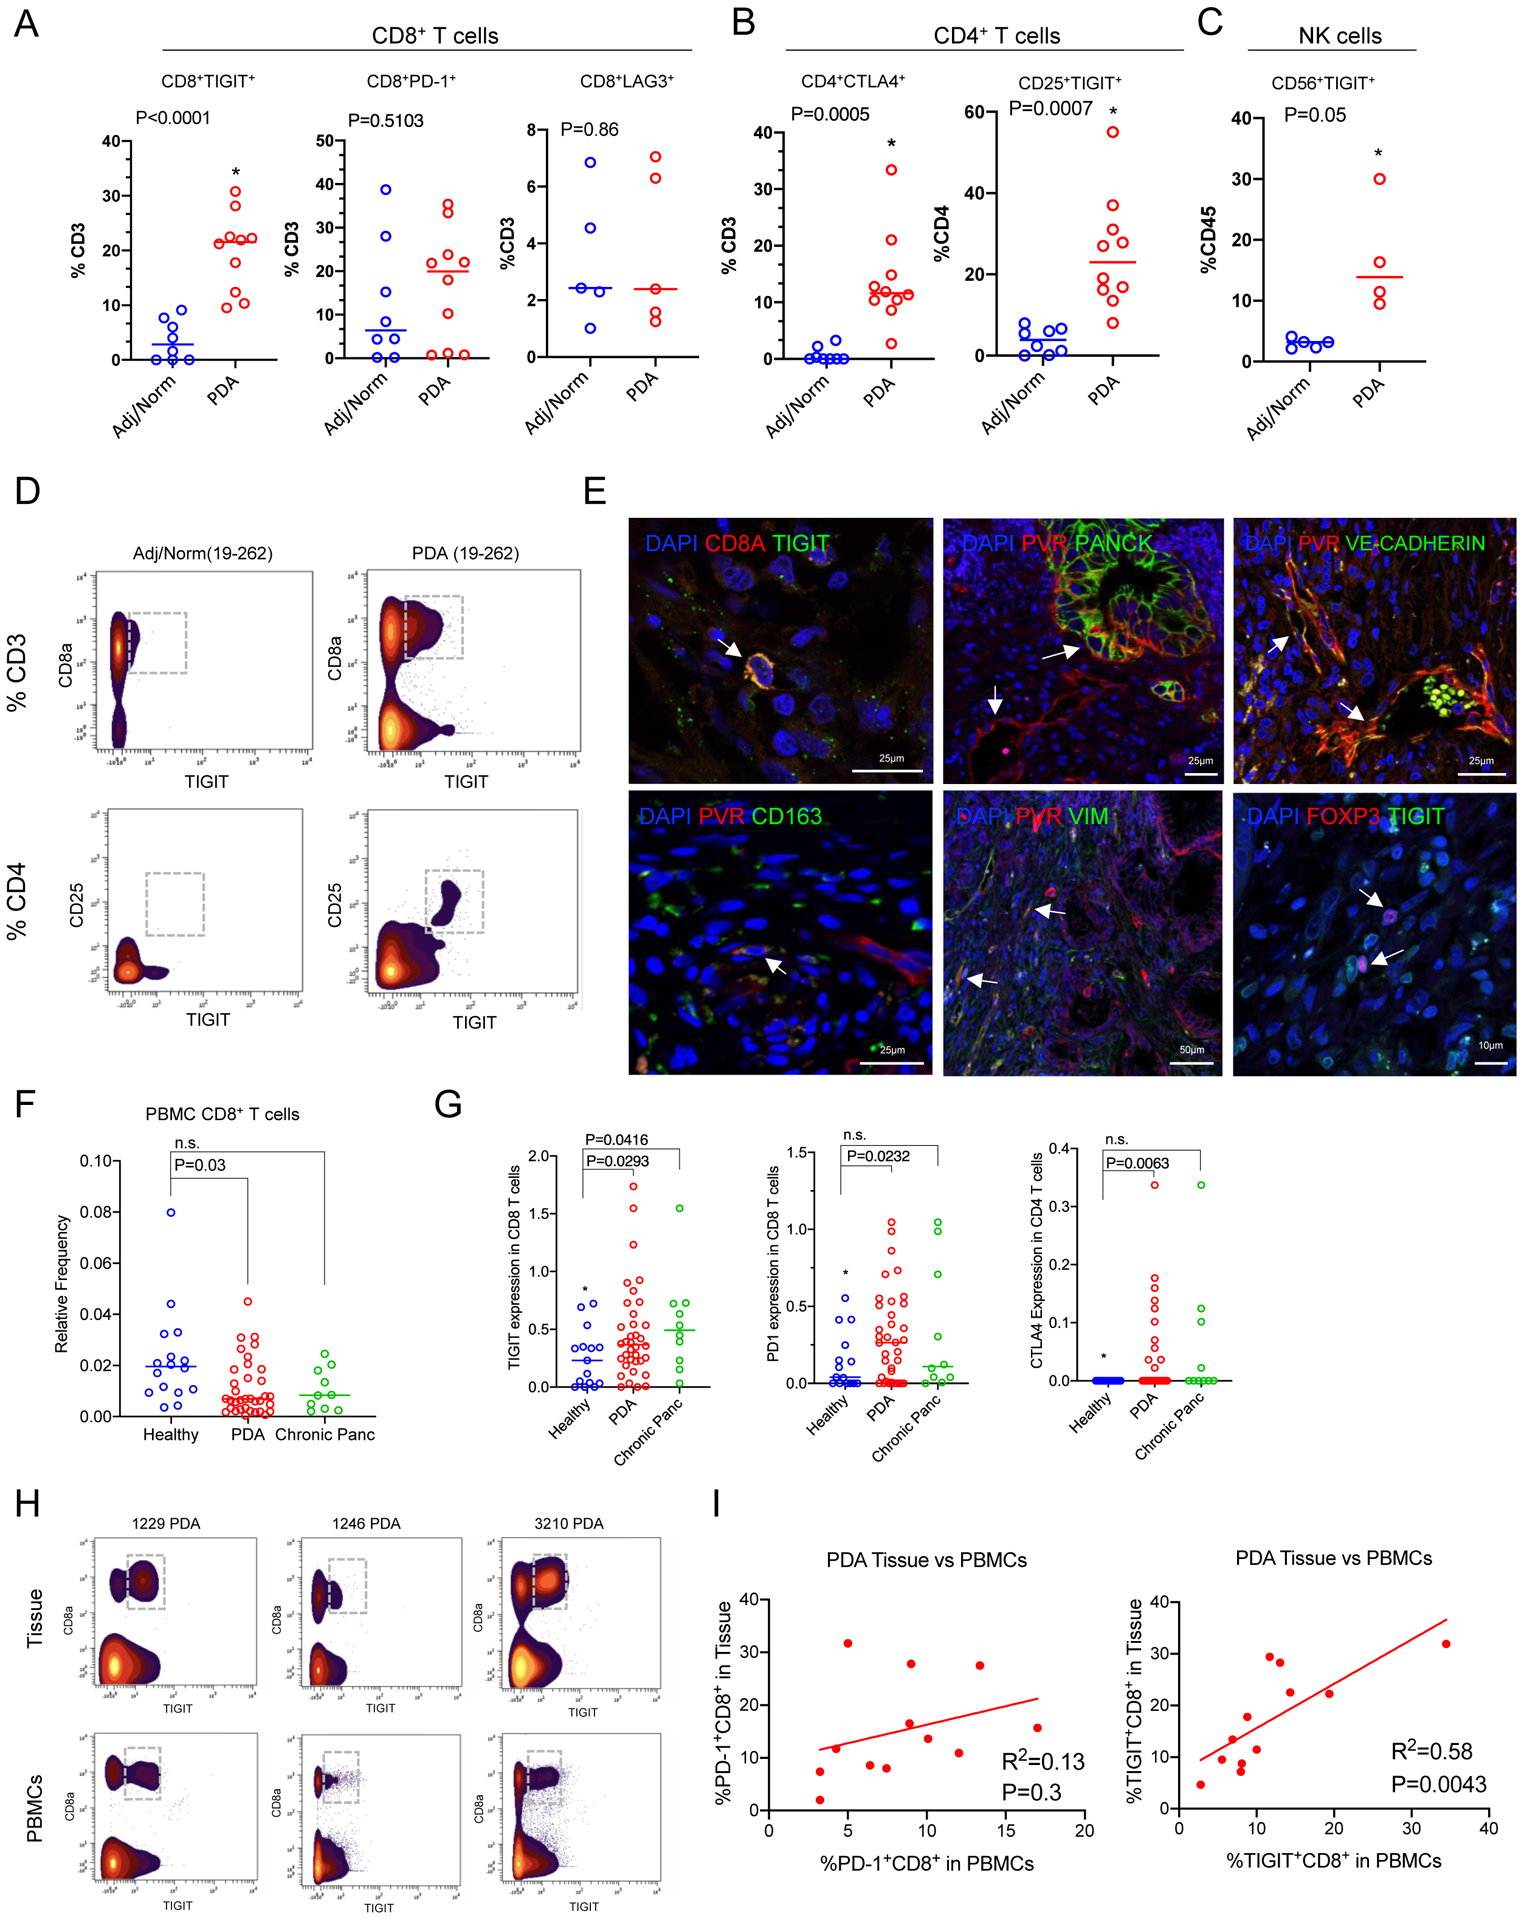
Pancreatic ductal adenocarcinoma (PDA) is characterized by an immune-suppressive tumor microenvironment that renders it largely refractory to immunotherapy. We implemented a multimodal analysis approach to elucidate the immune landscape in PDA. Using a combination of CyTOF, single-cell RNA sequencing, and multiplex immunohistochemistry on patient tumors, matched blood, and non-malignant samples, we uncovered a complex network of immune-suppressive cellular interactions. These experiments revealed heterogeneous expression of immune checkpoint receptors in individual patient's T cells and increased markers of CD8+ T cell dysfunction in advanced disease stage. Tumor-infiltrating CD8+ T cells had an increased proportion of cells expressing an exhausted expression profile that included upregulation of the immune checkpoint TIGIT, a finding that we validated at the protein level. Our findings point to a profound alteration of the immune landscape of tumors, and to patient-specific immune changes that should be taken into account as combination immunotherapy becomes available for pancreatic cancer.

Keywords: CD8+ T cells; Single-cell RNA sequencing; TIGIT; immune checkpoints; pancreatic cancer; tumor immunology.


Conflict of interest statement

Competing interests: The authors have declared that no conflict of interest exists.

Figures

Extended Data Figure 1.
Extended Data Figure 1.. CyTOF and multiplex fluorescent immunohistochemistry (mfIHC) mapping can be readily performed on patient tumor samples and show a heterogeneous immune infiltration in human pancreatic cancer.
(A) Patient breakdown and tumor characteristics of CyTOF performed on 8 adj/norm pancreas and 10 PDA tumor samples (surgical (7) vs. fine needle biopsy (FNB) (3)). (B) Representative H&E stains of samples DS20191258 (Adj/Norm), DS20191299 (PDA tumor from surgical resection), and DS20191324 (PDA tumor from fine needle biopsy). (C) The ConsensusClusterPlus and FlowSOM R packages were used to define the initial 22 clusters identified in the tissue CyTOF samples. (D) Final heatmap demonstrating marker expression used to define cell populations. (E) Manual gating of CD3-CD8A-CD45+CD56+ NK cells in adjacent/normal and PDA tissue samples, n=5 adjacent/normal tissue samples and n=4 PDA tissue samples. Two-sided Student’s t-test was performed to compare between groups and asterisk indicates a p value of less than 0.05 was considered significant. For manual gating of NK cells n=5 for adj/norm and n=4 for PDA patient samples. (F) mfIHC composite image of PDA (left). Phenotype map with the following basic phenotypes at their x and y coordinates: T cell (green), epithelial cells (pink), APCs (orange), other cells (grey) (right). 71 individual PDA and 34 individual chronic pancreatitis subjects were examined in this analysis. (G) Relative cellular composition by quantitation of mfIHC of representative surgical PDA tissue of additional patients DS20181166 (PDA tumor from distal pancreatectomy), DS20181141 (PDA tumor from distal pancreatectomy) (H) Corresponding mfIHC images of DS20181166, and DS20181141.
Extended Data Figure 2.
Extended Data Figure 2.. Single Cell RNA Sequencing of PDA tissue reveals heterogeneous cellular composition and expression of immune checkpoints.
(A) Single cell RNA sequencing tissue sample breakdown (n = 3 Adj/Norm tissue, n=10 PDA tissue from fine needle biopsy, and n=6 PDA tissue from surgical resection), patient clinical data, and tumor characteristics (grade and stage) (Left panel). Breakdown of sequenced PBMC samples with corresponding patient clinical data (Right panel). (B) UMAP of the merged tissue colored by Patient ID prior to batch correction (Left panel) and post batch correction (Right panel). (C) UMAP of 3 individual adjacent/normal samples and (D) 16 PDA tissues. We distinguished two epithelial populations: tumor cells and acinar cells. In the non-epithelial compartment, we identified fibroblasts, pericytes, CD8+ T cells, CD4+ T cells, Tregs, NK cells, B cells, plasma cells, mast cells, macrophages, granulocytes, dendritic cells, endothelial cells, and a small endocrine population.
Extended Data Figure 3.
Extended Data Figure 3.. Single Cell RNA Sequencing of PDA PBMCs reveals heterogeneous cellular composition and expression of immune checkpoints.
(A) Merged UMAP plots of PBMCs from 4 healthy donors and 16 PDA patients (total of 70,113 cells). CD8 T cells (green), CD4 T cells (light green), NK cells (purple), pDCs (blue), Granulocyte (light orange), Monocyte (orange), B cells (yellow), Plasma cells (light yellow). (B) Dot plot analysis of key markers to define the 8 identified cell populations. Color of dot represents average expression, while the size of the dot represents percent expression. Dot plot represents merged healthy (n=4) and PDA (n=16) patient gene expression of PBMC lineage markers. (C) Average expression of immune checkpoint ligands and receptors in the identified cell populations in merged blood samples. (D) Average expression of immune checkpoint receptors on CD8+ T cells in merged PBMCs. (E) Average expression of differentially expressed genes in CD8+ T cells comparing healthy (black) to PDA (grey) PBMCs. Disease stage is plotted on the left.
Extended Data Figure 4.
Extended Data Figure 4.. Single cell RNA sequencing reveals 3 CD8+ T cell populations: effector, exhausted, and memory CD8+ T Cells.
(A) Feature plots of immune checkpoints (PDCD1, LAG3, TIGIT, HAVCR2), activation markers (IFNG, GZMB), and exhaustion markers (GZMK, EOMES) in CD8+ T cells. (B) Number of effector (pink), exhausted (green), and memory (blue) CD8+ T cells captured in each individual tissue sample by scRNA seq. (C) Average scaled expression heatmap of highly enriched genes by potential effector, exhausted, and memory cell populations. (n = 3 Adj/Norm tissue and n= 16 PDA tissue for panels A–C).
Extended Data Figure 5.
Extended Data Figure 5.. Single cell RNA sequencing of myeloid subsets in human pancreatic cancer.
(A) Violin Plots illustrating comparison of immune checkpoint ligands in myeloid clusters in PDA vs. adjacent normal/pancreas samples. (B) Average expression heatmap of checkpoint ligands in merged macrophages (all cells expressing CD68 within the myeloid population) and (C) merged granulocytes (all cells expressing FCGR3B within the myeloid population). Left panels denote disease state (adjacent/normal vs. PDA tissue) and stage. (D) Map of all putative ligand receptor differential interactions that are upregulated in 16 PDA compared to 3 adjacent/normal pancreas. The line color denotes cellular source of the ligand, and putative interactions were visualized in Cytoscape® V3.7.1. (E) Dot plot analysis showing expression of adenosine receptors in PDA tumor cell types. Red indicates high expression, blue low expression, and the size of the dot is relative to the percent that marker is expressed. Dot plot represent n=16 PDA patient gene expression of adenosine receptors.
Extended Data Figure 6.
Extended Data Figure 6.. CyTOF analysis of PBMCs from healthy, chronic pancreatitis, and PDA patients.
(A) Patient breakdown and characteristics of CyTOF performed on patient blood samples (n = 16 healthy patients, n = 10 chronic pancreatitis patients, and n=36 PDA patients). (B) t-SNE analysis of CyTOF of all merged PBMC samples with granulocytes (CD66b+). (C) t-SNE analysis of CyTOF of all merged PBMC samples without granulocytes. Key marker t-SNE feature plots of CD3 (total T cells), CD4 (Helper CD4+ T cells), CD8 (Cytotoxic T cells), CD19 (B cells), CD11b (Myeloid cells), CCR2, PDL-1, and CD68 (Macrophage marker). (D) Bar plots of relative cell type abundance (B cell, CD4+/CD8+ T cell, CD4+ T cell, CD4/CD8 T cell, Dendritic cell, CD14+/CD16+ Monocyte, CD14+/CD16 Monocyte, and CD14 CD16+ Monocyte) from CyTOF of PBMCs of healthy, chronic pancreatitis, and PDA patients. (E) Quantification of unbiased analysis (Astrolabe pipeline) of PBMC immune populations in n=16 healthy patients, n=36 PDA patients, and n=10 chronic pancreatitis patients. Two-sided Student’s t-tests were performed to compare between groups and a p value of <0.05 was considered significant. (F) Relative CyTOF marker expression in CD8+ T Cells from PDA tumor tissue. (G) PCA analysis of PBMCs at different disease states. Healthy (neon blue), PDA (red), and Chronic Pancreatitis (green).
Extended Data Figure 7.
Extended Data Figure 7.. Immunofluorescence of immune checkpoints in pancreatic tumors.
(A) Individual channels of immunofluorescent staining of patient tissues with antibodies specific for TIGIT/CD8A, TIGIT/FOXP3, PVR/Pan-cytokeratin, PVR/CD163, PVR/Vimentin, and PVR/VE-cadherin. Three individual patient tumors were examined independently per staining analysis. (B) Manual gating of PD-L1+ CD68+ macrophages in normal adjacent (n=8) and PDA (n=10) tissue. Two-sided Student’s t-test was performed, and asterisk indicates a p value of <0.05 was considered statistically significant. Representative individual CyTOF biaxial density plots from normal adjacent and PDA tissue of a matched patient (19–262) of PD-L1 expression in CD68+ macrophages (as a percentage of total CD11b+ cells).
Figure 1.
Figure 1.. CyTOF and multiplex fluorescent immunohistochemistry (mfIHC) mapping reveals heterogeneous immune infiltration in human pancreatic cancer.
(A) PCA analysis comparing intensity of marker staining of n=8 normal or adjacent pancreata tissue samples (blue) compared to n=9 PDA tumor samples (red). (B) Merged adj/norm panc (left) and PDA (right) t-SNE analysis of defined cell clusters from CyTOF analysis on tissue samples. The size of the dot represents the number of cells in the cluster. Each color represents a cell population: CD4 T cells (red), CD8 T cells (pink), B cells (blue), Myeloid (light orange), Macrophages (orange), CD45 cells (light purple), Unknown (purple). (C) Bar plot representation from FlowSOM CyTOF analysis of n=8 adj/norm tissue samples and n=9 PDA tumor samples. Analysis was only performed on samples with greater than 3,000 live singlets. (D) Manual quantitation of total immune cells (CD45+), myeloid cells (CD11b+), CD4+ T cells, CD8+ T cells, potential Tregs (CD4+ CD25+), and B cells. Manual gating included n=8 adj/norm patients and n=10 PDA patients per group. Asterisk denotes a p-value less than 0.05 determined by two-sided Student’s t-test. (E) Correlation plot of total CD11b+ myeloid cells compared to total CD8+ T cells. (F) mfIHC composite images of formalin-fixed, paraffin-embedded tissue specimens from four different patients with chronic pancreatitis (top row) and four patients with PDA (bottom row). Antibodies and colors are as follows: CD163 (orange), PD-L1 (magenta), Pancytokeratin (PanCK; white), CD3 (green), CD8 (yellow), FOXP3 (red), and DAPI (blue). (G) Comparison of cellular infiltration between n=34 chronic pancreatitis patients and n=71 PDA patients (P-values: Other 0.0001, CD163+ cells 0.020, CD8+ T cells 0.3483, Treg <0.0001, Epithelial <0.0001). (H) Correlation between percentage of CD8+ T cells and CD163+ cells in chronic pancreatitis and PDA.
Figure 2.
Figure 2.. Single cell RNA sequencing reveals heterogenous expression of immune checkpoints in PDA tissue.
(A) UMAP on 3 adjacent/normal pancreas (left) and 16 PDA patient (right) tissues. Populations identified as follows: acinar (pink), epithelial (red), fibroblasts (dark and light teal), CD8+ T cells (dark green), CD4+ T cells, (neon green), Tregs (light green), NK cells (purple), B cells (light blue), plasma cells (dark blue), mast cells (yellow), macrophages (dark orange), granulocytes (light orange), dendritic cells (brown), endothelial cells (dark pink), and endocrine (dark red). (B) Dot plot of key markers used to define the identified cell populations. Color of dot represents average expression, while the size of the dot represents percent expression. Dot plot represents merged n=3 adj/norm patients and n=16 PDA patients gene expression of lineage markers. (C) Average expression of immune checkpoint ligands and receptors in the identified cell populations in n=16 tumor tissue samples. (D) Average expression of immune checkpoint receptors on CD8+ T cells in n=16 PDA patients and n=3 adj/norm patients merged tissues. (E) Pathway annotations from gene set enrichment analysis (GSEA) using the R package clusterprofiler in n=16 PDA samples compared to n=3 adj/norm samples. The color of the bar represents the p-value adjusted for multiple comparisons using the Benjamini Hochberg method. Enrichment score is plotted on the x-axis. (F) Unbiased differential expression between CD8+ T cells from adj/norm pancreas (black) and PDA (grey). Significantly up- and down-regulated genes are plotted as average expression per patient. This analysis was performed on all CD8+ T cells found in the adjacent/normal and PDA tissue. Disease stage is plotted on the left: resectable (green), locally advanced (light green), borderline resectable (blue), metastatic (pink), N/A (light blue).
Figure 3.
Figure 3.. Single cell RNA sequencing reveals exhausted CD8+ T cell phenotype in PDA patients is defined by the immune checkpoint TIGIT.
(A) UMAP analysis of CD8+ T cells from n=3 adjacent/normal pancreas samples (left) and n=16 PDA tumors (right). The 6 identified subsets of CD8+ T cells were collapsed into potential memory (blue), effector (pink) and exhausted (green). (B) Single cell resolution heatmap analysis of top 10 genes for each identified CD8+ T cell subset. (C) Violin plots of normalized expression for selected markers mapped across the CD8+ T cell subsets. (D) Quantitation of potential exhausted (p=9.11E-6), effector (p=2.209E-5) and memory (p=0.0031) T cells in adjacent/normal pancreas and PDA patients, plotted as % total CD8+ T cells. Plots represent n=3 adj/norm and n=16 PDA patients. Two-sided Student’s t-test was performed to compare between groups and a p value of 0.05 or less was considered statistically significant. Panel of genes differentially expressed in (E) effector and (F) exhausted CD8+ T cells in PDA (red) compared to adjacent/normal pancreas (blue). Plots represent n=3 adj/norm and n=16 PDA patients. Violin plots are shown as normalized expression. All violin plots in (E) and (F) have an adjusted p-value of p<0.01 and are considered statistically significant.
Figure 4.
Figure 4.. Single cell RNA sequencing of pancreatic tissues reveals TIGIT is differentially expressed in NK cells from PDA patients and is a defining marker of Tregs.
(A) Merged UMAP of 5 identified subsets of NK cells from adjacent/normal pancreas (left) and PDA (right). Plots represent n=3 adj/norm and n=16 PDA patients. (B) Single cell resolution heatmap of each NK cell subset identified. Immune checkpoints (HAVCR2, TNFRSF4) are bolded. (C) Violin plots of normalized average expression within NK cell subsets demonstrating specific lineage markers for NK cells (such as NCAM1/FCGR3A) and immune checkpoint receptors. (D) Unbiased differential average expression of merged NK cells from adjacent/normal pancreas (black) and PDA (grey). Disease stage is plotted on the left. (E) Merged UMAP of all CD4+ T cells with 13 identified cell subsets. Naïve CD4+ T cells are denoted as Th0 (CCR7+) and Tregs as Tregs (FOXP3+). All other subsets are denoted as CD4 T cells. (F) Single cell resolution heatmap of each CD4+ T cell subset. Boxes on the left designate naïve CD4+ T cells (Th0) and the CD4+ T cell subsets that are defined by immune checkpoint expression (TIGIT, TNFRSF18, PDCD1). (G) Feature plots of CTLA4 and TIGIT in regulatory CD4+ T cells (outlined). In all panels, plots represent n=3 adj/norm and n=16 PDA patients.
Figure 5.
Figure 5.. Single cell RNA sequencing reveals distinct myeloid and dendritic cell subsets.
(A) Merged UMAP of 6 identified myeloid cell subsets in adjacent/normal pancreas (left) and PDA (right). (B) Single cell resolution heatmap of each myeloid cell subset identified. Boxes on the left designate the top expressing genes for each myeloid subset. (C) Selected feature plots of the immune checkpoints, LGALS9, CD274, PVR, CSF1R, SIRPA, HLA-DQA1 in myeloid cells. (D) Selected feature plots of markers that define alternatively activated macrophages, granulocytes, and total macrophage subsets (left) and violin plots of immune checkpoint ligands that are upregulated in PDA patients (right). (E) UMAP analysis of dendritic cells in merged normal/adjacent pancreas and PDA. (F) Top ten highly enriched gene signature analysis of dendritic cell subclusters identifying potential DC subsets, including plasmocytoid DCs (pDCs), Langerhans-like DCs (Lang_DCs), conventional DCs (cDCs), and activated DCs (Act_DCs). In all panels, plots represent n=3 adj/norm and n=16 PDA patients.
Figure 6.
Figure 6.. Predicted ligand receptor mapping in PDA patients demonstrate myeloid and non-immune cell types as sources of immune checkpoint ligands.
(A) Violin plots, where each dot represent a single cell, of select dendritic cell lineage markers across all 9 identified subsets. (B) Immune checkpoint ligand expression heatmap within dendritic subclusters. (C) Circos plot map of all putative ligand receptor interactions that are upregulated in PDA macrophages, (D) granulocytes, (E) dendritic cells, (F) endothelial cells (G) epithelial cells compared to adjacent/normal pancreas visualized by circos plot using the Circos software V0.69-9 (circos.ca). The heatmap within the circos plots is the scaled average expression of each gene within PDA tissue cell populations. The interactions plotted are those in which the expression level of either the ligand, the receptor, or both are increased in expression in PDA samples compared to adjacent/normal tissue. (H) Violin plots for the normalized expression of TIGIT, CD96, and CD226 in CD8+ T cells in PDA (red) compared to adjacent/normal pancreas (blue). Between adj/norm and PDA groups, the asterisk indicates P<0.0001, and exact P=4.8E-32. For Figure 6 panels A through H, n=3 adj/norm samples were examined and n=16 PDA patients were analyzed. (I) Dot plot analysis of TIGIT family members within PDAC tissue. Color of dot represents average expression, while the size of the dot represents percent expression. Dot plot represent n=16 PDA patients gene expression.
Figure 7.
Figure 7.. CyTOF and immunofluorescence protein validation of immune checkpoint expression in human pancreatic tissues and PBMCs.
Manual gating of CyTOF for immune checkpoints, including (A) TIGIT (n=8 adj/norm pancreas samples, n=10 PDA tumors), PD-1 (n=8 adj/norm pancreas samples, n=10 PDA tumors), and LAG3 (n=5 adj/norm pancreas samples, n=5 PDA tumors) in CD8+ T cells, (B) CTLA4 in CD4+ T cells (n=8 adj/norm pancreas samples, n=10 PDA tumors) and TIGIT in CD25+ CD4+ potential Tregs (n=8 adj/norm, n=10 PDA), and (C) CD56+ NK cells in n=5 adjacent/normal pancreas samples and n=4 PDA tumor tissues. In Figure 7A–C two-sided Student’s t-tests were performed and a p value of <0.05 was considered statistically significant. (D) Representative individual CyTOF biaxial density plots from normal adjacent and PDA tissue of a matched patient (19–262) of TIGIT expression in both CD8 T cells (as a percentage of total CD3+ cells) and CD25+ potential Tregs (as a percentage of CD4+ cells). (E) PDA patient tissues, where 3 individual patient tumors were examined independently per staining analysis, were stained with antibodies against TIGIT with either CD8A (CD8+ T cells) or FOXP3 (Tregs), and PVR with Pan-cytokeratin (epithelial cells), VE-cadherin (endothelial cells), CD163 (myeloid), or Vimentin (fibroblasts). (F) Quantitation of the percentage of CD8+ T cells (of total live cells) from CyTOF of healthy, PDA, and chronic pancreatitis patient PBMCs. Quantitation of PBMC CyTOF data represent n=16 healthy, n=36 PDA, and n=10 chronic pancreatitis patients. In the healthy versus chronic pancreatitis comparison, the n.s. P value = 0.0702. (G) TIGIT and PD-1 transformed protein expression within CD8+ T cells of healthy, PDA, and chronic pancreatitis patient PBMCs, and for the comparison between healthy and the chronic pancreatitis patients the n.s. P=0.1224. CTLA4 expression in CD4+ T cells of healthy (n=16), PDA (n=36), and chronic pancreatitis (n=10) patient PBMCs, and for the comparison between healthy and the chronic pancreatitis patients the n.s. P=0.1216. In Figure 7F–G two-sided Student’s t-tests were performed and a p value of <0.05 was considered statistically significant. (H) Representative biaxial plots of TIGIT expression in CD8+ T cells in the tumor tissue and matched blood of three PDA patients (1229, 1246, 3210). (I) Correlation of CyTOF data from PDA patient tissue versus matched PBMC CD8+ T cells expressing TIGIT and PD-1 (of total CD3+ cells).

References

References and Notes:

    1. RStudio Team (2015). RStudio: Integrated Development for R. RStudio, Inc, Boston, MA: URL http://www.rstudio.com/.
    1. R Core Team (2017). R: A language and environment for statistical computing. R Foundation for Statistical Computing, Vienna, Austria. URL https://www.R-project.org/.

References

    1. Royal RE, et al., Phase 2 trial of single agent Ipilimumab (anti-CTLA-4) for locally advanced or metastatic pancreatic adenocarcinoma. J Immunother, 2010. 33(8): p. 828–33. - PMC - PubMed
    1. Brahmer JR, et al., Safety and activity of anti-PD-L1 antibody in patients with advanced cancer. N Engl J Med, 2012. 366(26): p. 2455–65. - PMC - PubMed
    1. Stromnes IM, et al., T-cell Localization, Activation, and Clonal Expansion in Human Pancreatic Ductal Adenocarcinoma. Cancer Immunol Res, 2017. 5(11): p. 978–991. - PMC - PubMed
    1. Balli D, et al., Immune Cytolytic Activity Stratifies Molecular Subsets of Human Pancreatic Cancer. Clin Cancer Res, 2017. 23(12): p. 3129–3138. - PubMed
    1. Carstens JL, et al., Spatial computation of intratumoral T cells correlates with survival of patients with pancreatic cancer. Nat Commun, 2017. 8: p. 15095. - PMC - PubMed

Publication types

MeSH terms