Review
. 2021 Sep;2(3):031301.
doi: 10.1063/5.0050192. Epub 2021 Jul 13.

Coupling between cardiac cells-An important determinant of electrical impulse propagation and arrhythmogenesis

Affiliations
Review

Coupling between cardiac cells-An important determinant of electrical impulse propagation and arrhythmogenesis

André G Kléber et al. Biophys Rev (Melville). 2021 Sep.

Abstract

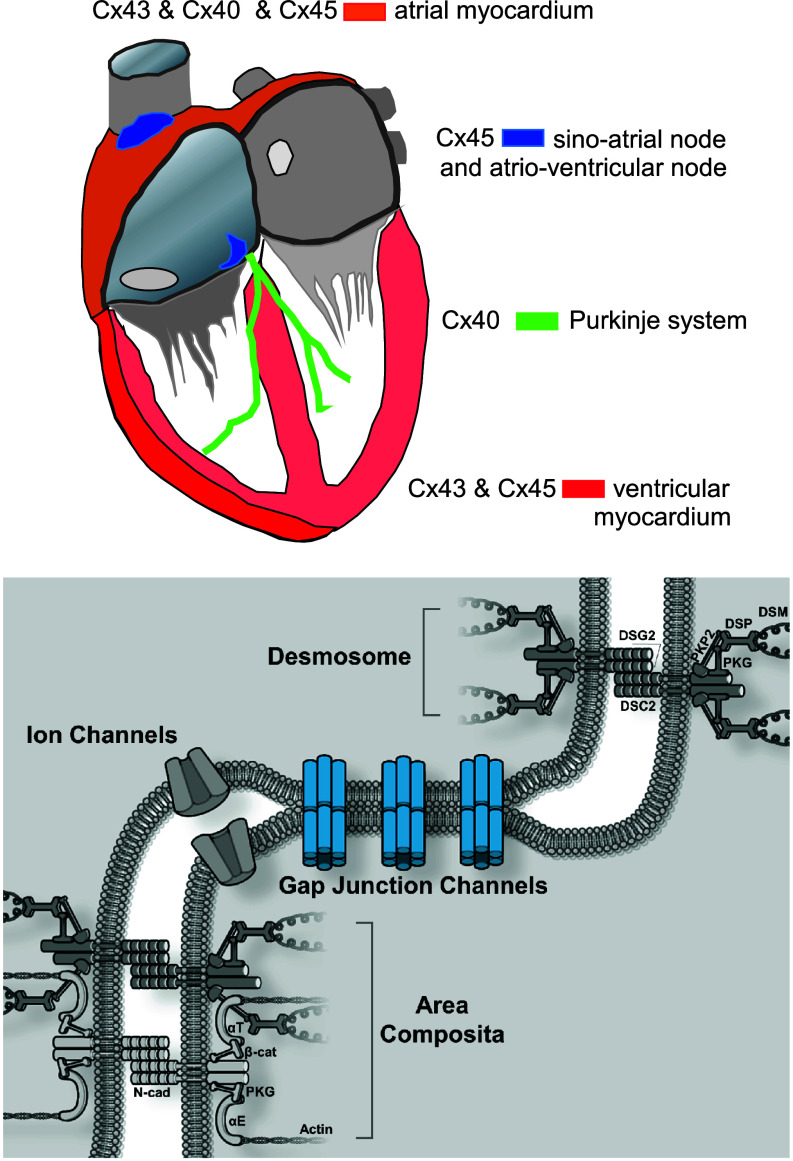
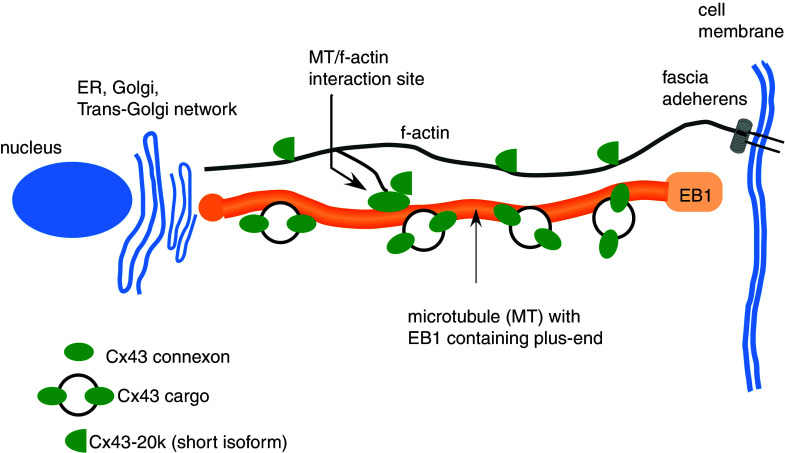
Cardiac arrhythmias are an important cause of sudden cardiac death-a devastating manifestation of many underlying causes, such as heart failure and ischemic heart disease leading to ventricular tachyarrhythmias and ventricular fibrillation, and atrial fibrillation causing cerebral embolism. Cardiac electrical propagation is a main factor in the initiation and maintenance of cardiac arrhythmias. In the heart, gap junctions are the basic unit at the cellular level that host intercellular low-resistance channels for the diffusion of ions and small regulatory molecules. The dual voltage clamp technique enabled the direct measurement of electrical conductance between cells and recording of single gap junction channel openings. The rapid turnover of gap junction channels at the intercalated disk implicates a highly dynamic process of trafficking and internalization of gap junction connexons. Recently, non-canonical roles of gap junction proteins have been discovered in mitochondria function, cytoskeletal organization, trafficking, and cardiac rescue. At the tissue level, we explain the concepts of linear propagation and safety factor based on the model of linear cellular structure. Working myocardium is adequately represented as a discontinuous cellular network characterized by cellular anisotropy and connective tissue heterogeneity. Electrical propagation in discontinuous cellular networks reflects an interplay of three main factors: cell-to-cell electrical coupling, flow of electrical charge through the ion channels, and the microscopic tissue structure. This review provides a state-of-the-art update of the cardiac gap junction channels and their role in cardiac electrical impulse propagation and highlights a combined approach of genetics, cell biology, and physics in modern cardiac electrophysiology.


Figures

FIG. 1.
FIG. 1.
Upper panel: Sketch illustrating the distribution of cardiac connexins Cx43, Cx40, and Cx45. Cx43 is the dominating connexin in the working myocardium of the ventricles, which in addition host small amounts of Cx45. Both left and right atria co-express Cx40, Cx43, and Cx45. The cells of the Purkinje system express Cx40. Cx45 dominates in both the sino-atrial and the atrio-ventricular nodes. Lower panel: Schematic presentation of the cardiac cell junction (ICD, intercalated disk). It includes four main components: gap junction channels, ion channels, desmosomes, and adherens junctions. Adherens junctions and desmosomes are situated at the sites perpendicular to the long axis of the cell, whereas gap junctions are preferentially located at sites parallel to the long axis. In mammalian hearts, adherens junctions and desmosomes can form combined junctions, termed area composita. N-cad: N-cadherin; PKG: plakoglobin (γ-catenin); PKP2: plakophilin-2; αE: αE-catenin; αT: αT-catenin; β-cat: β-catenin; DSC2: desmocollin-2; DSG2: desmoglein-2; DSP: desmoplakin; DSM: desmin (intermediate filament).
FIG. 2.
FIG. 2.
Changes of propagation velocity in engineered strands of cultured neonatal rat atrial myocytes and in human atrial tissue. Left: Genetic ablation of Cx43 in patterned cultures of neonatal mice atrial myocytes leads to a decrease in propagation velocity. Right: Genetic ablation of Cx40 in patterned cultures of neonatal mice atrial myocytes leads to an increase in propagation velocity. Reproduced with permission from P. Beauchamp et al., Circ. Res. 99, 11 (2006). Copyright 2006 Wolters Kluwer Health, Inc. Lower panel: Propagation velocity in excised human atrial tissue depends on the relative contribution of the Cx40 fluorescence signal to signals of total atrial connexins (sum of Cx43 and Cx40). Note that an increase in the relative contribution of Cx40 in human atria leads to a decrease in electrical propagation velocity, in line with the results from the mice cultures shown in the upper panel. Reproduced with permission from P. Kanagaratnam et al., J. Am. Coll. Cardiol. 39, 1 (2002). Copyright 2002 Elsevier.
FIG. 3.
FIG. 3.
Simplified scheme of Cx43 trafficking apparatus showing interaction sites of EB1-tipped microtubules with f-actin functioning as so-called “rest stops,” and Cx43-20k short isoforms involved in f-actin polymerization and MT/f-actin interaction.
FIG. 4.
FIG. 4.
Cellular turnover of connexin 43 in mice heart. Left panel: Pulse-chase assay reveals different half-lives of Cx43 signals in the triton-soluble (cytoplasmic, interrupted line) and triton-insoluble (membrane-bound, solid line) fractions of Cx43. Right panel: Half-lives of Cx43 in mice ventricular myocytes are about 3.5 h and 5 h for triton-soluble (cytoplasmic) and triton-insoluble (membrane-bound) fractions of Cx43 indicating very rapid turnover. Reproduced with permission from S. Xiao et al., J. Clin. Invest. 130, 9 (2020). Copyright 2020 American Society for Clinical Investigation.
FIG. 5.
FIG. 5.
Time course of internal longitudinal resistance, ri, in arterially perfused rabbit papillary muscle after induction of acute myocardial ischemia. In linear cable theory, ri corresponds to the intracellular cytoplasmic resistance and the cell-to-cell coupling resistance. The change of ri corresponds to the uncoupling of cells by closure of gap junction channels. Of note, cell-to-cell uncoupling in myocardial ischemia starts only after a peracute phase about 10 –15 min. Reproduced with permission from A. G. Kléber et al., Cir. Res. 61, 2 (1987). Copyright 1987 Wolters Kluwer Health, Inc.
FIG. 6.
FIG. 6.
Ephaptic impulse transmission. Panel (a): Electrical equivalent circuit of two cells (green) and the cell-to-cell junction in between. Each cell contains two excitable membrane elements (black, Luo-Rudy system of ion channels in parallel with membrane capacitance), connected by cytoplasmic resistors. The cell junction is modeled by (1) resistors representing gap junction channels formed by connexins (blue), (2) an excitable element representing ion channels located in the intercalated disk cell membrane (red), (3) a pair of cleft resistors, and (4) a radial resistor connecting the cleft to the extracellular space. This space is set to zero reference potential. Panel (b): Dependence of propagation velocity in a strand composed of cells modeled in panel (a). Propagation velocity is plotted against cleft width for a bundle of curves representing a decreasing degree (from top to bottom) of resistive coupling by gap junction channels. A biphasic behavior of propagation is observed for reduced resistive coupling < 30%. For very low degrees of coupling, propagation is preserved if cleft width is < 40 nm. Reproduced with permission from J. P. Kucera et al., Circ. Res. 91, 12 (2002). Copyright 2002 Wolters Kluwer Health, Inc.
FIG. 7.
FIG. 7.
Multiple C-terminal isoforms of connexin 43 occur in human heart. Left: Schematic presentation of the full connexin43 molecule with N-terminal, 4 transmembrane domains and C-terminal (green) and locations of the amino acid methionine (red dots). Methionines are coded by AUG sequences within in the RNA, which act as start codons for internal translation. As a consequence, whole-cell Western blots show the main band at 43kD corresponding to full length Cx43 and the multiple isoforms of different length sketched on the right side, GJA-32k, GJA-29k, GJA-26k, GJA-20k, GJA-11k, and GJA-7k. These isoforms are regulated independently of the full-length Cx43 and exert specific biological effects. Reproduced with permission from I. Epifantseva et al., BioChim. Biophy. Acta, Biomembr. 1860, 1 (2018). Copyright 2018 Elsevier.
FIG. 8.
FIG. 8.
Linear excitable cable [panel (a)] and ion current flow [panel (b)] in one excitable element. Panel (a): Cylindrical excitable cable showing propagating wavefront with an upstream excited segment and downstream resting segment. The excited segment has a positive membrane potential (voltage difference between the inside of the cellular compartment and the outside reference). The downstream non-excited portion has a negative membrane potential. A loop of so-called “local current” or electrotonic current is set up and acts to excite the downstream segment and to propagate the electrical impulse. Of note, the electrical resistivity of the inside medium is not re-partitioned into cytoplasmic and cell-to-cell resistance in this model. Panel (b): An electrical equivalent circuit of a continuous model is depicted on the top with five excitable elements residing in the cell membrane. The intracellular space is represented by a single resistor. The exchange of electrical charge is shown on the lower part. Axial current, IA, initially flows from upstream sites into the membrane. During this phase, membrane current, IM, shifts the membrane potential, VM, to more positive values, toward the threshold of Na+ inward current. The subsequent peak and rapid change of IM reflects the activation of Na+ channels, illustrated by Iion. Flow of ionic current, Iion, charges the membrane capacitance, thereby producing the action potential. It also changes the sign of flow of the axial current, which now represents charge furnished by channel excitation and flowing into the downstream sink.
FIG. 9.
FIG. 9.
Electrical propagation at the cellular level. Panels (a)–(c): Propagation in a chain of a single cells [neonatal rat ventricular myocytes, panel (a) with dark dots showing locations of three light-sensitive diodes (6 μm in width)]. Two diodes are projected on the cytoplasm of a single cell; the third diode is placed in the adjacent cell, separated from the other diodes by a single cell junction. Panel (b) shows the change in fluorescence of a voltage-sensitive dye representing the action potential upstrokes. Panel (c): Cytoplasmic and cell-to-cell conduction times illustrating that a single cell-to-cell junction introduces a propagation delay of about 60 μs. Panels (d)–(f): Propagation in an anisotropic cellular network [panel (d)] with dark dots showing locations of light-sensitive diodes (6 μm in width). Panel (e): Fluorescence changes illustrating action potential upstrokes from the three diodes. Panel (f): In contrast to panel (c), there are no detectable propagation delays introduced by cell-to-cell junctions. Comparison of panels (c) and (f) indicates that lateral apposition of cells cancels delays produced by single cell-to-cell junctions (so-called “lateral averaging”). Reproduced with permission from V. G. Fast et al., Cir. Res. 73, 5 (1993). Copyright 1993 Wolters Kluwer Health, Inc.
FIG. 10.
FIG. 10.
Simulated effects of gap junction distribution and cell size on cell-to-cell propagation delay and maximal upstroke velocity (dV/dtmax) of the transmembrane action potential. Panels (a) and (b) show four different cell types, two real cell types, and two fictive cell types. Cell type a corresponds to real dog ventricular myocyte of relatively large size with gap junctions predominantly at cell ends. Cell type b corresponds to a fictive myocyte of the size of a dog cell, but with gap junctions distributed regularly around the cell perimeter, typical for a rat neonatal ventricular myocyte. Cell type c corresponds to a fictive myocyte that has the small size of a rat ventricular myocyte, with gap junctions located predominantly at cell end (dog pattern). Cell type d represents a real rat neonatal ventricular myocyte with a relatively small size and gap junctions spaced regularly around the cell perimeter. Comparison of all four cell types illustrates that cell-to-cell propagation delays [panel (a)] and the maximal upstroke velocity of the transmembrane action potential [panel (b)] predominantly depend on cell size, whereas the gap junction distribution patterns play a minor role. Reproduced with permission from M. S. Spach et al., Circ. Res. 86, 3 (2000). Copyright 2000 Wolters Kluwer Health, Inc.
FIG. 11.
FIG. 11.
Safety factor (SF) of propagation and propagation velocity (PV) in a linear strand of simulated cells. Successful propagation and margin of safety are defined as SF >1 [see Eq. (1)]. Panel (a): Dependence of SF on cell-to-cell coupling. Note logarithmic scale on the abscissa. Of note, SF increases with cell-to-cell coupling until rapid block develops at high levels of uncoupling. The increase in SF is due to the decrease strand impedance following an increase in cell-to-cell resistance. Thus, partial cell-to-cell coupling protects propagation from being blocked, while at the same time decreasing propagation velocity. Panel (b): Decrease of SF with inhibition of Na+ channel conductance. Such inhibition could be due, for instance, to drug inhibition (antiarrhythmic drugs), genetic remodeling or reducing the availability of Na+ channels (ischemia). As a main difference between Panels (a) and (b), cell-to-cell uncoupling preserves propagation down to very slow conduction (≤10 cm/s), whereas block due to Na” channels inhibition occurs abruptly at velocities of > 15 cm/s. Reproduced with permission from R. M. Shaw et al., Circ. Res. 81, 5 (1997). Copyright 1997 Wolters Kluwer Health, Inc.
FIG. 12.
FIG. 12.
Discontinuous structure of the myocardium. Panel (a): Reconstructed volume of rat left myocardium shows complex arrangement of cleavage with each layer being 80 μm in thickness. Reproduced with permission from D. A. Hooks et al., Circ. Res. 91, 4 (2002). Copyright 2002 Wolters Kluwer Health, Inc. Panel (b): Connective tissue sheets separating human myocardial muscle bundles in atrial pectinate muscle. These connective tissue sheets are typically found in tissue from aged but not from young individuals. Reproduced with permission from M. S. Spach et al., Circ. Res. 58, 3 (1986). Copyright 1986 Wolters Kluwer Health, Inc.
FIG. 13.
FIG. 13.
Simulation of electrical propagation across a site of source-to-sink mismatch. Panels (a)–(c): Action potentials propagate from a small strand of 200 μm in width into a large bulk. As a consequence of source-to-sink mismatch and dispersion of local current, isochrones beyond the geometrical transition are curved [panel (a)]. Local propagation velocity computed along the main axis (locations 1–16) shows a significant local decrease reflecting the source-to-load mismatch and the current dispersion. The same events produce the transient decrease in action potential upstrokes shown in panel (c) from sites 1 to 16. Panels (d)–(f): Action potentials propagate from a small strand of 175 μm in width into a large bulk. The smaller source, as compared to panels (a)–(c), produces propagation block at the transition. This can be detected from the absence of isochrones in the bulk [panel (d)] and the flow of inward sodium current (INa) beyond location in panel (e). In panel (f), action potential upstrokes are reflecting decremental propagation from locations 1 to 9. The voltage changes beyond diode 9 (site of block) are due to electrotonic spread and not associated with ion channel activation (interrupted lines). Reproduced with permission from V. G. Fast et al., Cardiovasc. Res. 30, 3 (1995). Copyright 1995 Oxford University Press.
FIG. 14.
FIG. 14.
Effect of maximal conductance of Na+ channels, gNamax, on propagation across a tissue expansion (see also Fig. 13). The ordinate shows the critical strand width, hc, at which propagation block, illustrated in Fig. 13, occurs. At gNama ≤ 50 mS/cm2 propagation becomes very sensitive to small changes in conductance. Reproduced with permission from V. G. Fast et al., Cardiovasc. Res. 30, 3 (1995). Copyright 1995 Oxford University Press.
FIG. 15.
FIG. 15.
Frequency dependence of propagation and propagation block at a so-called “isthmus,” a site of source-to-sink mismatch. Panel (a): Scheme of a small cleft (interruption of dark vertical line) produced in a sheet of subepicardial tissue form sheep ventricle. Source-to-sink mismatch is characterized by curved spread of propagation beyond the obstacle. Panel (b): Decrease of propagation velocity with decreasing cleft width (corresponding to increasing source-to-sink mismatch). Panel (c): Frequency dependence of propagation block at the isthmus. At a basic cycle length (BCL) = 500 ms (corresponding to a stimulation rate of 2 Hz), 1:1 propagation is preserved down to an isthmus width of 0.5 mm. At BCL of 150 ms (corresponding to a stimulation rate of 6.66 Hz), propagation block starts to develop at isthmus widths < 2 mm. Reproduced with permission from C. Cabo et al., Circ. Res. 75, 6 (1994). Copyright 1994 Wolters Kluwer Health, Inc.
FIG. 16.
FIG. 16.
Role of Ca2+ inward current, ICa,L, in discontinuous propagation. Panel (a) depicts in the top part anterograde propagation from a small strand (light photosensitive diodes) into a bulk area (dark diodes) and in the bottom part retrograde propagation from the bull into the small strand. Signals are obtained from the fluorescence change of a voltage-sensitive dye in patterned neonatal rat myocytes. Panel (b) shows propagation during control. During anterograde propagation, the source-to-load mismatch produces a conduction delay at the transition of about 2 ms. During retrograde propagation, this delay is absent, because the cells in the strand receive excitatory current from a large bulk. Instead, the cells in the strand are excited almost simultaneously. Panel (c) shows the effect of superfusion of the small strand with Nifedipine, a blocker of ICa,L. Propagation from the small strand into the bulk becomes totally blocked. This demonstrates that ICa,L is needed to drive propagation across the geometrical expansion. The fact that Nifedipine has no effect on propagation in reverse direction proves that the source-to-load mismatch, a structural component, requires flow of ICa,L. Reproduced with permission from S. Rohr et al., Biophys. J. 72, 2 (1997). Copyright 1997 Elsevier.
FIG. 17.
FIG. 17.
Interaction between cell-to-cell coupling and discontinuous propagation. Panel (a): Effect of partial cell-to-cell uncoupling on source-sink mismatch at a site of a tissue discontinuity. Aj: Picture of an engineered culture of neonatal rat ventricular myocytes with a narrow strand (width 50 μm) and transition to a bulk. Ajj: Propagation from the strand into the bulk produces propagation block at the transition. Excited cells (positive membrane potential) are depicted in red, tissue at resting potential level in blue. Propagation from the street to the bulk is blocked, because of source-to-load mismatch. Ajjj: Partial uncoupling with palmitoleic acid restores propagation. Ajv: Total uncoupling produces propagation block. Reproduced with permission from S. Rohr et al., Science 275, 5301 (1997). Copyright 1997 American Association for the Advancement of Science. Panel (b): Sketch explaining the biophysical mechanism: The simplified electrical equivalent circuit shows excitable elements (cells) in green, intercellular resistors representing gap junctions in the x-direction in black, and intercellular resistors representing gap junctions in the y-direction in red. Panel (c): Numerical presentation of the dependence of the critical strand width hc, producing propagation block, on cell-to-cell coupling (expressed as intercellular resistance). Hatched area corresponds to propagation block. An increase in coupling resistance, Ry, facilitates propagation, whereas changing Rx has no effect on block formation. This phenomenon is explained by the fact that the only an increase in Ry- resistors reduce the dispersion of current at the geometrical transition. Reproduced with permission from V. G. Fast et al., Cardiovasc. Res. 30, 3 (1995). Copyright 1995 Oxford University Press.

References

    1. Morin D. P., Homoud M. K., and Estes N. A. M. III, Card. Electrophysiol. Clin. 9, 631 (2017).10.1016/j.ccep.2017.07.012 - DOI - PubMed
    1. Chugh S. S., Havmoeller R., Narayanan K., Singh D., Rienstra M., Benjamin E. J., Gillum R. F., Kim Y. H., J. H. McAnulty, Jr. , Zheng Z. J., Forouzanfar M. H., Naghavi M., Mensah G. A., Ezzati M., and Murray C. J., Circulation 129, 837 (2014).10.1161/CIRCULATIONAHA.113.005119 - DOI - PMC - PubMed
    1. Kléber A., Janse M., and Fast V., “ Normal and abnormal conduction in the heart,” in The Handbook of Physiology. The Cardiovascular System. The Heart ( Oxford University Press, 2002), Vol. I, p. 455.
    1. Weidmann S., J. Physiol. 118, 348 (1952).10.1113/jphysiol.1952.sp004799 - DOI - PMC - PubMed
    1. Weidmann S., J. Physiol. 187, 323 (1966).10.1113/jphysiol.1966.sp008092 - DOI - PMC - PubMed

LinkOut - more resources