

Multiscale model of hepatitis C virus dynamics in plasma and liver following combination therapy
- PMID: 34296543
- PMCID: PMC8376145
- DOI: 10.1002/psp4.12604
Multiscale model of hepatitis C virus dynamics in plasma and liver following combination therapy
Abstract
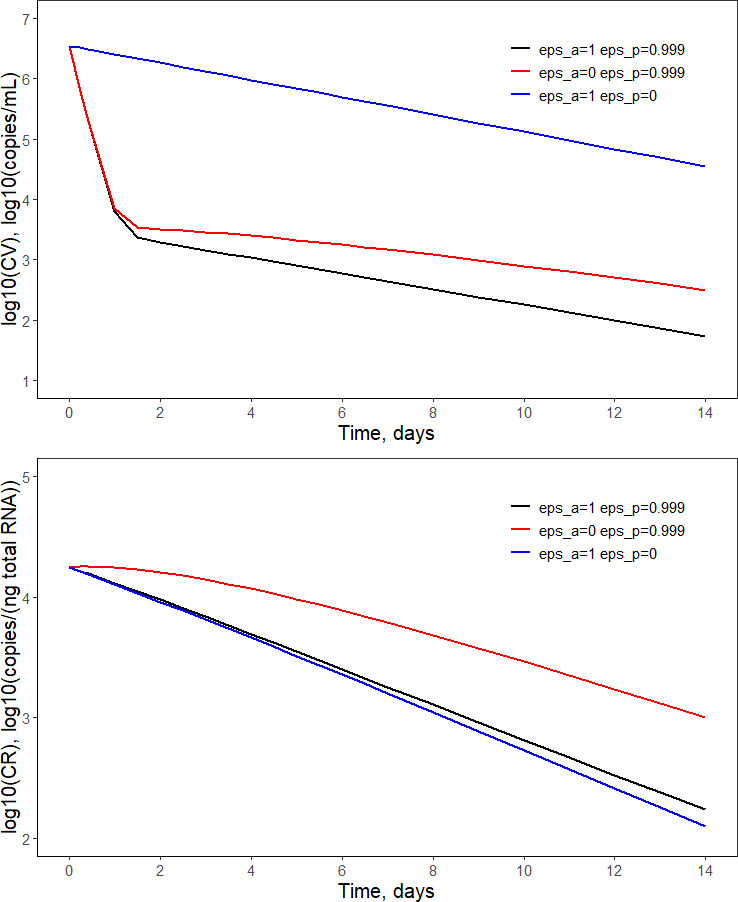
This work explores the application of a physiologically structured population (PSP) framework in modeling hepatitis C virus (HCV) kinetics. To do so, a model was developed for the viral RNA load in plasma and liver as observed in 15 patients treated with a combination therapy of pegylated interferon, ribavirin, and telaprevir. By including both intracellular and extracellular processes of the HCV lifecycle, the model provided a description of the treatment effect on the intracellular HCV lifecycle. Combining PSP models with a nonlinear mixed effects approach in a single model permits a natural inclusion of the direct-acting antiviral effect on intracellular processes, which can then be integrated with the viral kinetics within the host while accounting for the interindividual variability between patients. This should allow an exploration of the treatment effect within the entire chronic HCV-infected population.
© 2021 The Authors. CPT: Pharmacometrics & Systems Pharmacology published by Wiley Periodicals LLC on behalf of American Society for Clinical Pharmacology and Therapeutics.
Conflict of interest statement
Authors X.W., A.V., and J.J.P.‐R. were employees and shareholders of Janssen Pharmaceutical Companies at the time this analysis was conducted. W.K. declared no competing interests for this work.
Figures


Similar articles
-
Modeling population heterogeneity in viral dynamics for chronic hepatitis C infection: Insights from Phase 3 telaprevir clinical studies.J Pharmacokinet Pharmacodyn. 2015 Dec;42(6):681-98. doi: 10.1007/s10928-015-9435-z. Epub 2015 Aug 20. J Pharmacokinet Pharmacodyn. 2015. PMID: 26289844
-
A decade of hepatitis C at the University of Cape Town/Groote Schuur Hospital Liver Clinic, South Africa, in the pre-direct-acting antivirals era.S Afr Med J. 2020 Jan 29;110(2):106-111. doi: 10.7196/SAMJ.2020.v110i2.14208. S Afr Med J. 2020. PMID: 32657679
-
Telaprevir can be successfully and safely used to treat older patients with genotype 1b chronic hepatitis C.J Hepatol. 2013 Aug;59(2):205-12. doi: 10.1016/j.jhep.2013.03.020. Epub 2013 Mar 28. J Hepatol. 2013. PMID: 23542346 Clinical Trial.
-
[Clinical use of telaprevir: stopping rules, predicting response, treatment length, and management of adverse effects].Enferm Infecc Microbiol Clin. 2013 Jul;31 Suppl 3:19-25. doi: 10.1016/S0213-005X(13)70120-4. Enferm Infecc Microbiol Clin. 2013. PMID: 24063899 Review. Spanish.
-
Viral kinetics in the treatment of chronic hepatitis C.J Viral Hepat. 2006 Aug;13(8):499-504. doi: 10.1111/j.1365-2893.2006.00715.x. J Viral Hepat. 2006. PMID: 16901279 Review.
Cited by
-
A multiscale model of the action of a capsid assembly modulator for the treatment of chronic hepatitis B.PLoS Comput Biol. 2025 May 6;21(5):e1012322. doi: 10.1371/journal.pcbi.1012322. eCollection 2025 May. PLoS Comput Biol. 2025. PMID: 40327725 Free PMC article.
References
MeSH terms
Substances
LinkOut - more resources
Full Text Sources
Miscellaneous
