. 2021 Jul 27;5(14):2863-2878.
doi: 10.1182/bloodadvances.2020003871.

Mantle cell lymphoma polarizes tumor-associated macrophages into M2-like macrophages, which in turn promote tumorigenesis

Affiliations

Mantle cell lymphoma polarizes tumor-associated macrophages into M2-like macrophages, which in turn promote tumorigenesis

Kang Le et al. Blood Adv. .

Abstract

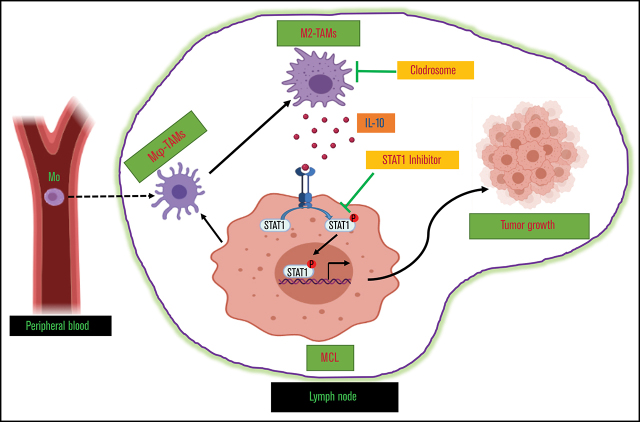
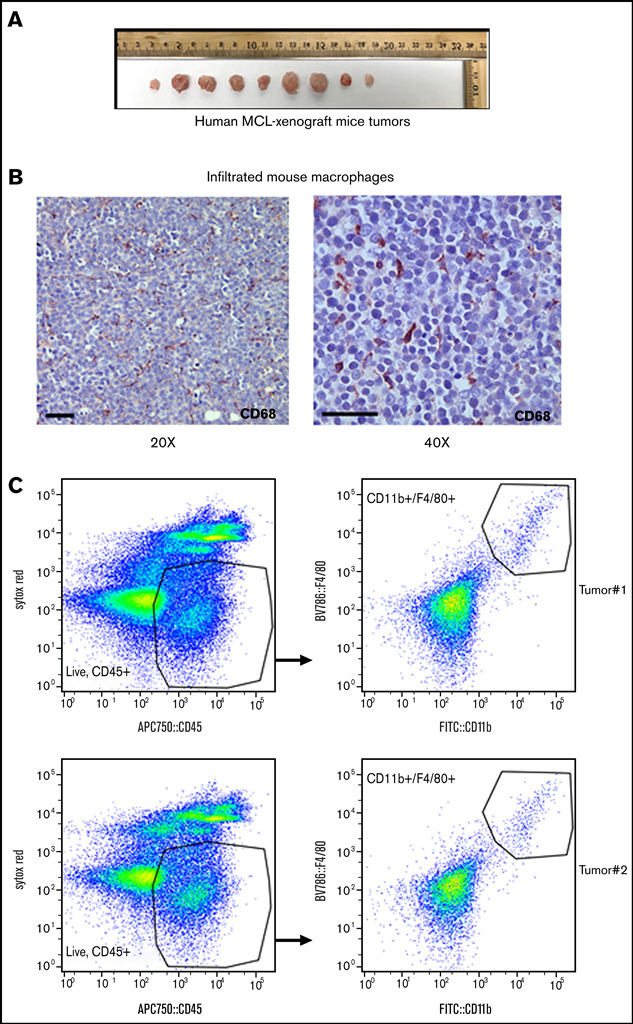
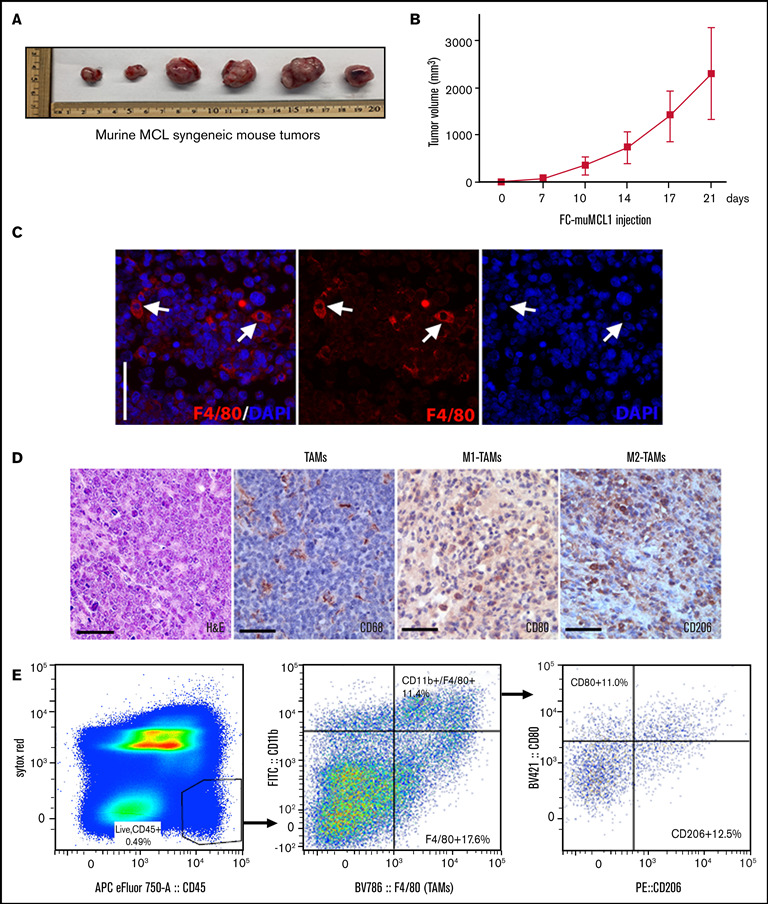
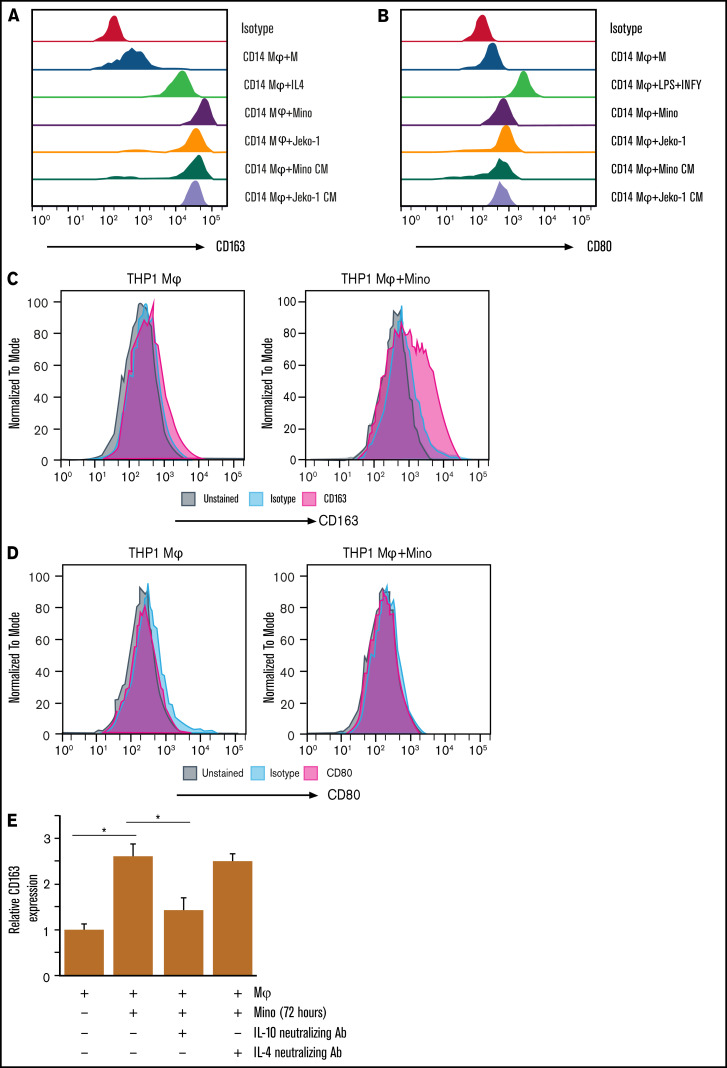
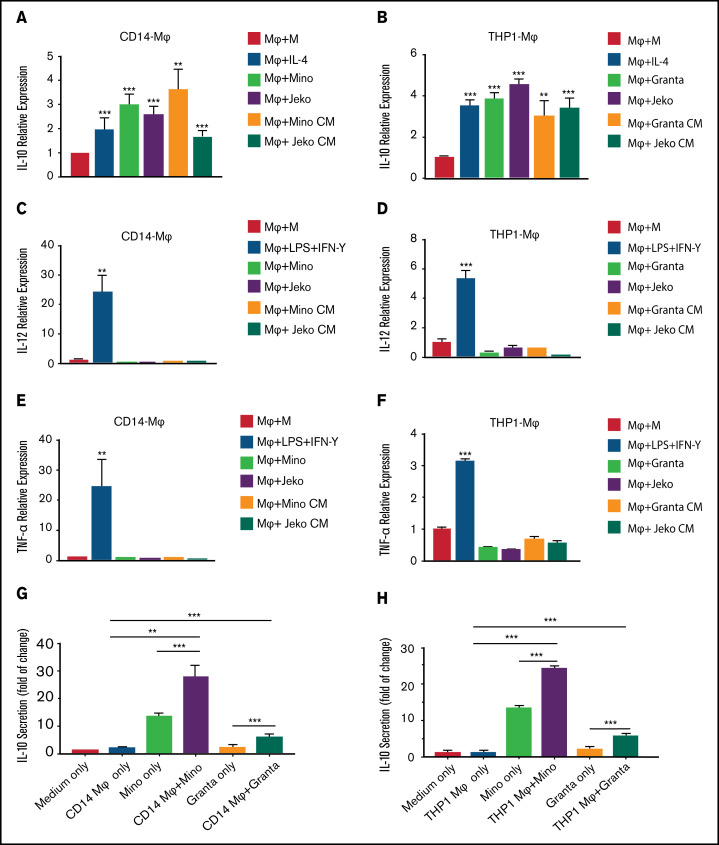
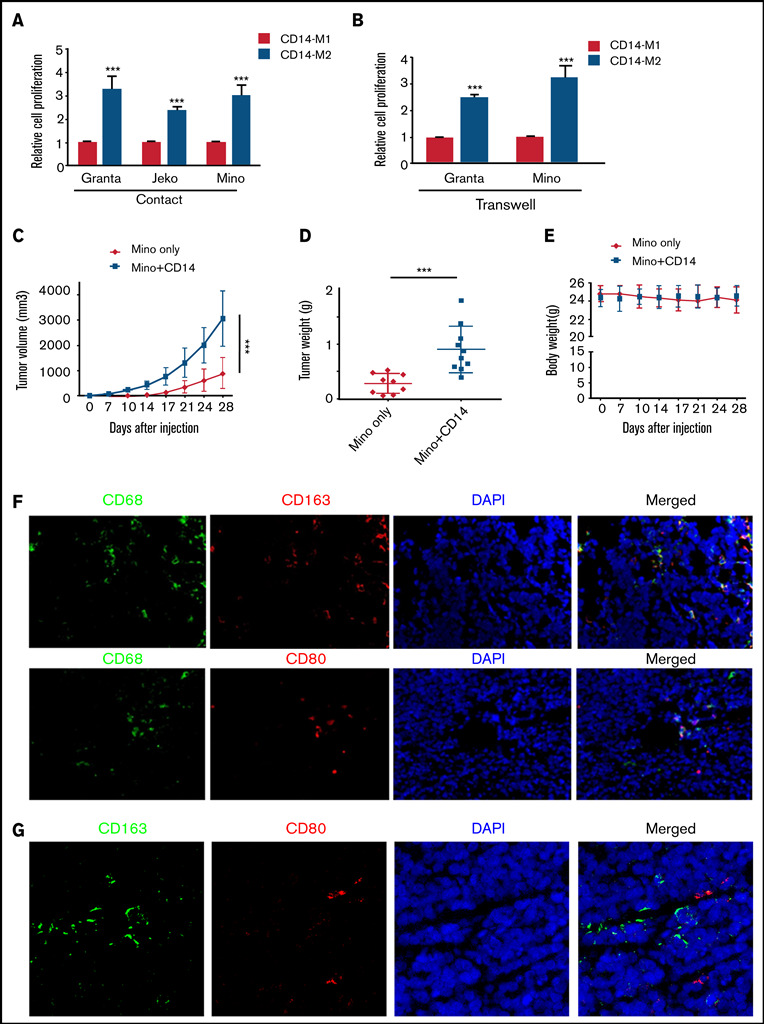
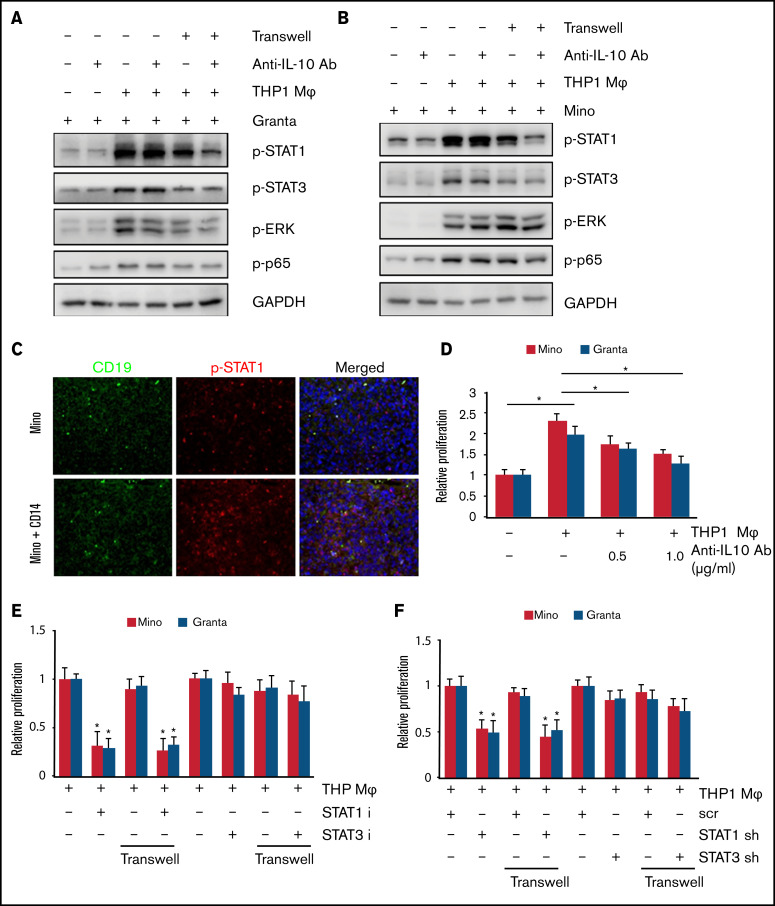
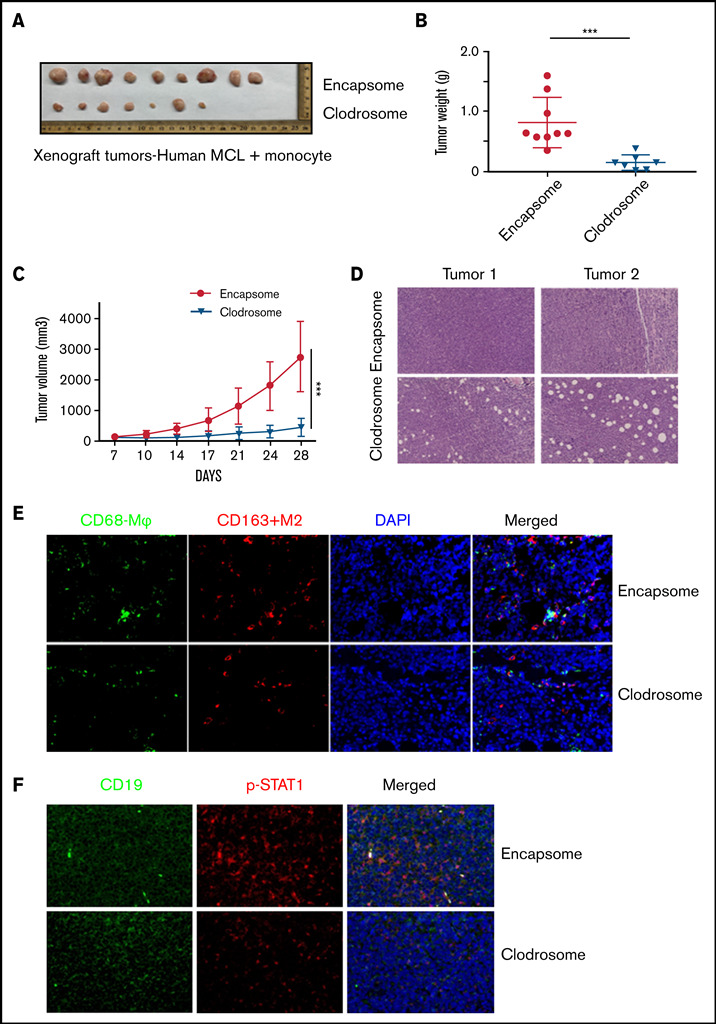
Tumor-associated macrophages (TAMs) are recognized as a hallmark of certain solid cancers and predictors of poor prognosis; however, the functional role of TAMs in lymphoid malignancies, including B-cell lymphoma, has not been well defined. We identified infiltration of F4/80+ TAMs in a syngeneic mouse model using the recently generated murine mantle cell lymphoma (MCL) cell line FC-muMCL1. Multicolor flow cytometric analysis of syngeneic lymphoma tumors showed distinct polarization of F4/80+ TAMs into CD206+ M2 and CD80+ M1 phenotypes. Using human MCL cell lines (Mino, Granta, and JVM2), we further showed that MCL cells polarized monocyte-derived macrophages toward an M2-like phenotype, as assessed by CD163+ expression and increased interleukin-10 (IL-10) level; however, levels of the M1 markers CD80 and IL-12 remained unaffected. To show that macrophages contribute to MCL tumorigenesis, we xenografted the human MCL cell line Mino along with CD14+ monocytes and compared tumor growth between these 2 groups. Results showed that xenografted Mino along with CD14+ monocytes significantly increased the tumor growth in vivo compared with MCL cells alone (P < .001), whereas treatment with liposomal clodronate (to deplete the macrophages) reversed the effect of CD14+ monocytes on growth of MCL xenografts (P < .001). Mechanistically, IL-10 secreted by MCL-polarized M2-like macrophages was found to be responsible for increasing MCL growth by activating STAT1 signaling, whereas IL-10 neutralizing antibody or STAT1 inhibition by fludarabine or STAT1 short hairpin RNA significantly abolished MCL growth (P < .01). Collectively, our data show the existence of a tumor microenvironmental network of macrophages and MCL tumor and suggest the importance of macrophages in interventional therapeutic strategies against MCL and other lymphoid malignancies.


Figures

None
Graphical abstract
Figure 1.
Figure 1.
Macrophage infiltration into the MCL xenograft mouse model. (A) NOD/SCID mice were subcutaneously injected with 5 × 10⁶ human MCL cell line Mino, and tumor size is shown after monitoring for 21 days. n = 9 tumors. (B) Macrophage infiltration in the MCL xenograft tumor was assessed by staining tumor sections with anti-CD68, and immunohistochemistry was performed. (C) Infiltrating mouse macrophages (F4/80+/CD11b+) into MCL xenograft tumors were shown by flow analysis as indicated.
Figure 2.
Figure 2.
Characterization of TAMs into murine MCL syngeneic mouse model. Immunocompetent C57BL/6 mice were subcutaneously injected with 5 × 10⁶ FC-muMCL1 murine MCL cell line, and images of syngeneic MCL tumors after 21 days (A) and tumor growth curves (B) of the FC-muMCL1 syngeneic tumors are shown (data are presented as mean ± standard deviation; n = 6 mice/group). (C) Immunofluorescent staining was performed on the MCL mouse syngeneic tumors using F4/80 (red) antibody. Nuclei were stained with 4′,6-diamidino-2-phenylindole (DAPI) (blue). (D) Immunohistochemistry was performed on the MCL mouse syngeneic tumors by using specific antibodies against CD68, CD80, and CD206. (E) Dot plots of macrophage populations (CD11b+/F4/80+ and CD80/CD206) with in the MCL mouse syngeneic tumors shown by flow analysis. All staining was performed on at least 2 to 3 mouse tumors, and a representative image is shown. H&E, hematoxylin and eosin.
Figure 3.
Figure 3.
MCL cell interaction with macrophages induces M2 phenotype in coculture system. The surface expression of CD163 (A) and CD80 (B) in CD14-Mφ was measured by flow cytometry after treatment with cytokines (IL-4 or lipopolysaccharide (LPS) plus IFN-γ) or CM collected from Mino or Jeko cells or coculturing with Mino or Jeko. The surface expression of CD163 (C) or CD80 (D) in THP-1-Mφ was measured by flow cytometry after coculturing with Mino cells. (E) CD163 expression was measured in the Mino cell lines after coculturing with THP-1-Mφ with or without IL-10 or IL-4 neutralizing antibodies. Experiments were repeated 3 times, and a representative experiment is shown. *P < .05. Ab, antibody.
Figure 4.
Figure 4.
MCL cells modulate cytokine expression in the macrophages. The mRNA expression of IL-10 in CD14-Mφ (A) or THP-1-Mφ (B) was measured by qRT-PCR after direct coculturing with Mino, Granta, or Jeko or treatment with MCL CM or cytokine stimulation. IL-12 (C-D) and TNF-α (E-F) expression was measured in CD14+-Mφ or THP-1-Mφ after direct coculturing with Mino, Granta, or Jeko cells or treatment with MCL CM or cytokine stimulation. IL-10 secretion was measured by enzyme-linked immunosorbent assay in the supernatant of cocultured media from CD14-Mφ (G) or THP-1-Mφ (H) with Mino and Granta cells. Data are presented as mean ± standard deviation from 3 separate experiments. **P < .01, ***P < .001.
Figure 5.
Figure 5.
Macrophages/monocytes increased the MCL growth in vitro and in vivo. MCL cell proliferation was measured by MTT assay after direct (A) or indirect (B) coculture using transwell inserts with CD14+ polarized M1-Mφ or M2-Mφ. Mino alone (5 × 10⁶) or Mino + CD14+monocytes (5 × 10⁶, 1:1) were implanted subcutaneously into the flank of male NOD/SCID mice, and tumor size (C), tumor weight (D), and body weight (E) were measured (n = 9 mice). (F) Immunofluorescent staining was performed on the MCL + CD14+ xenograft tumors using CD68 (green) and CD163/CD80 (red) antibodies. Nuclei were stained with 4′,6-diamidino-2-phenylindole (DAPI) (blue). (G) Immunofluorescent staining was performed on the MCL + CD14+xenograft tumors using CD163 (green) and CD80 (red) antibodies. Nuclei were stained with DAPI (blue). Experiments were performed on 3 tumors, and a representative experiment is shown. ***P < .001.
Figure 6.
Figure 6.
M2 macrophage increased MCL growth via STAT1 signaling. STAT1, STAT3, ERK, and p65 phosphorylation in Granta (A) and Mino (B) cells was measured after direct or indirect coculturing with THP-1-Mφ with or without IL-10 neutralizing antibody. (C) Immunofluorescence staining showing CD19 and p-STAT1 staining in the Mino or Mino + CD14 inoculated MCL xenograft tumors (n = 3). (D) Cell proliferation in Mino and Granta was measured by MTT assay after coculturing with THP-1-Mφ with or without IL-10 neutralizing antibody. Cell proliferation in Mino and Granta was measured by MTT assay after direct or indirect coculturing with THP-1-Mφ with or without STAT1 and STAT3 inhibitor (E) or STAT1 and STAT3 shRNA (F). Data are presented as mean ± standard deviation from 3 separate experiments. *P < .05. GAPDH, glyceraldehyde-3-phosphate dehydrogenase.
Figure 7.
Figure 7.
Macrophage depletion abolished the MCL tumor growth in vivo. Tumor size (A), tumor weight (B), and growth kinetics (C) of Mino + CD14+ monocytes (5 × 10⁶, 1:1) implanted subcutaneously into the flank of male NOD/SCID mice with and without 200 µL (5 mg/mL) of Clodrosome or Encapsome (vehicle control) injection. Data are presented as mean ± standard deviation; n = 7 tumors. (D) Hematoxylin and eosin staining of the Clodrosome-treated and untreated mouse xenograft samples. (E) Immunofluorescence showing CD68 and CD163 staining in the Clodrosome- and control-treated mice group. (F) Immunofluorescence staining showing CD19 (green) and p-STAT1 (red) staining in the Clodrosome- and control-treated groups. Data were repeated in 2 mouse tumors, and a representative image is shown. ***P < .001.

References

    1. Kumar A, Sha F, Toure A, et al. Patterns of survival in patients with recurrent mantle cell lymphoma in the modern era: progressive shortening in response duration and survival after each relapse. Blood Cancer J. 2019;9(6):50. - PMC - PubMed
    1. Sandoval-Sus JD, Sotomayor EM, Shah BD.. Mantle cell lymphoma: contemporary diagnostic and treatment perspectives in the age of personalized medicine. Hematol Oncol Stem Cell Ther. 2017;10(3):99-115. - PubMed
    1. Rodgers TD, Reagan PM.. Targeting the B-cell receptor pathway: a review of current and future therapies for non-Hodgkin’s lymphoma. Expert Opin Emerg Drugs. 2018;23(2):111-122. - PubMed
    1. Valla K, Flowers CR, Koff JL.. Targeting the B cell receptor pathway in non-Hodgkin lymphoma. Expert Opin Investig Drugs. 2018;27(6):513-522. - PMC - PubMed
    1. Younes A. Beyond chemotherapy: new agents for targeted treatment of lymphoma [published correction appears in Nat Rev Clin Oncol. 2011;8(3):124]. Nat Rev Clin Oncol. 2011;8(2):85-96. - PMC - PubMed

Publication types