. 2021 Aug 4;143(30):11751-11758.
doi: 10.1021/jacs.1c05376. Epub 2021 Jul 23.

Fast Ion-Chelate Dissociation Rate for In Vivo MRI of Labile Zinc with Frequency-Specific Encodability

Affiliations

Fast Ion-Chelate Dissociation Rate for In Vivo MRI of Labile Zinc with Frequency-Specific Encodability

Nishanth D Tirukoti et al. J Am Chem Soc. .

Abstract

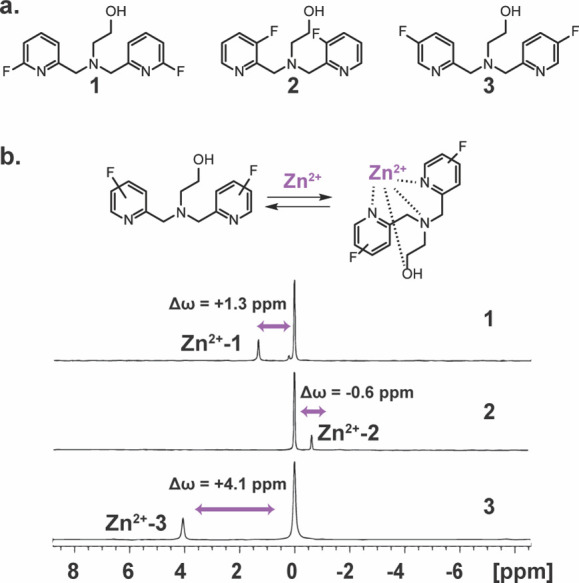
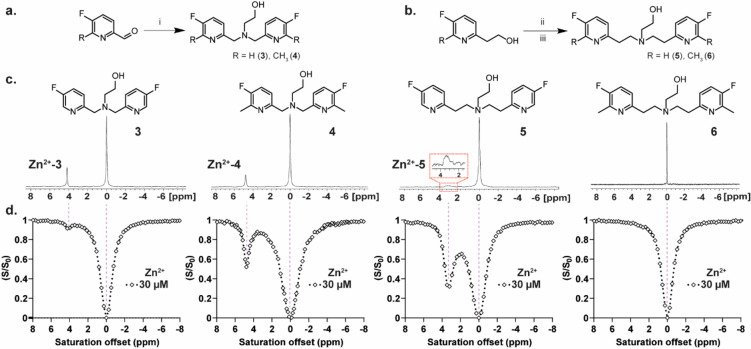
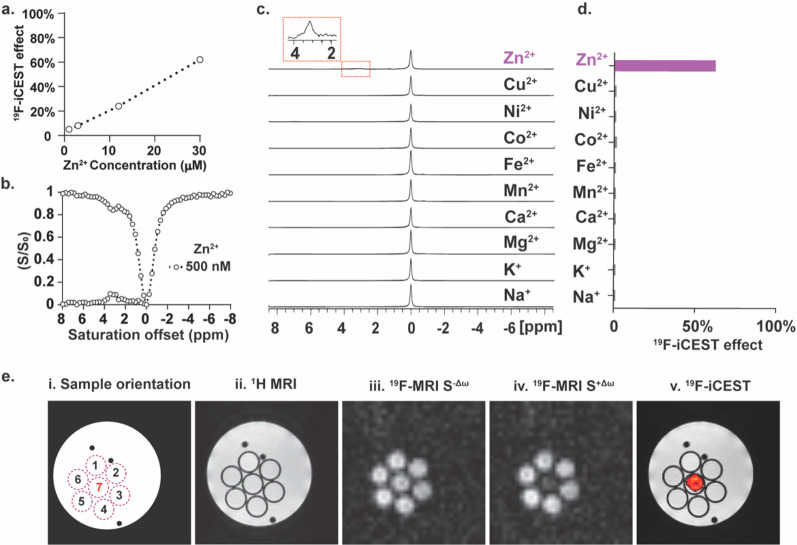
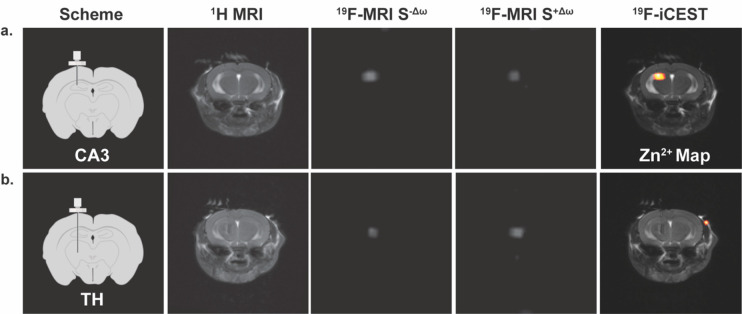
Fast ion-chelate dissociation rates and weak ion-chelate affinities are desired kinetic and thermodynamic features for imaging probes to allow reversible binding and to prevent deviation from basal ionic levels. Nevertheless, such properties often result in poor readouts upon ion binding, frequently result in low ion specificity, and do not allow the detection of a wide range of concentrations. Herein, we show the design, synthesis, characterization, and implementation of a Zn2+-probe developed for MRI that possesses reversible Zn2+-binding properties with a rapid dissociation rate (koff = 845 ± 35 s-1) for the detection of a wide range of biologically relevant concentrations. Benefiting from the implementation of chemical exchange saturation transfer (CEST), which is here applied in the 19F-MRI framework in an approach termed ion CEST (iCEST), we demonstrate the ability to map labile Zn2+ with spectrally resolved specificity and with no interference from competitive cations. Relying on fast koff rates for enhanced signal amplification, the use of iCEST allowed the designed fluorinated chelate to experience weak Zn2+-binding affinity (Kd at the mM range), but without compromising high cationic specificity, which is demonstrated here for mapping the distribution of labile Zn2+ in the hippocampal tissue of a live mouse. This strategy for accelerating ion-chelate koff rates for the enhancement of MRI signal amplifications without affecting ion specificity could open new avenues for the design of additional probes for other metal ions beyond zinc.


Conflict of interest statement

The authors declare no competing financial interest.

Figures

Figure 1
Figure 1
19F-NMR of fluorinated chelates designed for Zn2+ binding studies. (a) The chemical structure of the synthesized fluorinated chelates 1, 2, and 3 with the fluorine substituent at the 6, 3, and 5 positions of the pyridine ring, respectively. (b) Schematic illustration of the dynamic exchange process between the free and Zn2+-bound chelate and the obtained 19F-NMR spectrum of 1, 2, and 3 in the presence of Zn2+ at 25 °C (3 mM chelate and 0.6 mM ZnCl2 at 100 mM Hepes buffer, pH = 7.2, 9.4 T NMR). Shown are the chemical shift offsets (Δω) between the peak of the free chelate (set at 0.0 ppm) and the peak Zn2+-chelate complex.
Figure 2
Figure 2
Zn2+-chelate exchange dynamics as a function of the chelate structure. (a) Synthetic route used for the synthesis of 3 and its methylated derivative 4. (b) Synthetic route used for the synthesis of 5 and its methylated derivative 6. (c) 19F-NMR spectra of 3 mM fluorinated chelates (36) in the presence of 0.6 mM Zn2+ at 37 °C and the obtained Δω between the peak of the free ligand (set at 0.0 ppm) and the Zn2+-bound ligand. (d) Representative 19F-iCEST spectra obtained for an aqueous solution of 3 mM of either of the chelates (from left to right: 3, 4, 5, or 6) in the presence of 30 μM Zn2+ at 37 °C. All NMR data were performed on aqueous solutions (100 mM Hepes buffer, pH = 7.2) at 37 °C with a 9.4 T NMR spectrometer. Reaction conditions: (i) 2-aminoethan-1-ol, NaBH(OAc)3; (ii) PPh3, CBr4; (iii) 2-aminoethan-1-ol, K2CO3.
Figure 3
Figure 3
Zn2+-chelate exchange dynamics as a function of the chelate structure. (a) Evaluated exchange rates kex (s–1) between Zn2+-bound and free chelate as determined for 3, 4, and 5. All NMR data were performed on aqueous solutions (100 mM Hepes buffer, pH = 7.2) at 37 °C with a 9.4 T NMR spectrometer. The X-ray crystal structures of the Zn2+-chelate complexes are shown for 3-Zn2+ (b), 4-Zn2+ (c), and 5-Zn2+ (d).
Figure 4
Figure 4
19F-iCEST Zn2+ sensitivity and selectivity using 5. (a) 19F-iCEST effect for 3 mM 5 as a function of Zn2+ concentration. (b) 19F-iCEST profile of 1 mM 5 and 500 nM Zn2+. (c) 19F-NMR spectra of 3 mM 5 in the presence of 0.6 mM Na+, K+, Mg2+, Ca2+, Mn2+, Fe2+, Co2+, Ni2+, Cu2+, and Zn2+ at 25 °C. (d) 19F-iCEST effect (Δω = 3.2 ppm) of 3 mM 5 and 30 μM (in 100 mM Hepes buffer, pH = 7.2) of s-block (Na+, K+, Mg2+, Ca2+) and d-block (Mn2+, Fe2+, Co2+, Ni2+, Cu2+, Zn2+) metal ions obtained at 37 °C on a 9.4 T NMR spectrometer. (e) 19F-iCEST MRI: (i) schematic representation of the studied phantom composed of seven tubes containing 7 mM 5 and 100 μM cation, i.e., Ca2+ (#1), Cu2+ (#2), Mg2+ (#3), Na+ (#4), K+ (#5), and Zn2+ (#7). Tube #6 contained only 5; (ii) 1H-MRI; (iii) 19F-MRI obtained with a presaturation pulse applied at Δω = −3.2 ppm; (iv) 19F-MRI obtained with a presaturation pulse applied at Δω = +3.2 ppm; (v) 19F-iCEST map obtained by the subtraction of the image in (iv) from that in (iii) overlaid on 1H-MRI.
Figure 5
Figure 5
In vivo19F-iCEST maps of labile Zn2+ pools in the mouse brain. Shown results for two regions of the brain: (a) CA3 in the hippocampus (zinc-rich ROI) or (b) the thalamus (TH, zinc-poor ROI). From left-to-right are the schematic illustration of the setup used to deliver 5 to either CA3 or TH, the1H-MRI, the19F-MRI S–Δω (presaturation pulse applied at Δω = −3.2 ppm, i.e., “off-resonance”), the 19F-MRI S+Δω (presaturation pulse applied at Δω = +3.2 ppm, i.e., “on-resonance”), and the 19F-iCEST contrast (Zn2+ map) obtained from subtracting 19F-MRI S+Δω from 19F-MRI S–Δω overlaid on the 1H-MRI. MRI scans were performed at 15.2 T. Infusion rate was set to 0.25 μL/min (of 10 mM 5 in PBS), and iCEST data acquisition started 90 min from the onset of the infusion of 5.
Figure 6
Figure 6
In vivo19F-iCEST quantification plot: The average percentile of 19F-iCEST contrast (SΔω+/SΔω–) as quantified in CA3 at Δω = 3.2 ppm (N = 7 mice) or Δω = 18 ppm (N = 7 mice), or in the TH (N = 7) at Δω = 3.2 ppm. Error bar denotes SEM, *p-value < 0.05, **p-value < 0.001, unpaired Student’s t test.

References

    1. Alberts I. L.; Nadassy K.; Wodak S. J. Analysis of zinc binding sites in protein crystal structures. Protein Sci. 1998, 7 (8), 1700–16. 10.1002/pro.5560070805. - DOI - PMC - PubMed
    1. Cole T. B.; Wenzel H. J.; Kafer K. E.; Schwartzkroin P. A.; Palmiter R. D. Elimination of zinc from synaptic vesicles in the intact mouse brain by disruption of the ZnT3 gene. Proc. Natl. Acad. Sci. U. S. A. 1999, 96 (4), 1716–21. 10.1073/pnas.96.4.1716. - DOI - PMC - PubMed
    1. Costello L. C.; Franklin R. B. Novel role of zinc in the regulation of prostate citrate metabolism and its implications in prostate cancer. Prostate 1998, 35 (4), 285–96. 10.1002/(SICI)1097-0045(19980601)35:4<285::AID-PROS8>3.0.CO;2-F. - DOI - PubMed
    1. Chimienti F.; Devergnas S.; Favier A.; Seve M. Identification and cloning of a beta-cell-specific zinc transporter, ZnT-8, localized into insulin secretory granules. Diabetes 2004, 53 (9), 2330–7. 10.2337/diabetes.53.9.2330. - DOI - PubMed
    1. Que E. L.; Bleher R.; Duncan F. E.; Kong B. Y.; Gleber S. C.; Vogt S.; Chen S.; Garwin S. A.; Bayer A. R.; Dravid V. P.; Woodruff T. K.; O’Halloran T. V. Quantitative mapping of zinc fluxes in the mammalian egg reveals the origin of fertilization-induced zinc sparks. Nat. Chem. 2015, 7 (2), 130–9. 10.1038/nchem.2133. - DOI - PMC - PubMed

Publication types