. 2021 Sep 13;39(9):1227-1244.e20.
doi: 10.1016/j.ccell.2021.06.017. Epub 2021 Jul 22.

Single-cell analysis defines a pancreatic fibroblast lineage that supports anti-tumor immunity

Affiliations

Single-cell analysis defines a pancreatic fibroblast lineage that supports anti-tumor immunity

Colin Hutton et al. Cancer Cell. .

Abstract

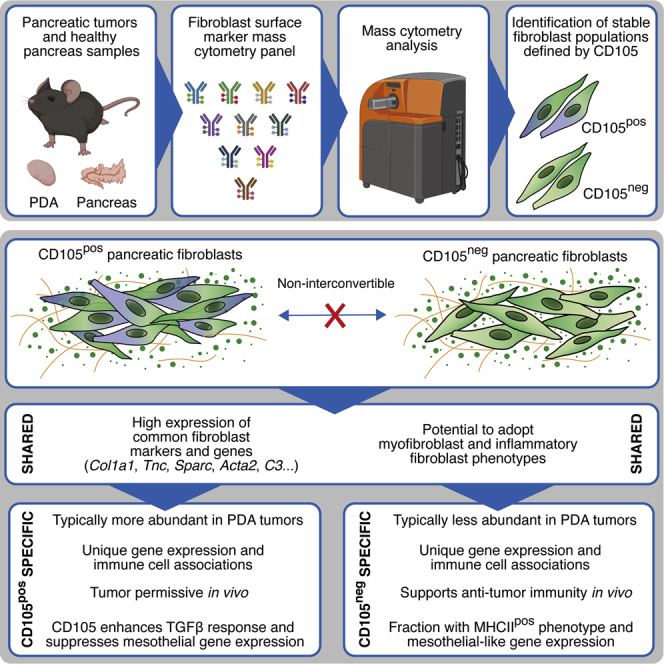
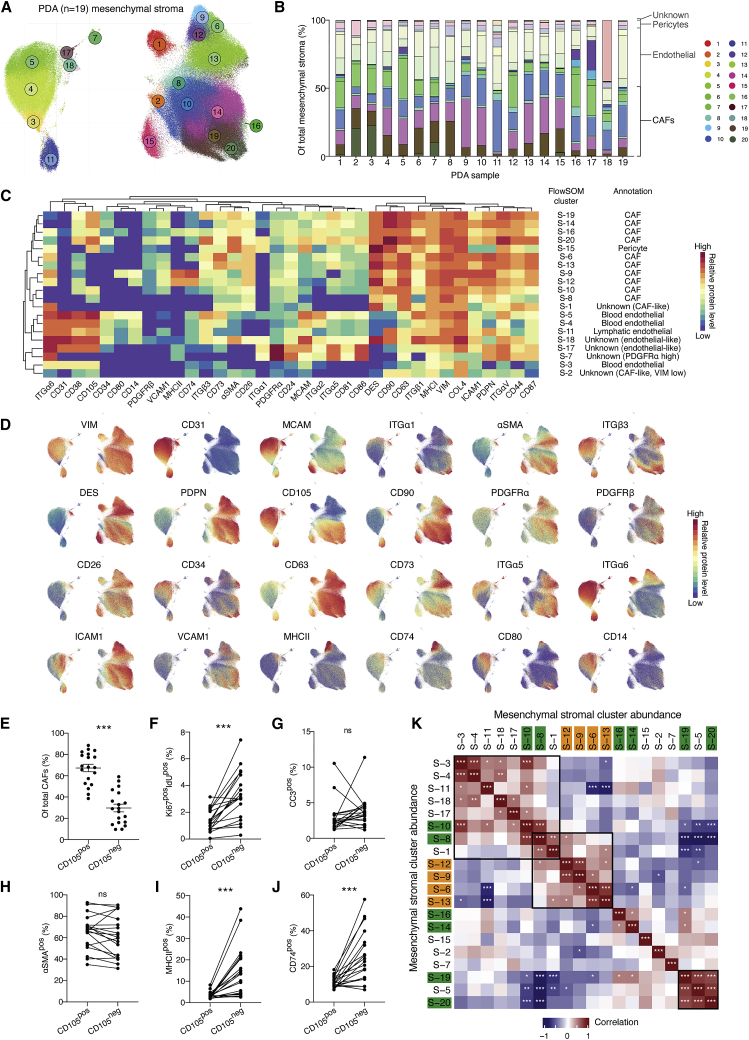
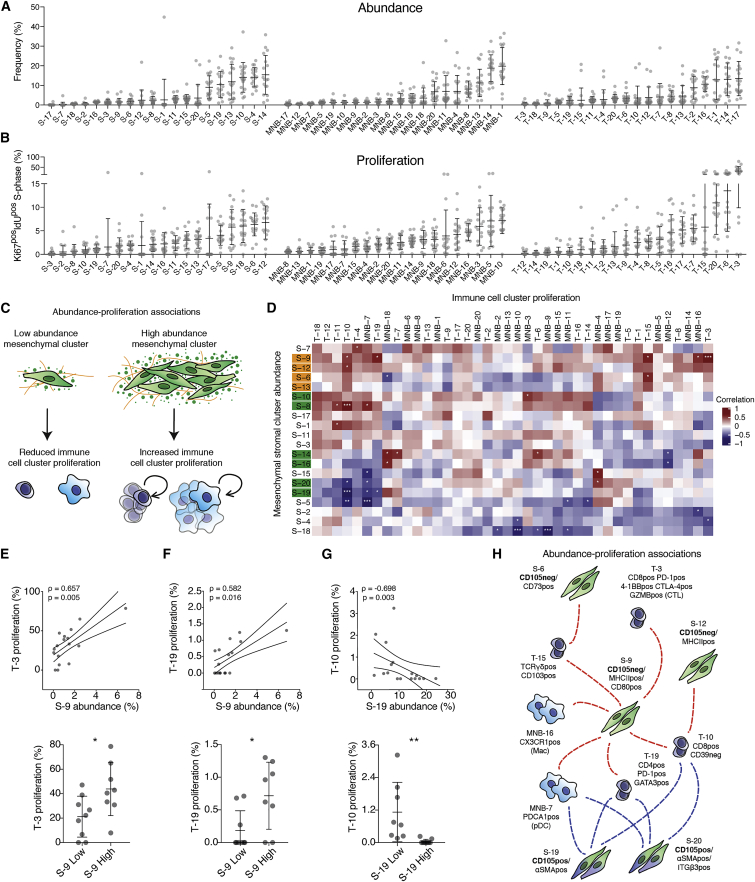
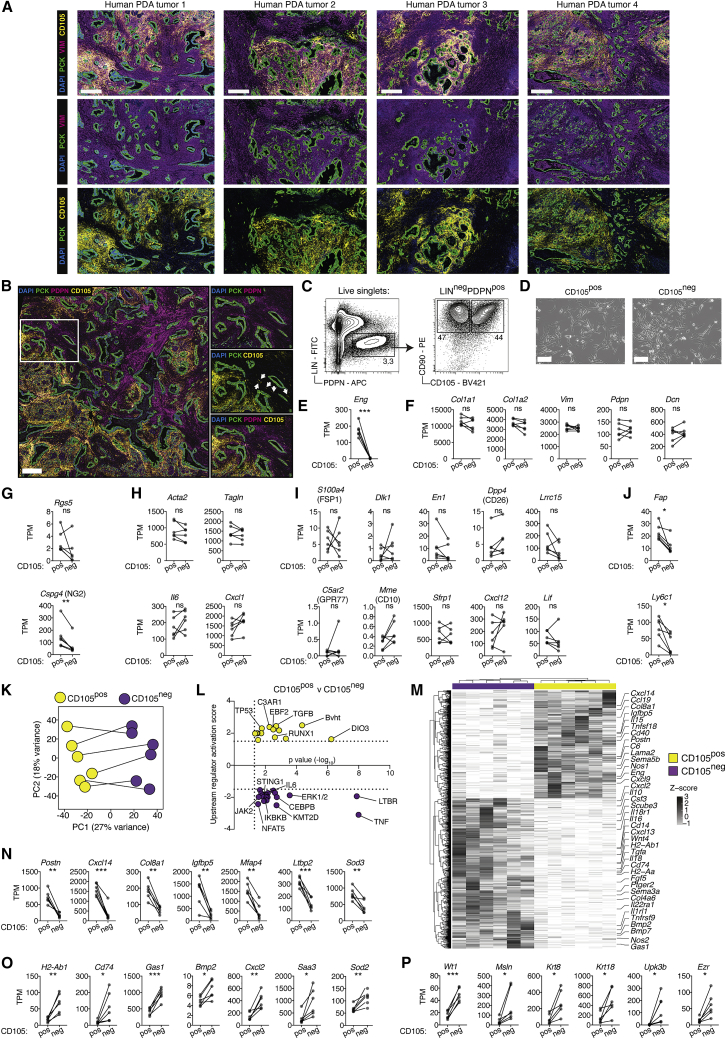
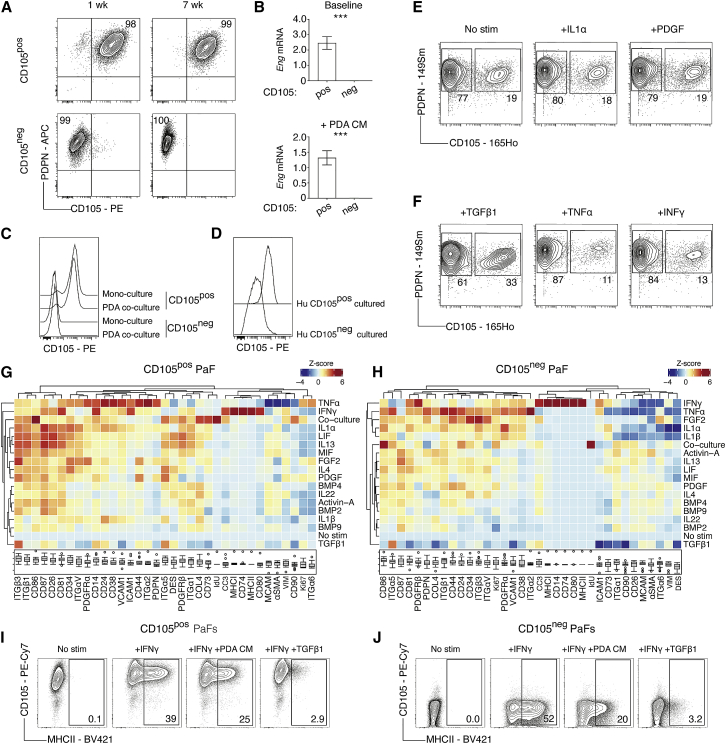
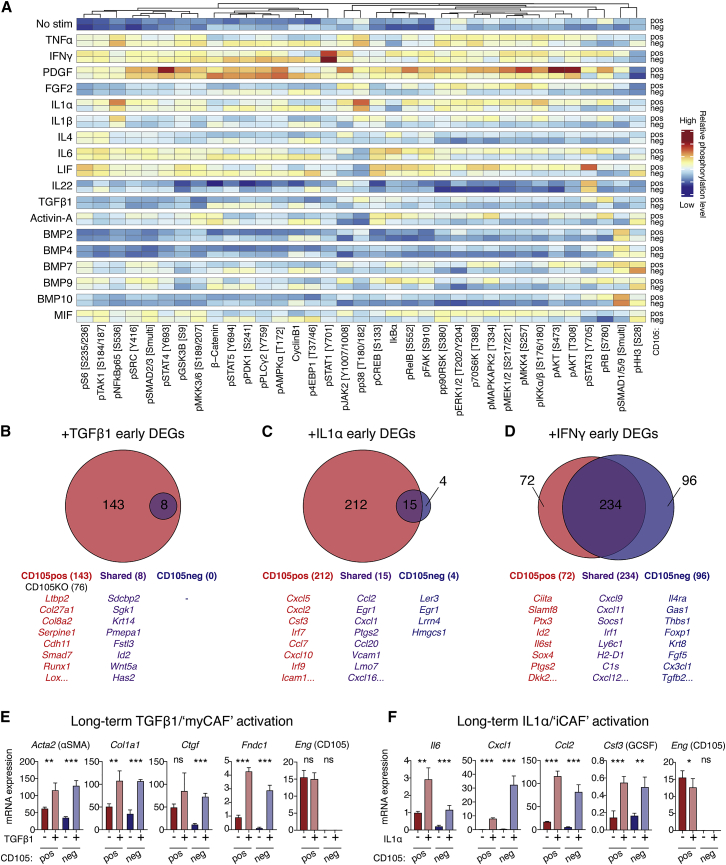
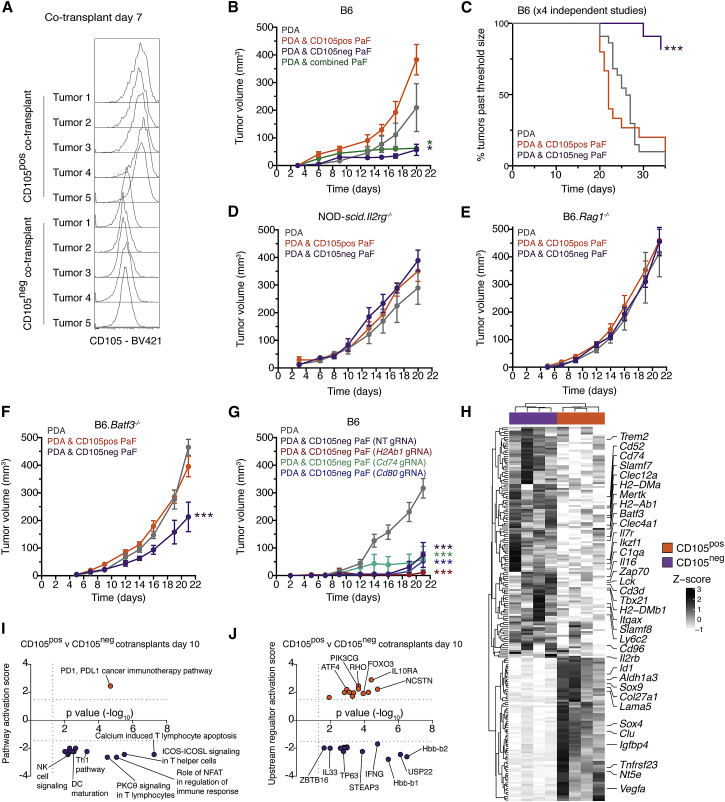
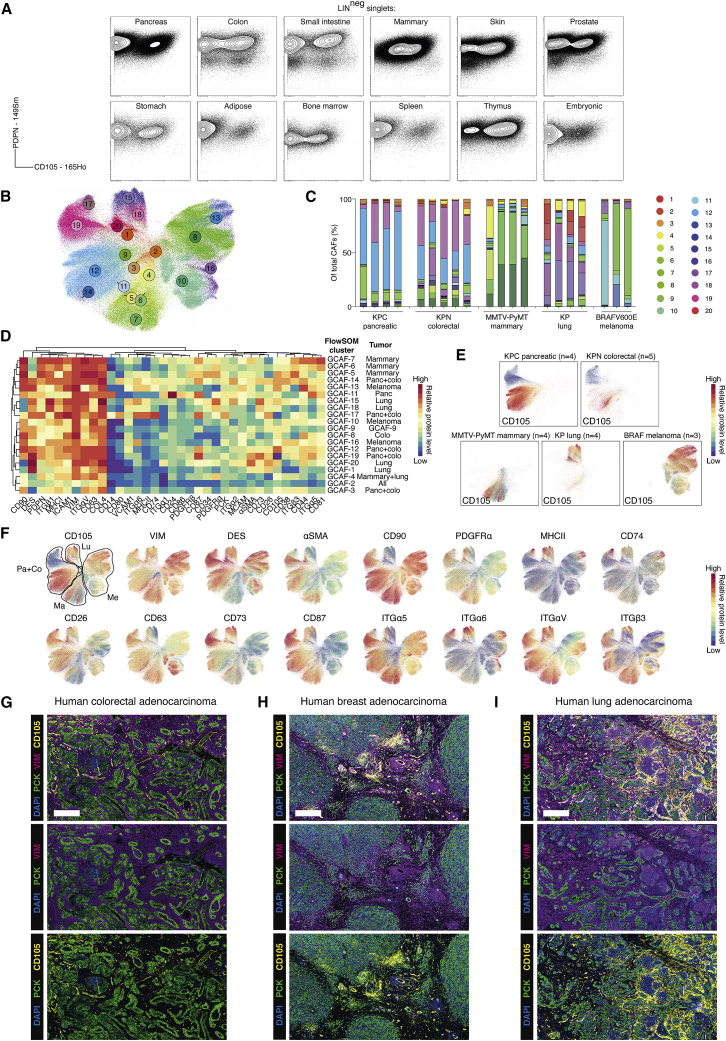
Fibroblasts display extensive transcriptional heterogeneity, yet functional annotation and characterization of their heterocellular relationships remains incomplete. Using mass cytometry, we chart the stromal composition of 18 murine tissues and 5 spontaneous tumor models, with an emphasis on mesenchymal phenotypes. This analysis reveals extensive stromal heterogeneity across tissues and tumors, and identifies coordinated relationships between mesenchymal and immune cell subsets in pancreatic ductal adenocarcinoma. Expression of CD105 demarks two stable and functionally distinct pancreatic fibroblast lineages, which are also identified in murine and human healthy tissues and tumors. Whereas CD105-positive pancreatic fibroblasts are permissive for tumor growth in vivo, CD105-negative fibroblasts are highly tumor suppressive. This restrictive effect is entirely dependent on functional adaptive immunity. Collectively, these results reveal two functionally distinct pancreatic fibroblast lineages and highlight the importance of mesenchymal and immune cell interactions in restricting tumor growth.

Keywords: CAF; CD105; CyTOF; Eng; cancer-associated fibroblast lineages; mass cytometry; pancreatic cancer; tumor microenvironment; tumor-restrictive fibroblasts.


Conflict of interest statement

Declaration of interests O.S. receives funding from Novartis, AstraZeneca, RedEx and Cancer Research Technology. C.J. receives funding from AstraZeneca. R.M. is an expert witness for Pfizer and, as a former employee of the Institute of Cancer Research (ICR) in London, may benefit financially from commercialized programs. C.S. and F.L. are former employees of the ICR in London and may benefit financially from commercialized programs. The other authors declare no competing interests.

Figures

None
Graphical abstract
Figure 1
Figure 1
Phenotypic and compositional heterogeneity of pancreatic cancer-associated mesenchymal cells (A) UMAP projection of single mesenchymal stromal cells from n = 19 tumors, with color-coded FlowSOM clusters (1–20). Total of 5 × 105 cell displayed. (B) Stacked bar graph displaying relative abundance of KPC PDA mesenchymal stromal subclusters. Color coded as in (A) and separated into major mesenchymal groups. (C) Heatmap of marker median mass intensities (MMIs) displayed as Z scores. Each FlowSOM cluster was grouped by unsupervised hierarchical clustering based on marker MMIs. Cell-type annotations based on canonical markers are listed. (D) UMAP projection from (A) displaying overlaid signal intensity of selected phenotypic markers. (E) Whisker plot with relative frequency of CD105pos and CD105neg CAFs displayed as mean ± SD. n = 19 KPC tumors. (F–J) Relative frequency of S-phase (F), apoptotic (G), αSMApos (H), MHCIIpos (I) and CD74pos (J) CAFs within total CD105pos and CD105neg CAFs. Paired populations from the same tumor samples are linked. (K) Spearman correlation coefficients of all pairwise mesenchymal stroma cluster frequencies. CD105neg (orange) and CD105pos (green) CAF subsets highlighted. Data are compared using paired t tests (E–J) or Spearman correlation adjusted for multiple testing using Benjamini-Hochberg correction (K). ns, not significant; p < 0.05, ∗∗p < 0.01, ∗∗∗p < 0.001. See also Figure S1 and Table S1.
Figure 2
Figure 2
Co-regulated CAF and immune subsets within the PDA tumor microenvironment (A and B) Relative frequency within parental population (A) and proliferative fraction (Ki67pos IdUpos) (B) of annotated subsets. Data displayed as mean ± SD. (C) Model of association between mesenchymal subset abundance and immune cell proliferation. (D) Matrix of Spearman correlation coefficients of all pairwise mesenchymal subset frequencies and immune cell proliferation. CD105neg (orange) and CD105pos (green) CAF subsets highlighted. (E–G) Spearman correlation analysis of S-9 (E, F) and S-19 (G) relative frequency with proliferative fraction of T-3 (E), T-19 (F), and T-10 (G) (top). ρ = Spearman correlation coefficient, 90% confidence intervals displayed. PDA tumors split into high (n = 7) or low (n = 8) fractions of S-9 (E and F) and S-19 (G) with proliferative fraction of T-3 (E), T-19 (F), and T-10 (G) displayed as mean ± SD (bottom). (H) Model of positive (red) and negative (blue) correlations of CD105pos and CD105neg CAF subset abundance and proliferation of selected immune subsets. Samples were compared using unpaired t tests (E–G) (bottom) or Spearman correlation adjusted for multiple testing using Benjamini-Hochberg correction (D, E–G) (top). ns, not significant; p < 0.05, ∗∗p < 0.01, ∗∗∗p < 0.001. See also Figures S2 and S3 and Table S2.
Figure 3
Figure 3
CD105 expression discriminates two distinct CAF populations in murine and human PDA (A and B) Immunohistochemistry (IHC) of human PDA tumor samples stained for pan-cytokeratin (PCK) (green), CD105 (yellow), DAPI (blue) and vimentin (VIM) (A) or podoplanin (PDPN) (B) (purple). Insert is magnified with arrows annotating vessels (right) (B). Representative images of n = 15 tumor samples. Scale bar = 500 μm.. (C and D) Fluorescence-activated cell sorting plots (C) and in vitro cultures (D) of CD105pos and CD105neg CAFs. Representative of n = 6 independent experiments. Scale bar, 150 μm. (E–J) RNA-seq expression analysis of paired CD105pos (n = 6) and CD105neg (n = 6) PDA CAFs. Isolations from the same tumor sample are linked. Gene expression calculated as transcripts per kilobase million (TPM). Displaying Eng (the gene encoding CD105) (E), canonical fibroblast genes (F), canonical pericyte genes (G), myCAF- and iCAF-associated genes (H), and genes associated with fibroblast heterogeneity in other studies (I–J). (K) Principal-component (PC) analysis of differentially expressed genes between CD105pos (n = 6, yellow) and CD105neg (n = 6, purple) PDA CAFs. DEGs determined using DEseq2 as >2 fold-change and Benjamini-Hochberg adjusted p < 0.05. Paired CAFs from the same tumor are linked. (L) Ingenuity Pathway Analysis of CD105pos (Yellow) and CD105neg (purple) CAF DEGs, displaying upstream activators. (M) Heatmap of expression levels of all 1007 CAF DEGs, displayed as row Z scores. Example DEGs are highlighted. (N–P) CD105pos PDA CAF DEGs (N), CD105neg PDA CAF DEGs (O), and CD105neg CAF DEGs associated with mesothelial cell identity (P). Gene expression calculated as TPM. Isolations from the same tumor sample are linked. Samples are compared using paired t tests (D–I and M–O). ns, not significant; p < 0.05, ∗∗p < 0.01, ∗∗∗p < 0.001. See also Figure S4 and Table S3.
Figure 4
Figure 4
Phenotypic plasticity of mesenchymal marker expression (A) Flow cytometry analysis of PDPN and CD105 in purified and in-vitro-cultured CD105pos and CD105neg pancreatic fibroblasts (PaFs) after 1 and 7 weeks. Plots are representative of n = 4 experiments. Relative frequencies shown in relevant quadrants. (B) Normalized Eng mRNA expression in purified CD105pos (n = 4) and CD105neg PaFs (n = 4) treated with control (top) or KPC PDA conditioned medium (bottom). Data displayed as mean ± SD. (C) Representative flow cytometry analysis (n = 4) of CD105 on GFPposCD105pos and GFPposCD105neg PaFs in mono- or co-culture with RFPpos KPC PDA tumor cells. (D) Representative flow cytometry analysis (n = 3) of CD105 in isolated CD105pos and CD105neg human PaFs after >3 weeks of in vitro culture. (E and F) MC analysis of primary PaFs treated with the indicated ligands for 3 days. Representative plots displaying relative frequencies of CD105pos and CD105neg PaFs. (G and H) Heatmap of median marker intensity (MMI) displayed as column Z scores for each phenotypic marker on CD105pos (G) and CD105neg (H) PaFs after 3 days of treatment as indicated. Boxplots show MMI with upper and lower boundary of the interquartile range and whiskers denoting maximum and minimum values minus outliers, across all conditions. (I and J) Representative flow cytometry analysis (n = 3) of CD105pos (I) and CD105neg (J) PaFs with IFN-γ, IFN-γ + KPC PDA conditioned medium, or IFN-γ + TGF-β1 treatment. Samples are compared using unpaired t tests (B) (top and bottom). ns, not significant; p < 0.05, ∗∗p < 0.01, ∗∗∗p < 0.001. See also Figure S5 and Table S4.
Figure 5
Figure 5
Differential signaling engagement of CD105pos and CD105neg PaFs (A) MC analysis of CD105pos and CD105neg PaFs signaling. Data are displayed as median mass intensities (MMI) and column Z scores. Specific phosphorylation sites are annotated in brackets. (B–D) RNA-seq analysis of CD105pos and CD105neg PaFs stimulated as displayed for 6 h (n = 3). DEGs were identified using DEseq2 with Benjamini-Hochberg adjusted p < 0.05. Data are displayed as Venn diagrams (top), with example genes listed (below). Unique DEGs of CD105pos PaFs in red, CD105neg PaFs in blue, and shared in purple. Numbers of significant DEGs are displayed in parenthesis. (E and F) Expression of myCAF (E) and iCAF (F) genes from CD105pos and CD105neg PaFs stimulated with TGF-β1 or IL-1α (n = 4) for 3 days. Eng expression is also shown. Data displayed as mean ± SD. Samples were compared using unpaired t tests (E and F). ns, not significant; p < 0.05, ∗∗p < 0.01, ∗∗∗p < 0.001. See also Figure S6 and Table S5.
Figure 6
Figure 6
CD105neg fibroblasts restrict tumor growth in vivo (A) Flow cytometry analysis of co-implanted GFPpos CD105pos or CD105neg PaFs 7 days after co-injection. (B) Tumor growth of subcutaneous injection of 105 PDA tumor cells or co-transplantation with 105 CD105pos or CD105neg PaFs in syngeneic B6 mice. n = 5 mice per condition. Data are representative of n = 4 separate experiments. For the combined condition a 1:1 mixture of CD105pos:CD105neg PaFs was used and the total number of PaFs kept constant. (C) Kaplan-Meier analysis of tumors exceeding a threshold volume of 400 mm3 (n = 4 independent studies, in total n = 14–22 mice per condition). (D–F) As for (B) but with NOD-scid.Il2rg−/− (n = 4 to 5 per condition) (D) B6.Rag1−/− (n = 6 per condition) (E), and B6.Batf3−/− (n = 8 to 9 per condition) (F) mice. (G) As for (A) but with CD105neg PaFs disrupted for H2Ab1, Cd74, and Cd80 expression. Non-targeting gRNA transfected CD105neg PaFs were used as control. (H–J) Bulk RNA-seq analysis of co-injected PDA tumor cells with CD105pos (orange) and CD105neg (purple) PaFs at day 10. Heatmap of differentially expressed genes displayed as row Z scores (H), Ingenuity Pathway Analysis of differentially activated pathways (I), and upstream regulators (J). Data are displayed as mean tumor volumes ± standard error of the mean (SEM) (B–G). Conditions were compared using two-way ANOVA (B and D–G) and log rank test (C). p < 0.05, ∗∗p < 0.01, ∗∗∗p < 0.001. See also Figure S7 and Table S6.
Figure 7
Figure 7
CD105pos and CD105neg fibroblasts are identified in normal and tumor-bearing tissues (A) MC analysis of in-vitro-expanded primary fibroblasts. Plots show PDPN and CD105 levels. LIN, EpCAM CD31 CD45. (B) UMAP projection of CAFs from KPC pancreatic (n = 4), KPN colorectal (n = 5), MMTV-PyMT mammary (n = 4), KP lung (n = 4), and BRAFV600E melanoma (n = 3) GEMMs. FlowSOM clusters are color coded. Total of 5 × 105 cell displayed. (C) Stacked bar graphs of GEMM CAF (GCAF) clusters displayed as a fraction of total CAFs. FlowSOM colors based on (B). (D) Heatmap of marker median mass intensities (MMIs) displayed as Z scores. Each GCAF FlowSOM cluster is grouped by unsupervised hierarchical clustering based on marker MMIs. Cell-type annotations based on canonical phenotypic markers are listed. Tumor type/s that the GCAF clusters predominantly arise from are listed. (E) UMAP projection from (B) displaying overlaid signal intensity of CD105 with annotated tumor types. (F) UMAP projection from (B) displaying overlaid signal intensity of example markers. The tumor types of origin are highlighted: Pa, pancreatic; Co, colorectal; Ma, mammary; Lu, lung; Me, melanoma. (G–I) Representative IHC analysis of human colorectal (n = 9), breast (n = 8), and lung adenocarcinoma (n = 6) tumor samples stained for pan-cytokeratin (PCK) (green), vimentin (VIM) (purple), CD105 (yellow), and DAPI (blue). Scale bar, 500 μm. See also Figure S8 and Table S7.

Comment in

References

    1. Anders S., Huber W. Differential expression analysis for sequence count data. Genome Biol. 2010;11:R106. - PMC - PubMed
    1. Bankhead P., Loughrey M.B., Fernandez J.A., Dombrowski Y., McArt D.G., Dunne P.D., McQuaid S., Gray R.T., Murray L.J., Coleman H.G. QuPath: open source software for digital pathology image analysis. Sci. Rep. 2017;7:16878. - PMC - PubMed
    1. Becht E., Giraldo N.A., Lacroix L., Buttard B., Elarouci N., Petitprez F., Selves J., Laurent-Puig P., Sautès-Fridman C., Fridman W.H. Estimating the population abundance of tissue-infiltrating immune and stromal cell populations using gene expression. Genome Biol. 2016;17:218. - PMC - PubMed
    1. Becht E., McInnes L., Healy J., Dutertre C.-A., Kwok I.W.H., Ng L.G., Ginhoux F., Newell E.W. Dimensionality reduction for visualizing single-cell data using UMAP. Nat. Biotechnol. 2018;37:38–44. - PubMed
    1. Bendall S.C., Nolan G.P. From single cells to deep phenotypes in cancer. Nat. Biotechnol. 2012;30:639–647. - PubMed

Publication types

MeSH terms