. 2021 Aug 10;16(8):1923-1937.
doi: 10.1016/j.stemcr.2021.06.011. Epub 2021 Jul 22.

Developing human pluripotent stem cell-based cerebral organoids with a controllable microglia ratio for modeling brain development and pathology

Affiliations

Developing human pluripotent stem cell-based cerebral organoids with a controllable microglia ratio for modeling brain development and pathology

Ranjie Xu et al. Stem Cell Reports. .

Abstract

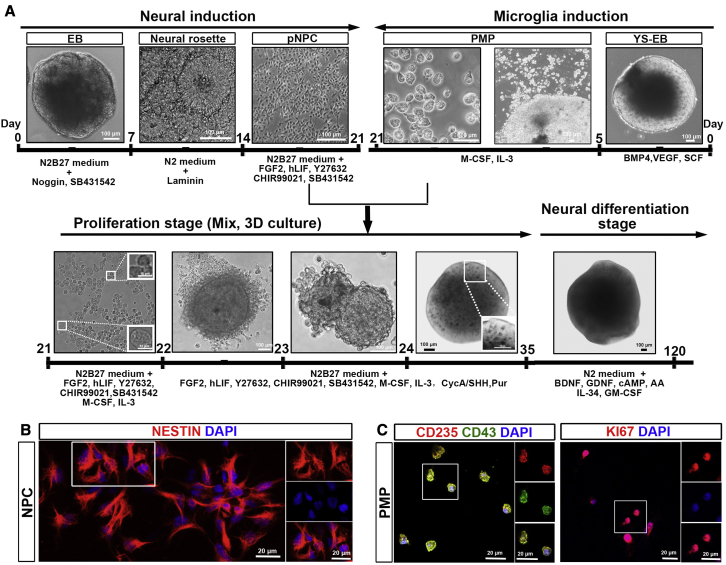
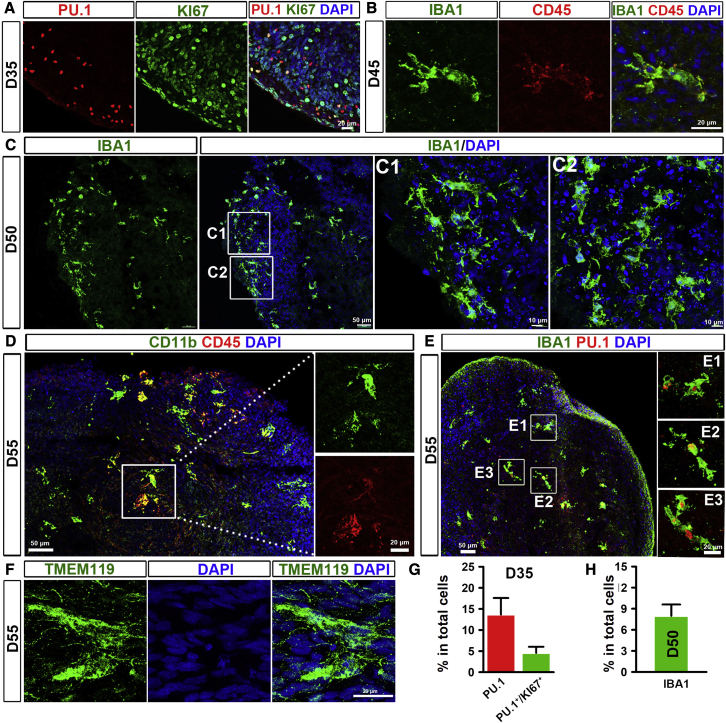
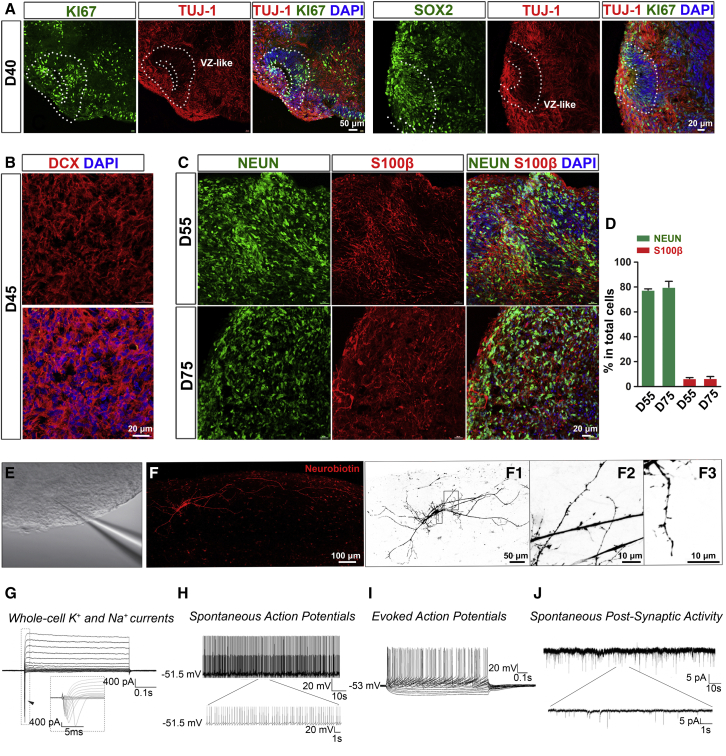
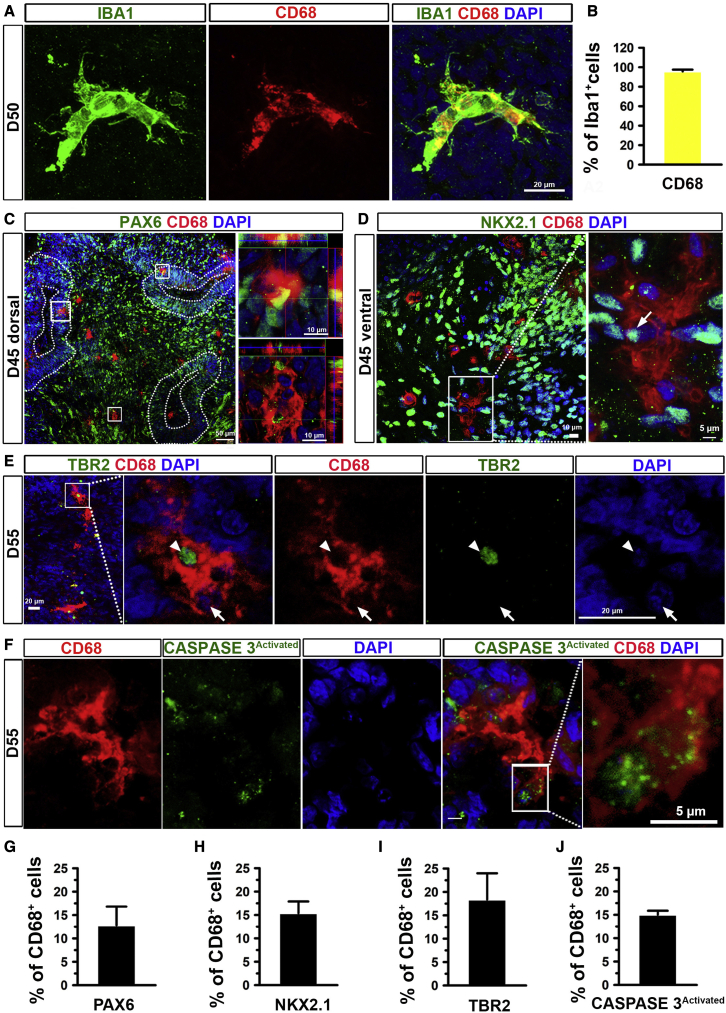
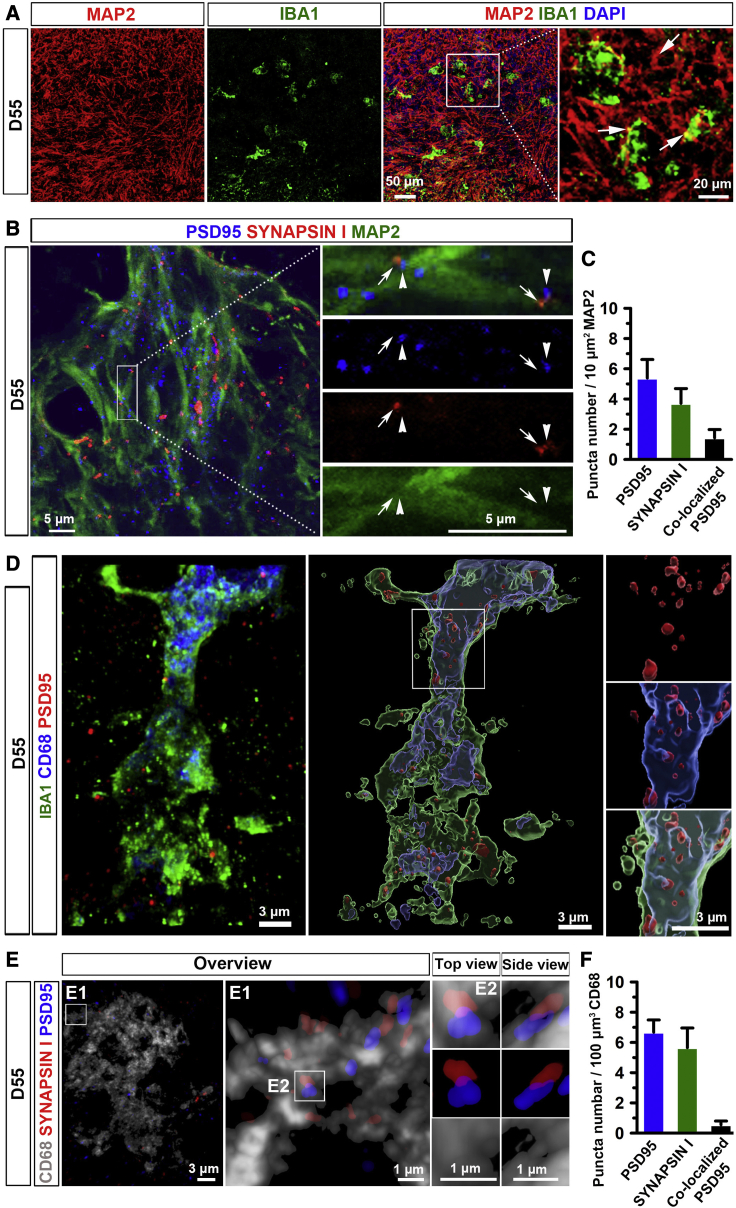
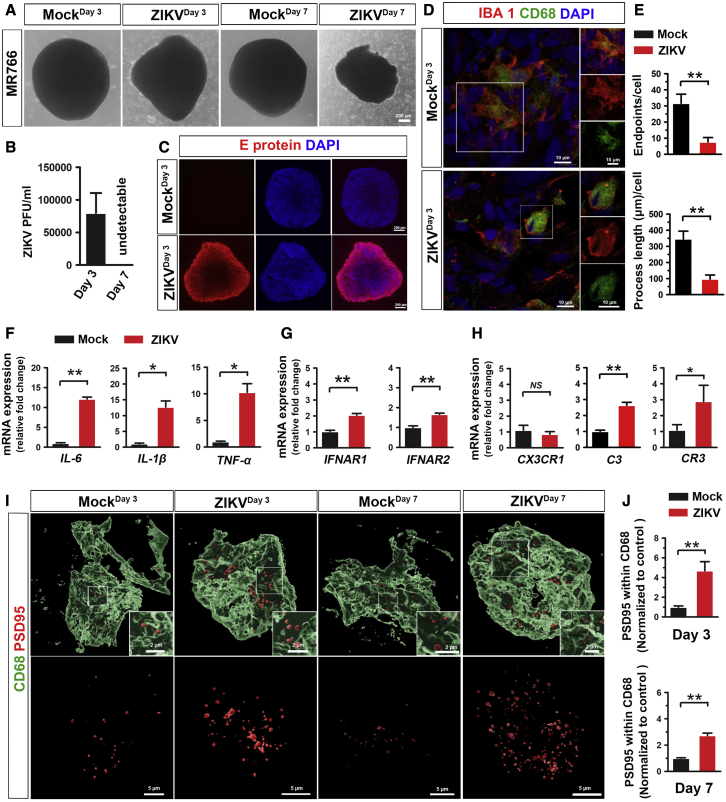
Microglia play critical roles in brain development, homeostasis, and disease. Microglia in animal models cannot accurately model human microglia due to notable transcriptomic and functional differences between human and other animal microglia. Incorporating human pluripotent stem cell (hPSC)-derived microglia into brain organoids provides unprecedented opportunities to study human microglia. However, an optimized method that integrates appropriate amounts of microglia into brain organoids at a proper time point, resembling in vivo brain development, is still lacking. Here, we report a new brain region-specific, microglia-containing organoid model by co-culturing hPSC-derived primitive neural progenitor cells and primitive macrophage progenitors. In the organoids, the number of human microglia can be controlled, and microglia exhibit phagocytic activity and synaptic pruning function. Furthermore, human microglia respond to Zika virus infection of the organoids. Our findings establish a new microglia-containing brain organoid model that will serve to study human microglial function in a variety of neurological disorders.

Keywords: Zika virus; cerebral organoid; human iPSC; human pluripotent stem cell; microglia; synaptic pruning.


Conflict of interest statement

The authors declare no competing interests.

Figures

Figure 1
Figure 1
Generation of microglia-containing brain organoids (A) A schematic procedure for deriving microglia-containing brain organoids by co-culture of pNPCs and PMPs under 3D conditions. Scale bars, 100 or 10 μm in the original or enlarged images, respectively. (B) Representatives of NESTIN+ pNPCs. Scale bars, 20 μm in the original or enlarged images. (C) Representatives of CD235+, CD43+, and Ki67+ PMPs. Scale bars, 20 μm in the original or enlarged images. See also Figure S1.
Figure 2
Figure 2
Differentiation of PMPs into microglia in brain organoids (A and G) (A) Representatives and (G) quantification of PU.1+ and PU.1+/Ki67+ cells in day 35 brain organoids. Scale bars, 20 μm. Pooled data from two hiPSC lines and one hESC line. Three independent experiments (n = 3) were performed, and, for each experiment, four to six organoids from each hPSC line were used. Data are presented as mean ± SEM. (B) Representatives of IBA1+/CD45+ cells in day 45 brain organoids. Scale bars, 20 μm. (C and H) (C) Representatives and (H) quantification of IBA1+ cells in day 50 brain organoids. Scale bars, 50 or 10 μm as indicated. Pooled data from two hiPSC lines and one hESC line. Three independent experiments (n = 3) were performed, and for each experiment, four to six organoids from each hPSC line were used. Data are presented as mean ± SEM. (D) Representatives of CD11b+/CD45+ cells in day 55 brain organoids. Scale bars, 50 or 20 μm as indicated. (E) Representatives of IBA1+/PU.1+ cells in day 55 brain organoids. Scale bars, 50 or 20 μm as indicated. (F) Representatives of TMEM119+ cells in day 55 brain organoids. Scale bars, 20 μm. See also Figure S1.
Figure 3
Figure 3
Neural maturation in microglia-containing brain organoid (A) Representatives of Ki67+, SOX2+, and TUJ1+ cells in day 40 microglia-containing brain organoids. Scale bars, 50 or 20 μm as indicated. (B) Representatives of Doublecortin-positive cells in day 45 microglia-containing brain organoid. Scale bars, 20 μm. (C and D) (C) Representatives and (D) quantification of NEUN+ and S100β+ cells in day 55 or 75 microglia-containing brain organoids. Scale bars, 20 μm. Pooled data from two hiPSC lines and one hESC line. Three independent experiments (n = 3) were performed, and for each experiment, four to six organoids from each hPSC line were used. Data are presented as mean ± SEM. (E) A representative image showing a patched neuron in acute organoid slice. (F) Sample images of a neuron filled with biotin ethylenediamine HBR from a day 92 microglia-containing organoid after whole-cell recording. Complex arborization (F1) and spine-like structures (F2, F3) were identified. The images are inverted to a white background to help visualize neuron morphology. (G) Representative traces of whole-cell currents recorded from neurons in acutely sectioned organoid (90 day old in culture) slices. Insert: fast activation/inactivation voltage-dependent sodium currents. (H) Representative traces of spontaneous action potentials recorded from neurons in organoid (90 day old in culture) slices. (I) Example of repetitive action potentials evoked by stepwise currents injections. (J) Representative traces of spontaneous post-synaptic currents (PSCs) recorded from neurons in sliced collected from a day 92 organoid.
Figure 4
Figure 4
Phagocytic function of microglia in brain region-specific organoids (A and B) (A) Representatives and (B) quantification of CD68+ cells in IBA1+ cells in day 50 brain organoids. Scale bars, 20 μm. Pooled data from two hiPSC lines and one hESC line. Three independent experiments (n = 3) were performed, and for each experiment, four to six organoids from each hPSC line were used. Data are presented as mean ± SEM. (C and G) (C) Representatives and (G) quantification of PAX6+ dorsal forebrain NPCs in total CD68+ microglia in day 46 dorsal forebrain organoids (enlarged images). Scale bars, 50 or 10 μm as indicated. Pooled data from two hiPSC lines and one hESC line. Three independent experiments (n = 3) were performed, and for each experiment, four to six organoids from each hPSC line were used. Data are presented as mean ± SEM. (D and H) (D) Representatives and (H) quantification of NKX2.1+ ventral forebrain NPCs in total CD68+ microglia in day 46 ventral forebrain organoids (enlarged images). Scale bars, 10 or 5 μm as indicated. n = 3. Data are presented as mean ± SEM. (E and I) (E) Representatives and (I) quantification of TBR2+ intermediate progenitor cells in CD68+ microglia in day 56 organoids (enlarged images). Scale bars, 10 or 5 μm as indicated. Pooled data from two hiPSC lines and one hESC line. Three independent experiments (n = 3) were performed, and for each experiment, four to six organoids from each hPSC line were used. Data are presented as mean ± SEM. (F) Representatives and (J) quantification of activated caspase-3+ apoptotic cells in CD68+ microglia in day 56 organoids (enlarged images). Scale bars, 5 μm. n = 3. Pooled data from two hiPSC lines and one hESC line. Three independent experiments (n = 3) were performed, and for each experiment, four to six organoids from each hPSC line were used. Data are presented as mean ± SEM. See also Figure S2.
Figure 5
Figure 5
Microglia prune synapses in microglia-containing brain organoids (A) Representative images showing IBA1+ microglia interact with MAP2+ neuronal processes in day 55 brain organoids. Scale bars, 50 or 20 μm as indicated. (B) Representative images showing PSD95+ and SYNAPSIN 1+ synaptic puncta, and the juxtaposition of pre- and post-synaptic puncta complexes along MAP2+ processes in day 55 brain organoids. Arrows and arrowheads indicate the juxtaposition of pre- and post-synaptic puncta, respectively. Scale bars, 5 μm. (C) Quantification of pooled data from two hiPSC lines and one hESC line showing the density of SYNAPSIN 1+, PSD95+, and colocalized PSD95+ per 10 μm2 MAP2 in day 55 organoids. Pooled data from two hiPSC lines and one hESC line. Three independent experiments (n = 3) were performed, and for each experiment, four to six organoids from each hPSC line were used. Data are presented as mean ± SEM. (D) Representative images showing co-localization of IBA1+, CD68+, and PSD95+ staining in day 55 organoids. Left, a raw fluorescent super-resolution image. Right, a 3D surface rendered image from the same raw image. Scale bars, 3 μm. (E) Representative 3D reconstruction of super-resolution images showing CD68+ microglial engulfment of SYNAPSIN 1 and PSD95 in day 55 organoids. Scale bars, 3 or 1 μm as indicated. (F) Quantification of the number of SYNAPSIN 1+, PSD95+, and colocalized PSD95+ per 100 μm3 CD68+ microglial phagolysosomes in day 55 organoids. Pooled data from two hiPSC lines and one hESC line. Three independent experiments (n = 3) were performed, and, for each experiment, four to six organoids from each hPSC line were used. Data are presented as mean ± SEM. See also Figure S3.
Figure 6
Figure 6
Responses of microglia to ZIKV infection in brain organoids (A) Representative phase-contrast images showing the morphology of day 75 microglia-containing organoid after 3 and 7 days of ZIKV or mock infection. Scale bars, 200 μm. (B) Quantitation of infectious ZIKV particles in the culture medium by plaque assay. n = 3, three independent times infections, each time, 8–12 organoids from two hiPSC lines. Data are presented as mean ± SEM. (C) Representative images showing E protein expression in day 75 organoids after 3 days of ZIKV or mock infection. Scale bars, 200 μm. (D) Representatives of IBA1+/CD68+ microglia in day 75 organoids after 3 days of ZIKV or mock infection. Scale bars, 10 μm. (E) Quantification of the number of endpoints and process length of IBA1+ microglia in day 75 organoids after 3 days of ZIKV or mock infection (n = 3, 3 independent times infections, each time, 8–12 organoids from two hiPSC lines). Student's t test. p < 0.05. Data are presented as mean ± SEM. (F–H) (F) qPCR analysis of IL-6, IL-β, and TNF-α mRNA, (G) IFNAR1 and IFNAR2 mRNA, and (H) CX3CR1, C3, and CR3 mRNA expression in day 75 organoid after 3 days of ZIKV or mock infection. n = 3, three independent times infections, each time, 10 organoids from two hiPSC lines. Student's t test. p < 0.05, ∗∗p < 0.01. Data are presented as mean ± SEM. (I and J) (I) Representative 3D reconstruction and (J) quantification of PSD95+ puncta engulfment in CD68+ microglial phagolysosomes in day 75 organoids after 3 days of ZIKV or mock infection. Scale bars, 5 or 2 μm as indicated. n = 3, three independent times infections, each time, 8–12 organoids from two hiPSC lines. Data normalized to engulfment in the mock control. Student's t test. ∗∗p < 0.01. Data are presented as mean ± SEM. See also Figure S4 and Table S2.

References

    1. Abreu C.M., Gama L., Krasemann S., Chesnut M., Odwin-Dacosta S., Hogberg H.T., Hartung T., Pamies D. Microglia increase inflammatory responses in iPSC-derived human brainspheres. Front. Microbiol. 2018;9:2766. - PMC - PubMed
    1. Abud E.M., Ramirez R.N., Martinez E.S., Healy L.M., Nguyen C.H.H., Newman S.A., Yeromin A.V., Scarfone V.M., Marsh S.E., Fimbres C. iPSC-derived human microglia-like cells to study neurological diseases. Neuron. 2017;94:278–293.e9. - PMC - PubMed
    1. Butovsky O., Weiner H.L. Microglial signatures and their role in health and disease. Nat. Rev. Neurosci. 2018;19:622–635. - PMC - PubMed
    1. Casano A.M., Peri F. Microglia: multitasking specialists of the brain. Dev. Cell. 2015;32:469–477. - PubMed
    1. Catarino T., Ribeiro L., Santos S.D., Carvalho A.L. Regulation of synapse composition by protein acetylation: the role of acetylated cortactin. J. Cell Sci. 2013;126:149–162. - PubMed

Publication types

MeSH terms