. 2021 Nov:53:101307.
doi: 10.1016/j.molmet.2021.101307. Epub 2021 Jul 21.

Single cell functional genomics reveals plasticity of subcutaneous white adipose tissue (WAT) during early postnatal development

Affiliations

Single cell functional genomics reveals plasticity of subcutaneous white adipose tissue (WAT) during early postnatal development

Elizabeth A Rondini et al. Mol Metab. 2021 Nov.

Abstract

Objective: The current study addresses the cellular complexity and plasticity of subcutaneous (inguinal) white adipose tissue (iWAT) in mice during the critical periods of perinatal growth and establishment.

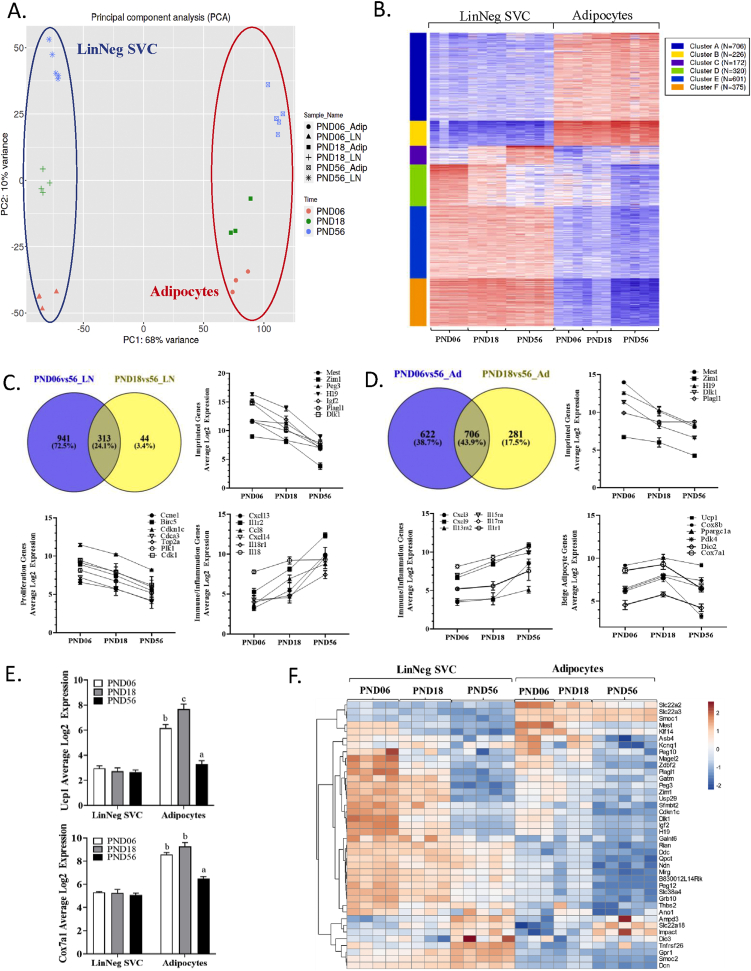
Methods: We performed a large-scale single cell transcriptomic (scRNA-seq) and epigenomic (snATAC-seq) characterization of cellular subtypes (adipose stromal cells (ASC) and adipocyte nuclei) during inguinal WAT (subcutaneous; iWAT) development in mice, capturing the early postnatal period (postnatal days (PND) 06 and 18) through adulthood (PND56).

Results: Perinatal and adult iWAT contain 3 major ASC subtypes that can be independently identified by RNA expression profiles and DNA transposase accessibility. Furthermore, the transcriptomes and enhancer landscapes of both ASC and adipocytes dynamically change during postnatal development. Perinatal ASC (PND06) are highly enriched for several imprinted genes (IGs; e.g., Mest, H19, Igf2) and extracellular matrix proteins whose expression then declines prior to weaning (PND18). By comparison, adult ASC (PND56) are more enriched for transcripts associated with immunoregulation, oxidative stress, and integrin signaling. Two clusters of mature adipocytes, identified through single nuclei RNA sequencing (snRNA-seq), were distinctive for proinflammatory/immune or metabolic gene expression patterns that became more transcriptionally diverse in adult animals. Single nuclei assay for transposase-accessible chromatin (snATAC-seq) revealed that differences in gene expression were associated with developmental changes in chromatin accessibility and predicted transcription factor motifs (e.g., Plagl1, Ar) in both stromal cells and adipocytes.

Conclusions: Our data provide new insights into transcriptional and epigenomic signaling networks important during iWAT establishment at a single cell resolution, with important implications for the field of metabolic programming.

Keywords: Adipocytes; Development; Imprinted genes; Single cell ATAC-Seq; Single cell RNA-Seq; White adipose tissue.


Figures

Figure 1
Figure 1
Bulk RNA-seq of stromal vascular cells (LinNeg SVC) and adipocytes isolated from inguinal subcutaneous white adipose tissue (iWAT) of mice during postnatal development. Bulk RNA-seq (3′ end-seq) was performed on RNA isolated from stromal vascular cells (LinNeg SVC) and the floating adipocyte fraction of male C57BL/6J (B6) mice at postnatal days 06, 18, and 56 (PND06-56). (A) Principal component analysis (PCA) showing variance in gene expression due to differences among iWAT cell fractions (PC1, 68%) and developmental time (PC1, 10%; eclipses hand drawn). (B) Heatmap displaying k-means clustering of the 2,400 most variable genes across datasets. Clustering resolved 6 expression patterns. Data were centered and scaled by row (gene). Expression scale colors (low; blue) to (high; red). (C–D) Venn diagrams and expression plots depicting differential gene expression changes (DEGs; FDR P < 0.05, minimum fold-change > 3) in (C) stromal vascular cells (LinNeg SVC) and (D) adipocytes among developmental time points. PND56 samples were used as the reference group (denominator) for individual comparisons. (E) Log2 expression of Ucp1 and Cox7a1 mRNA in each cellular fraction. Different superscripts denote significant differences of developmental time on expression for each gene in the adipocyte fraction (P < 0.05). (F) Expression heatmap displaying imprinted genes. Clustering was performed using correlation distance and complete linkage. Values are scaled per gene (row).
Figure 2
Figure 2
scRNA-seq of stromal vascular cells isolated from the iWAT of mice during early postnatal development. Single-cell transcriptomics was performed on stromal vascular cells isolated from the inguinal white adipose tissue of C57BL/6J mice at select developmental time points (PND 06, 18, 56). (A) t-SNE plots of unintegrated and integrated single cell libraries displaying cell clusters in aggregate (top) and integrated libraries separated by developmental time (bottom). (B) t-SNE plots displaying marker gene expression of cell clusters from the integrated scRNA-seq libraries. (C) Heatmap displaying changes in gene expression within the ACS clusters during early postnatal development. (D) Protein interaction network and gene ontology of upregulated DEGs (average logFC > 0.5; minimum of 25% of cells) detected in ASC1a and ASC2 when comparing perinatal (PND06) to adult (PND56) time points.
Figure 3
Figure 3
snRNA-seq reveals transcriptionally heterogenous adipocyte nuclei in the iWAT of mice during early postnatal development. Single-nuclei RNA-seq was performed on nuclei isolated from inguinal adipocytes at select developmental time points (PND 06, 18, 56). (A) t-SNE plots of unintegrated and integrated single nuclei libraries showing cell clusters in aggregate (top left) and integrated libraries (top right) separated by developmental time (bottom). (B) t-SNE plots displaying general adipocyte and subpopulation-specific marker genes from integrated snRNA-seq libraries. (C) Pathway analysis of DEGs detected (logFC > 0.4; 15% of cells) when comparing the two adipocyte clusters (Adip1 vs. Adip2) at PND56. (D) Venn diagrams displaying DEGs (P < 0.05; average logFC > 0.4; min 15% of nuclei) detected in each adipocyte subpopulation when comparing early postnatal (PND06 or PND18) to adult (PND56) time points. (E) Violin plots displaying select time-dependent marker genes expressed within adipocyte nuclei subpopulations during postnatal development.
Figure 4
Figure 4
The chromatin landscape of adipose tissue stromal cells (ASC) changes during postnatal iWAT development. Stromal vascular cells (LinNeg SVC) were isolated from inguinal white adipose tissue of C57BL/6J mice at select developmental time points (PND 06, 18, 56). Nuclei were purified and snATAC-seq was performed using the 10X Genomics platform, as described in the Methods. (A) t-SNE plots of integrated snATAC-seq libraries displaying aggregated nuclei clusters identified from (top) the snATAC-seq peak matrix and (bottom) following integration and label transfer with our scRNA-seq dataset. (B) t-SNE plots displaying marker gene activity in the integrated snATAC-seq libraries. (C) Fragment length histogram of the first 10 Mbp on chromosome 1, transcription start site enrichment plot, and a pie chart displaying peak annotation distribution. (D) Line graph displaying the number of differentially accessible regions (DARs; P < 0.05; average logFC > 0.25; min 15% of nuclei) detected in ASC populations during postnatal development and gene ontology of the annotated DARs. (E) Pseudo-bulk accessibility tracks for select genes separated by ASC cluster and postnatal time point. Shaded areas (hand-drawn) indicate peaks that were differentially accessible.
Figure 5
Figure 5
Postnatal development influences chromatin accessibility in iWAT adipocytes. Adipocyte nuclei were isolated from the inguinal white adipose tissue of C57BL/6J male mice at postnatal days 06, 18, and 56 and processed for snATAC-seq using the 10X Genomics platform as described in the Methods. (A) t-SNE plots of integrated snATAC-seq libraries displaying cell clusters identified from (top) the peak matrix and (bottom) following integration and label transfer with our snRNA-seq dataset. Some differences in cluster labeling between datasets were due to differences in the presence of contaminating cells within each cell preparation. (B) t-SNE plots displaying marker gene activity from the integrated snATAC-seq libraries. (C) Fragment length histogram of the first 10 Mbp on chromosome 1, transcription start site enrichment plot, and a pie chart displaying peak annotation distribution. (D) Line graph displaying the number of differentially accessible regions (DARs; P < 0.05; average logFC > 0.25; min 15% of nuclei) detected in adipocyte nuclei across postnatal development and gene ontology of annotated DARs. (E) Pseudo-bulk accessibility tracks for select genes affected by postnatal development in adipocytes. Shaded areas (hand-drawn) indicate peaks that were differentially accessible.
Figure 6
Figure 6
Motif activity, gene expression, and transcription factor (TF) footprints within DARs from (A–C) stromal vascular and (D–F) adipocyte nuclei as detected by snATAC-seq. Nuclei were isolated from SVC and floating adipocytes in inguinal white adipose tissue of C57BL/6J mice at select developmental time points (PND 06, 18, 56). snATAC-seq was performed using the 10X Genomics platform, as described in the Methods. (A) Heatmap displaying per cell motif activity in ASC clusters, (B) scRNA-seq expression of transcription factors that bind enriched motifs within stromal cell clusters, and (C) TF footprints of select motifs in stromal cells. (D) Heatmap displaying per cell motif activity in adipocyte nuclei, (E) snRNA-seq expression of transcription factors that bind enriched motifs, and (F) TF footprints of select motifs in adipocyte nuclei affected by time.

References

    1. Choe S.S., Huh J.Y., Hwang I.J., Kim J.I., Kim J.B. Adipose tissue remodeling: its role in energy metabolism and metabolic disorders. Frontiers in Endocrinology. 2016;7:30. - PMC - PubMed
    1. Luo L., Liu M. Adipose tissue in control of metabolism. Journal of Endocrinology. 2016;231(3):R77–R99. - PMC - PubMed
    1. Wang P., Mariman E., Renes J., Keijer J. The secretory function of adipocytes in the physiology of white adipose tissue. Journal of Cellular Physiology. 2008;216(1):3–13. - PubMed
    1. Coelho M., Oliveira T., Fernandes R. Biochemistry of adipose tissue: an endocrine organ. Archives of Medical Science. 2013;9(2):191–200. - PMC - PubMed
    1. Bodis K., Roden M. Energy metabolism of white adipose tissue and insulin resistance in humans. European Journal of Clinical Investigation. 2018;48(11) - PubMed

Publication types