

Genomic Analysis of Response to Neoadjuvant Chemotherapy in Esophageal Adenocarcinoma
- PMID: 34298611
- PMCID: PMC8308111
- DOI: 10.3390/cancers13143394
Genomic Analysis of Response to Neoadjuvant Chemotherapy in Esophageal Adenocarcinoma
Abstract
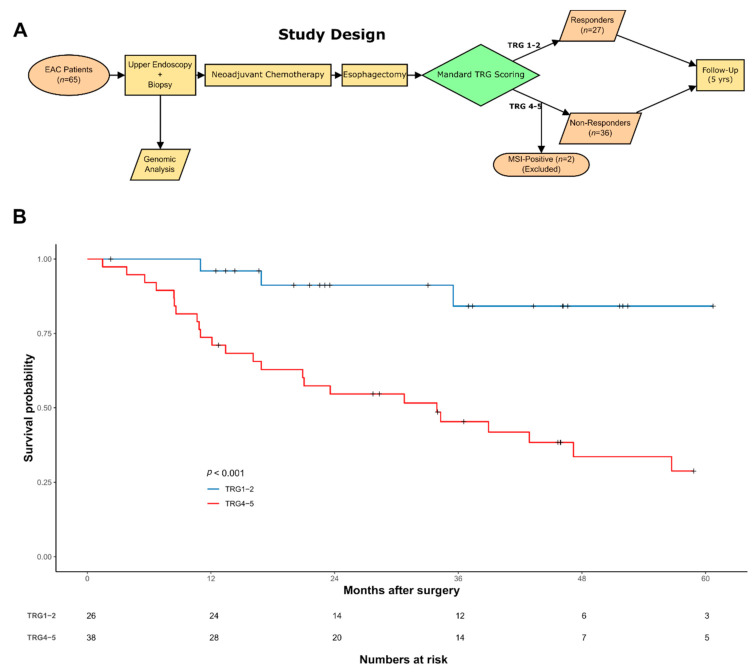
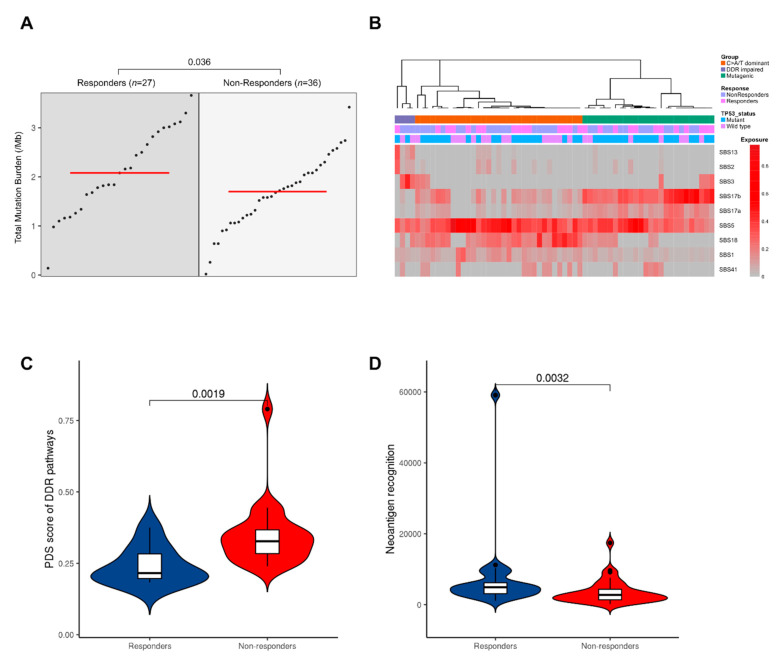
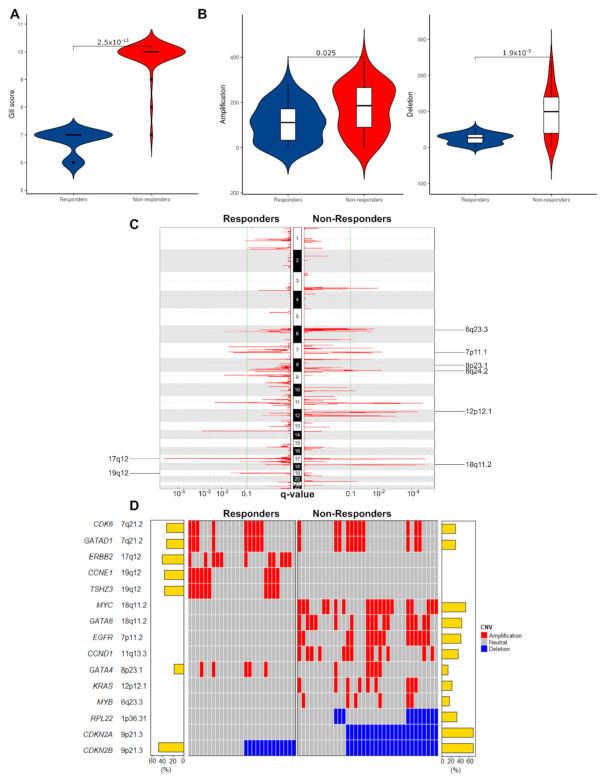
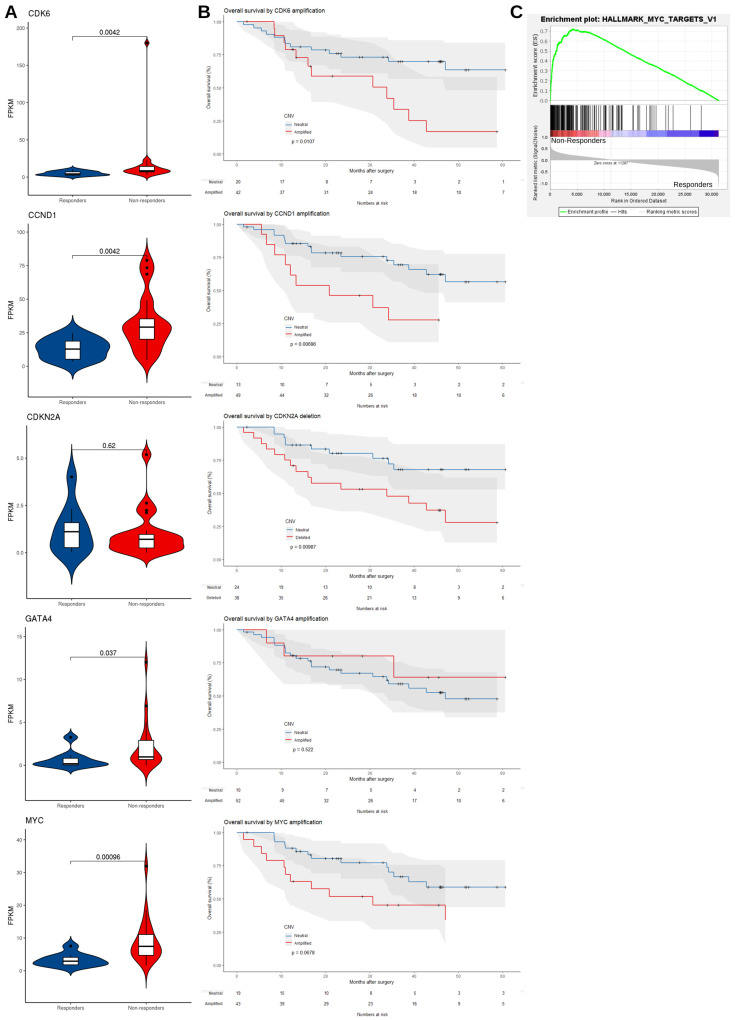
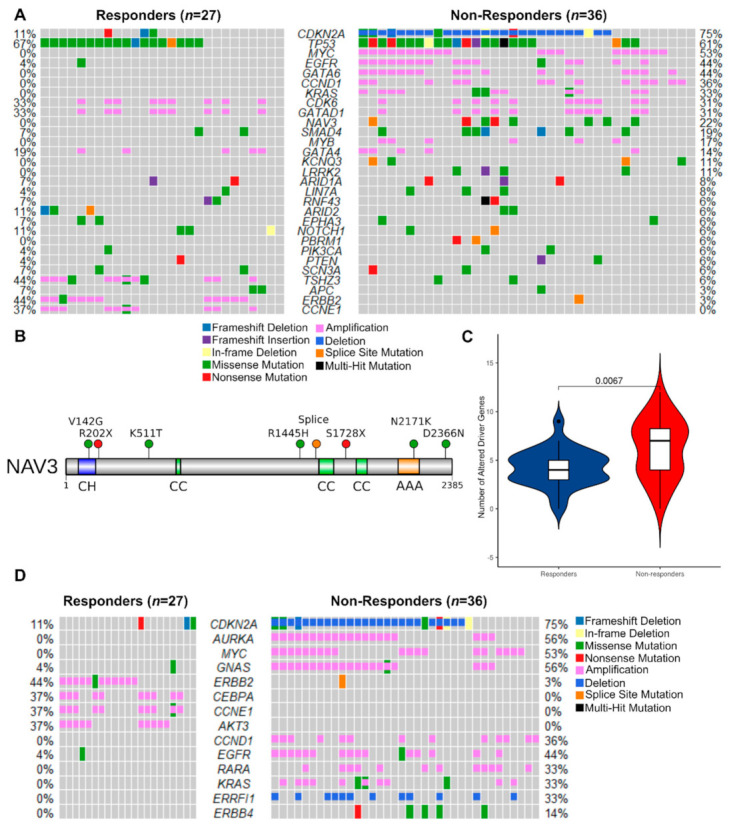
Neoadjuvant therapy followed by surgery is the standard of care for locally advanced esophageal adenocarcinoma (EAC). Unfortunately, response to neoadjuvant chemotherapy (NAC) is poor (20-37%), as is the overall survival benefit at five years (9%). The EAC genome is complex and heterogeneous between patients, and it is not yet understood whether specific mutational patterns may result in chemotherapy sensitivity or resistance. To identify associations between genomic events and response to NAC in EAC, a comparative genomic analysis was performed in 65 patients with extensive clinical and pathological annotation using whole-genome sequencing (WGS). We defined response using Mandard Tumor Regression Grade (TRG), with responders classified as TRG1-2 (n = 27) and non-responders classified as TRG4-5 (n =38). We report a higher non-synonymous mutation burden in responders (median 2.08/Mb vs. 1.70/Mb, p = 0.036) and elevated copy number variation in non-responders (282 vs. 136/patient, p < 0.001). We identified copy number variants unique to each group in our cohort, with cell cycle (CDKN2A, CCND1), c-Myc (MYC), RTK/PIK3 (KRAS, EGFR) and gastrointestinal differentiation (GATA6) pathway genes being specifically altered in non-responders. Of note, NAV3 mutations were exclusively present in the non-responder group with a frequency of 22%. Thus, lower mutation burden, higher chromosomal instability and specific copy number alterations are associated with resistance to NAC.
Keywords: NAV3; chemotherapy; esophageal adenocarcinoma; genomics; mutation; response.
Conflict of interest statement
The authors declare no conflict of interest. The funders had no role in the design of the study; in the collection, analyses, or interpretation of data; in the writing of the manuscript, or in the decision to publish the results.
Figures
References
-
- Ronellenfitsch U., Schwarzbach M., Hofheinz R., Kienle P., Kieser M., Slanger T.E., Jensen K., Burmeister B., Kelsen D., Niedzwiecki D., et al. Perioperative chemo(radio)therapy versus primary surgery for resectable adenocarcinoma of the stomach, gastroesophageal junction, and lower esophagus. Cochrane Database Syst. Rev. 2013 doi: 10.1002/14651858.CD008107.pub2. - DOI - PMC - PubMed
-
- Girling D.J., Bancewicz J., Clark P.I., Smith D.B., Donnelly R.J., Fayers P.M., Weeden S., Girling D.J., Hutchinson T., Harvey A., et al. Surgical resection with or without preoperative chemotherapy in oesophageal cancer: A randomised controlled trial. Lancet. 2002;359:1727–1733. doi: 10.1016/S0140-6736(02)08651-8. - DOI - PubMed
-
- Cunningham D., Allum W.H., Stenning S.P., Thompson J.N., van de Velde C.J.H., Nicolson M., Scarffe J.H., Lofts F.J., Falk S.J., Iveson T.J., et al. Perioperative Chemotherapy versus Surgery Alone for Resectable Gastroesophageal Cancer. N. Engl. J. Med. 2006;355:11–20. doi: 10.1056/NEJMoa055531. - DOI - PubMed
-
- Al-Batran S.E., Homann N., Pauligk C., Goetze T.O., Meiler J., Kasper S., Kopp H.G., Mayer F., Haag G.M., Luley K., et al. Perioperative chemotherapy with fluorouracil plus leucovorin, oxaliplatin, and docetaxel versus fluorouracil or capecitabine plus cisplatin and epirubicin for locally advanced, resectable gastric or gastro-oesophageal junction adenocarcinoma (FLOT4): A randomised, phase 2/3 trial. Lancet. 2019;393:1948–1957. doi: 10.1016/S0140-6736(18)32557-1. - DOI - PubMed
Grants and funding
LinkOut - more resources
Full Text Sources
Research Materials
Miscellaneous
