. 2021 Jul 9;22(14):7396.
doi: 10.3390/ijms22147396.

Genome-Wide Identification and Characterization of PIN-FORMED (PIN) Gene Family Reveals Role in Developmental and Various Stress Conditions in Triticum aestivum L

Affiliations

Genome-Wide Identification and Characterization of PIN-FORMED (PIN) Gene Family Reveals Role in Developmental and Various Stress Conditions in Triticum aestivum L

Manu Kumar et al. Int J Mol Sci. .

Abstract

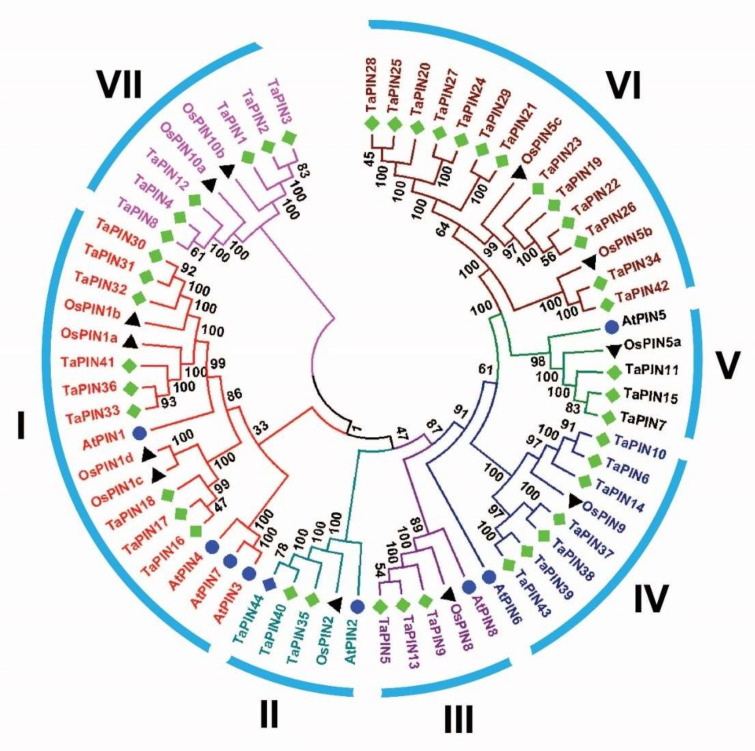
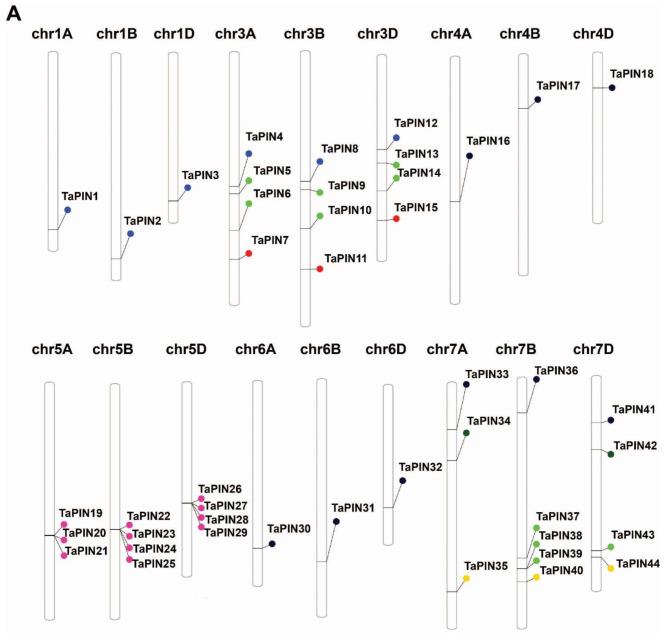
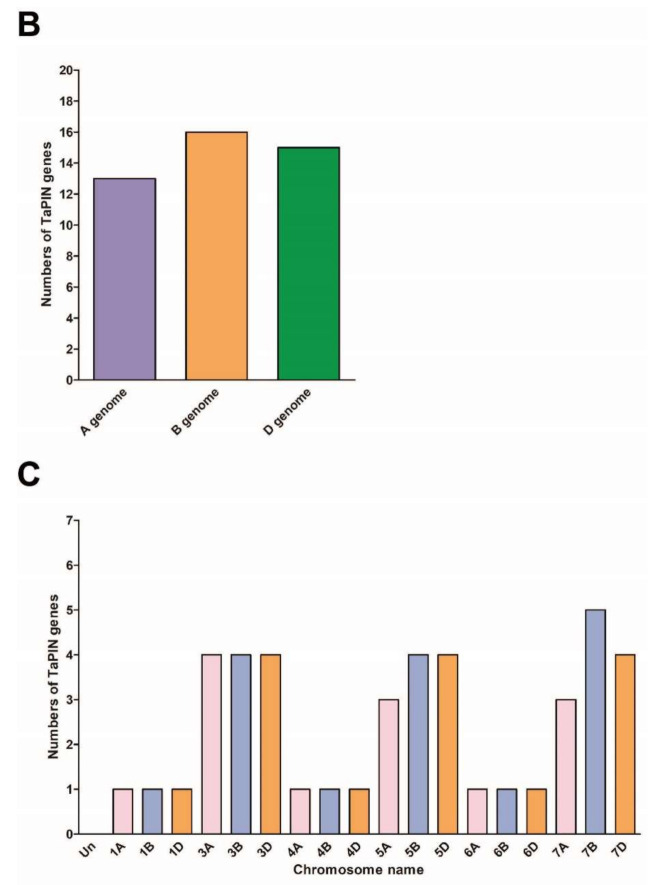
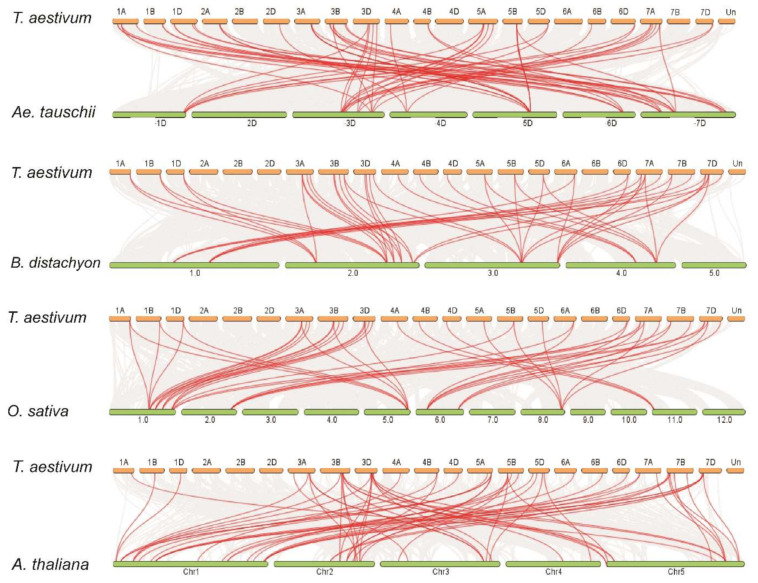
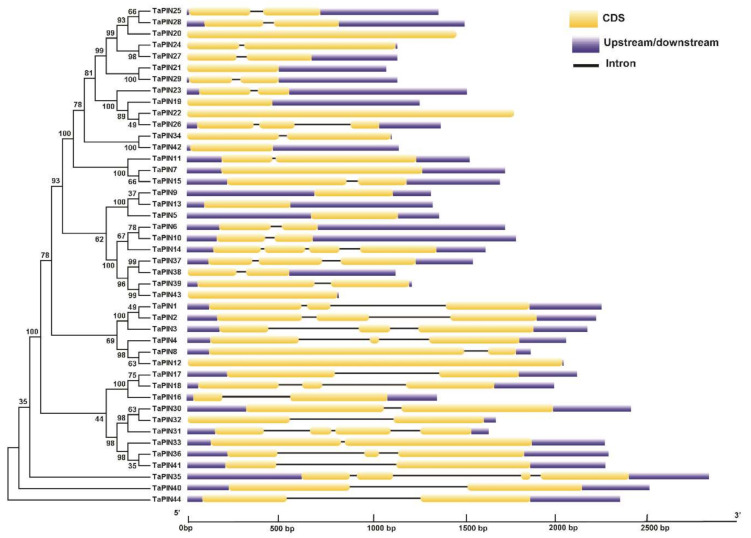
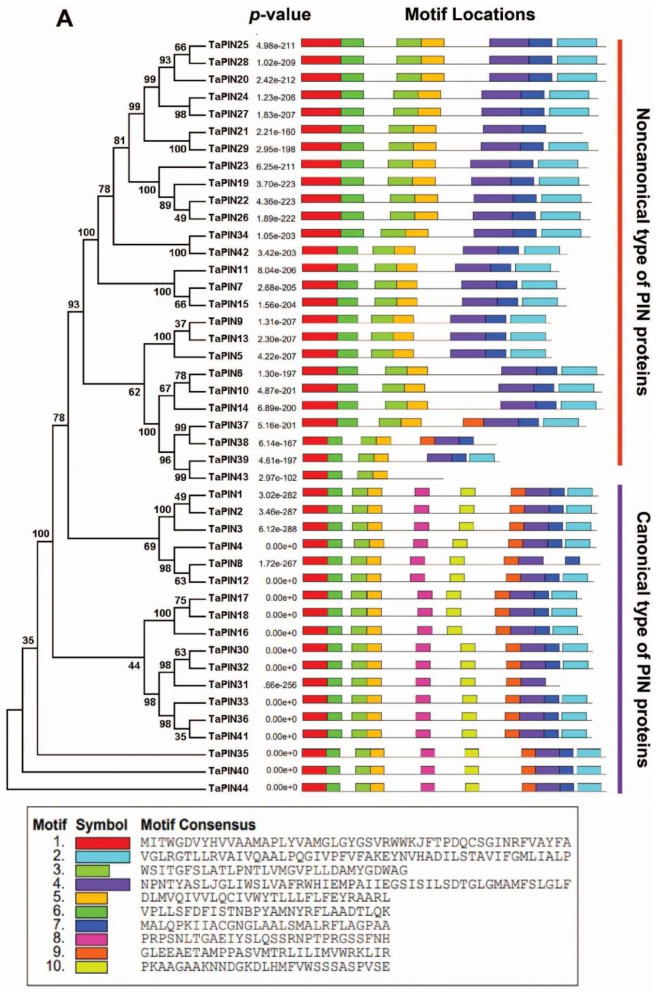
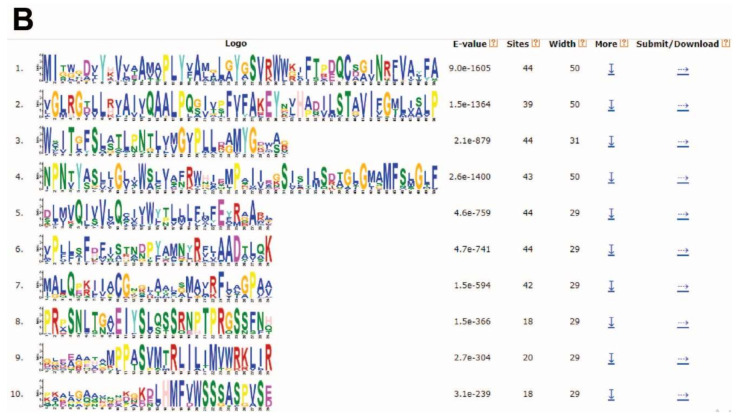
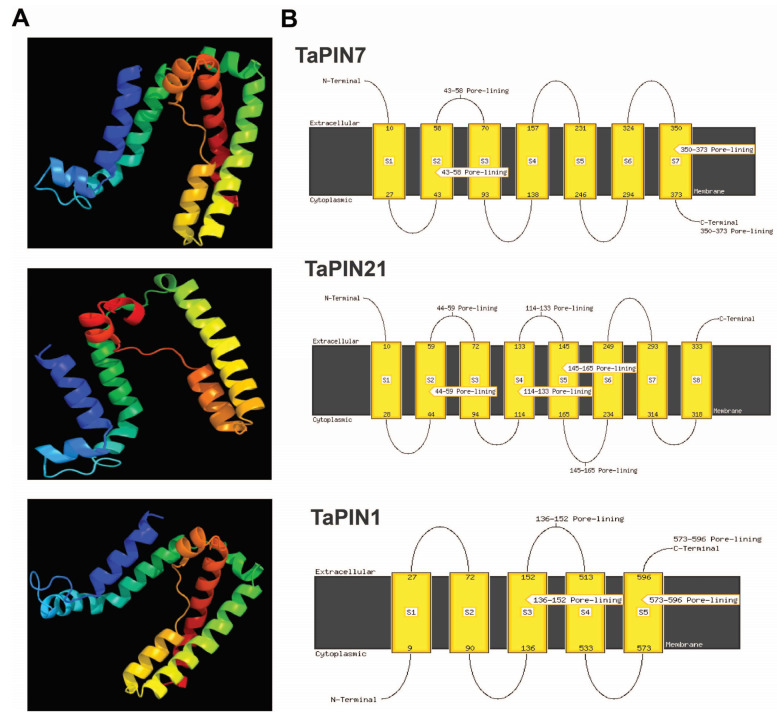
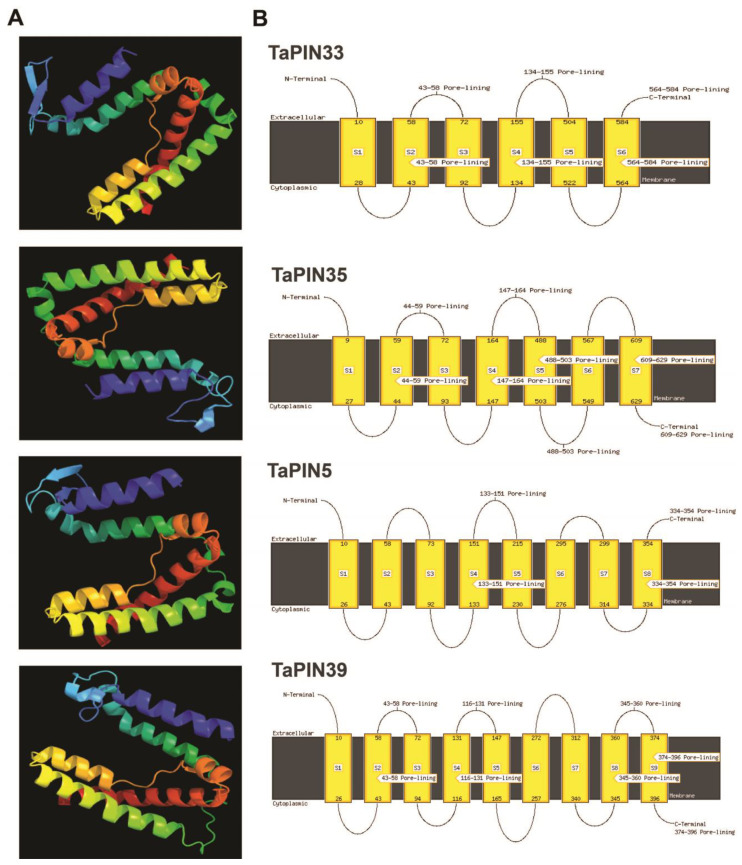
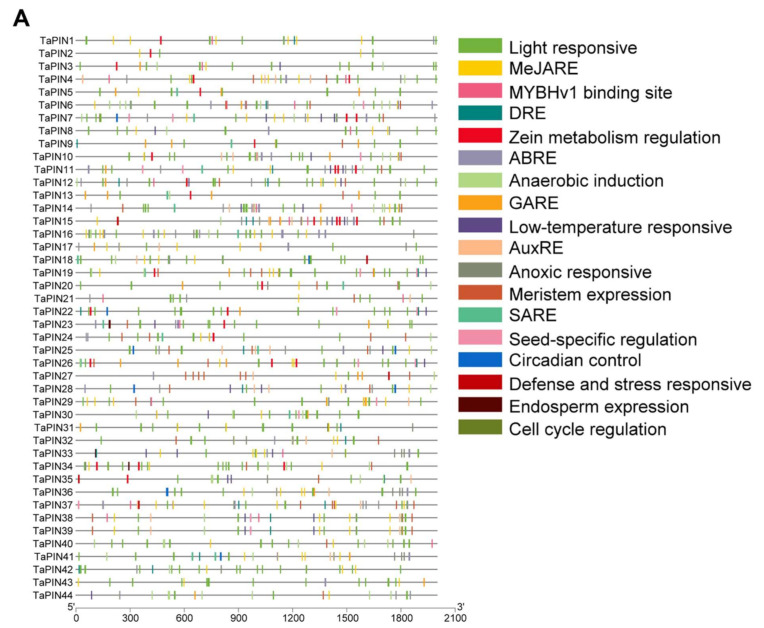
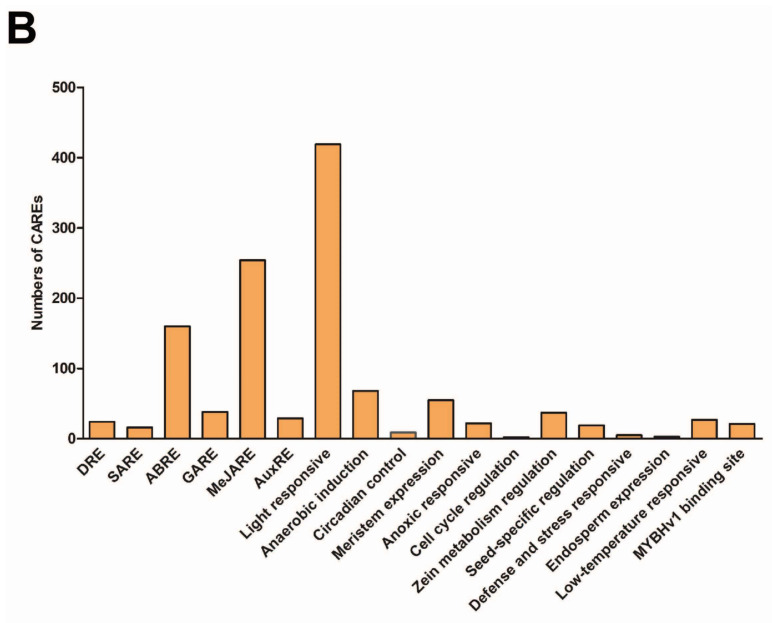
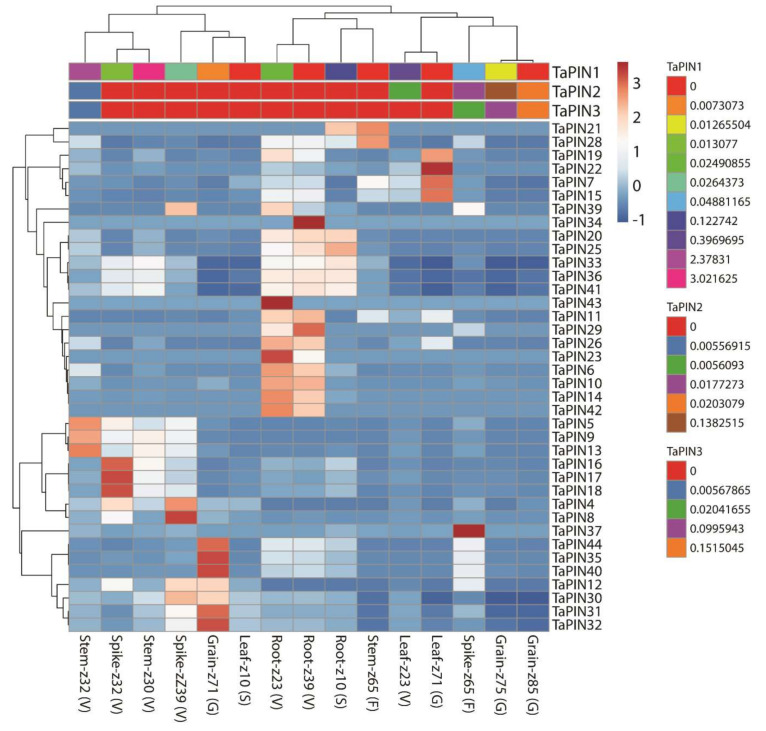
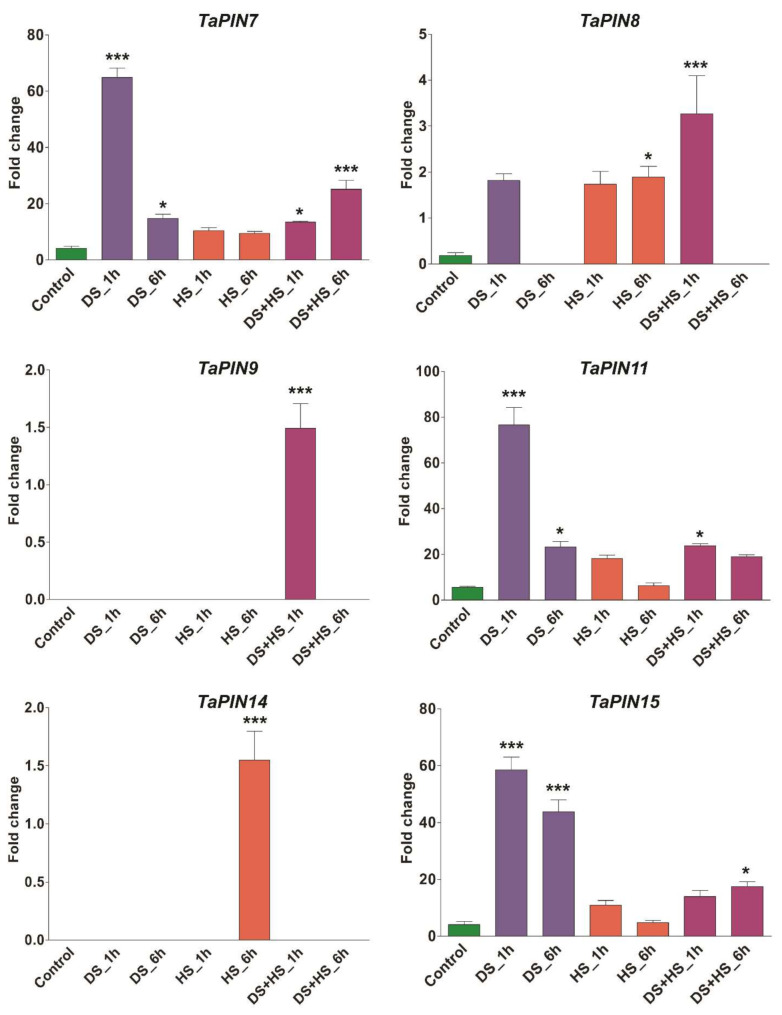
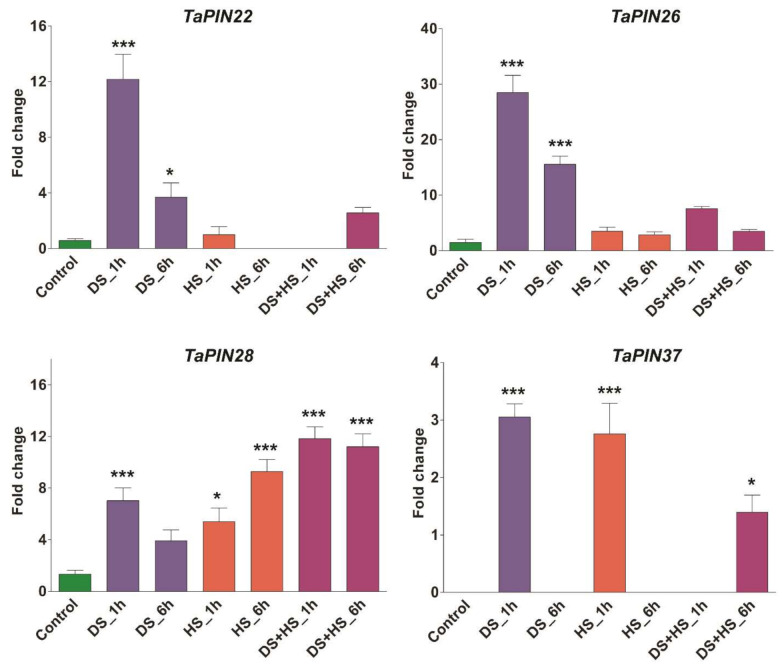
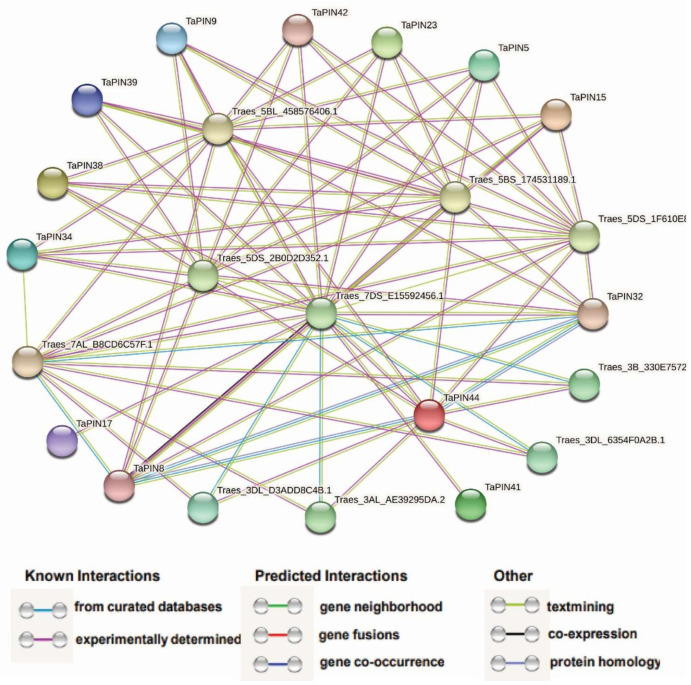
PIN-FORMED (PIN) genes play a crucial role in regulating polar auxin distribution in diverse developmental processes, including tropic responses, embryogenesis, tissue differentiation, and organogenesis. However, the role of PIN-mediated auxin transport in various plant species is poorly understood. Currently, no information is available about this gene family in wheat (Triticum aestivum L.). In the present investigation, we identified the PIN gene family in wheat to understand the evolution of PIN-mediated auxin transport and its role in various developmental processes and under different biotic and abiotic stress conditions. In this study, we performed genome-wide analysis of the PIN gene family in common wheat and identified 44 TaPIN genes through a homology search, further characterizing them to understand their structure, function, and distribution across various tissues. Phylogenetic analyses led to the classification of TaPIN genes into seven different groups, providing evidence of an evolutionary relationship with Arabidopsis thaliana and Oryza sativa. A gene exon/intron structure analysis showed a distinct evolutionary path and predicted the possible gene duplication events. Further, the physical and biochemical properties, conserved motifs, chromosomal, subcellular localization, transmembrane domains, and three-dimensional (3D) structure were also examined using various computational approaches. Cis-elements analysis of TaPIN genes showed that TaPIN promoters consist of phytohormone, plant growth and development, and stress-related cis-elements. In addition, expression profile analysis also revealed that the expression patterns of the TaPIN genes were different in different tissues and developmental stages. Several members of the TaPIN family were induced during biotic and abiotic stress. Moreover, the expression patterns of TaPIN genes were verified by qRT-PCR. The qRT-PCR results also show a similar expression with slight variation. Therefore, the outcome of this study provides basic genomic information on the expression of the TaPIN gene family and will pave the way for dissecting the precise role of TaPINs in plant developmental processes and different stress conditions.

Keywords: PIN; auxin; biotic and abiotic stress; cis-acting regulatory elements; polar auxin transport; qRT-PCR.


Conflict of interest statement

Authors declare no conflict of interest.

Figures

Figure 1
Figure 1
Phylogenetic analysis of PIN proteins among wheat (44), Arabidopsis (8), and rice (12) using MEGAX by the neighbor joining method.
Figure 2
Figure 2
Genomic distribution of identified PIN genes on the 21 chromosomes of wheat and within the three subgenomes. (A) Schematic representations of the chromosomal distribution of PIN genes on the 21 chromosomes of wheat and the name of the gene on the right side. The colored round circle on the chromosomes indicates the position of the PIN genes. The chromosome numbers of the three subgenomes are indicated at the top of each bar. (B) Distribution of PIN genes in the three subgenomes. (C) Distribution of PIN genes across 21 chromosomes.
Figure 2
Figure 2
Genomic distribution of identified PIN genes on the 21 chromosomes of wheat and within the three subgenomes. (A) Schematic representations of the chromosomal distribution of PIN genes on the 21 chromosomes of wheat and the name of the gene on the right side. The colored round circle on the chromosomes indicates the position of the PIN genes. The chromosome numbers of the three subgenomes are indicated at the top of each bar. (B) Distribution of PIN genes in the three subgenomes. (C) Distribution of PIN genes across 21 chromosomes.
Figure 3
Figure 3
Syntenic relationships of TaPIN genes between Aegilops tauschii, Brachypodium distachyon, Oryza sativa and Arabidopsis thaliana. The gray lines in the background represent the collinear blocks within Triticum aestivum and other plant genomes, while the red lines highlight the syntenic PIN gene pairs.
Figure 4
Figure 4
Exon–intron organization of the TaPIN genes. Yellow boxes represent exons, untranslated regions (UTRs) are indicated by blue boxes, and black lines represent introns. The lengths of the boxes and lines are scaled based on gene length. The exon and intron sizes can be estimated using the scale at the bottom.
Figure 5
Figure 5
Conserved motifs of TaPIN genes elucidated by MEME. (A) Colored boxes representing different conserved motifs having different sequences and sizes. (B) Sequence logo conserved motif of the wheat PIN proteins. The overall height of each stack represents the degree of conservation at this position, while the height of the individual letters within each stack indicates the relative frequency of the corresponding amino acids.
Figure 5
Figure 5
Conserved motifs of TaPIN genes elucidated by MEME. (A) Colored boxes representing different conserved motifs having different sequences and sizes. (B) Sequence logo conserved motif of the wheat PIN proteins. The overall height of each stack represents the degree of conservation at this position, while the height of the individual letters within each stack indicates the relative frequency of the corresponding amino acids.
Figure 6
Figure 6
Predicted 3D structures and transmembrane helix of seven selected TaPIN proteins. (A) Three-dimensional structure and (B) TM helix of seven TaPINs representing each group of a phylogenetic tree. The cytoplasmic and extracellular sides of the membrane are labeled, and the start and end of each transmembrane helix are indicated with a number.
Figure 6
Figure 6
Predicted 3D structures and transmembrane helix of seven selected TaPIN proteins. (A) Three-dimensional structure and (B) TM helix of seven TaPINs representing each group of a phylogenetic tree. The cytoplasmic and extracellular sides of the membrane are labeled, and the start and end of each transmembrane helix are indicated with a number.
Figure 7
Figure 7
Putative cis-acting regulatory elements (CAREs) of the TaPIN gene family. The CAREs analysis was performed with the 2 kb upstream region using the PlantCARE online server. (A) Hormone-responsive elements, stress-responsive elements, growth and development-related elements, light-responsive elements, and other elements with unknown functions are shown by different colors. (B) Most commonly occurring CAREs in TaPINs.
Figure 7
Figure 7
Putative cis-acting regulatory elements (CAREs) of the TaPIN gene family. The CAREs analysis was performed with the 2 kb upstream region using the PlantCARE online server. (A) Hormone-responsive elements, stress-responsive elements, growth and development-related elements, light-responsive elements, and other elements with unknown functions are shown by different colors. (B) Most commonly occurring CAREs in TaPINs.
Figure 8
Figure 8
Heatmap representing the expression pattern of TaPIN genes in various developmental stages. TPM values were directly used to create the heatmap.
Figure 9
Figure 9
Quantitative real-time PCR analysis of selected TaPIN genes in response to drought and heat stress to verify RNA seq data. The wheat actin gene was used as the internal control to standardize the RNA samples for each reaction. Asterisk indicates significant differences compared with control over bars representing results of Tukey HSD test at the <0.05 and <0.001 levels (* p < 0.05 and *** p < 0.001). Error bars show standard deviation. Data are mean ± SD (n = 3).
Figure 9
Figure 9
Quantitative real-time PCR analysis of selected TaPIN genes in response to drought and heat stress to verify RNA seq data. The wheat actin gene was used as the internal control to standardize the RNA samples for each reaction. Asterisk indicates significant differences compared with control over bars representing results of Tukey HSD test at the <0.05 and <0.001 levels (* p < 0.05 and *** p < 0.001). Error bars show standard deviation. Data are mean ± SD (n = 3).
Figure 10
Figure 10
Protein–protein interaction analysis of TaPINs proteins. Protein–protein interaction network produced by STRINGV9.1, where each node represents a protein and each edge represents an interaction, colored by evidence type.

References

    1. Benjamins R., Scheres B. Auxin: The looping star in plant development. Annu. Rev. Plant Biol. 2008;59:443–465. doi: 10.1146/annurev.arplant.58.032806.103805. - DOI - PubMed
    1. Ganguly A., Park M., Kesawat M.S., Cho H.-T. Functional Analysis of the Hydrophilic Loop in Intracellular Trafficking of Arabidopsis PIN-FORMED Proteins. Plant Cell. 2014;26:1570–1585. doi: 10.1105/tpc.113.118422. - DOI - PMC - PubMed
    1. Zhao Y. Essential Roles of Local Auxin Biosynthesis in Plant Development and in Adaptation to Environmental Changes. Annu. Rev. Plant. Biol. 2018;69:417–435. doi: 10.1146/annurev-arplant-042817-040226. - DOI - PubMed
    1. Dubey S.M., Serre N.B., Oulehlová D., Vittal P., Fendrych M. No Time for Transcription—Rapid Auxin Responses in Plants. Cold Spring Harb. Perspect. Biol. 2021;13:a039891. doi: 10.1101/cshperspect.a039891. - DOI - PMC - PubMed
    1. Bennett M.J., Marchant A., Green H.G., May S., Ward S.P., Millner P.A., Walker A., Schulz B., Feldmann K.A., Bennett M.J., et al. Arabidopsis AUX1 Gene: A Permease-Like Regulator of Root Gravitropism. Science. 1996;273:948–950. doi: 10.1126/science.273.5277.948. - DOI - PubMed

MeSH terms

Grants and funding

LinkOut - more resources