. 2021 Jul 12;22(14):7441.
doi: 10.3390/ijms22147441.

Antifungal Activity and Biosynthetic Potential of New Streptomyces sp. MW-W600-10 Strain Isolated from Coal Mine Water

Affiliations

Antifungal Activity and Biosynthetic Potential of New Streptomyces sp. MW-W600-10 Strain Isolated from Coal Mine Water

Piotr Siupka et al. Int J Mol Sci. .

Abstract

Crop infections by fungi lead to severe losses in food production and pose risks for human health. The increasing resistance of pathogens to fungicides has led to the higher usage of these chemicals, which burdens the environment and highlights the need to find novel natural biocontrol agents. Members of the genus Streptomyces are known to produce a plethora of bioactive compounds. Recently, researchers have turned to extreme and previously unexplored niches in the search for new strains with antimicrobial activities. One such niche are underground coal mine environments. We isolated the new Streptomyces sp. MW-W600-10 strain from coal mine water samples collected at 665 m below ground level. We examined the antifungal activity of the strain against plant pathogens Fusarium culmorum DSM62188 and Nigrospora oryzae roseF7. Furthermore, we analyzed the strain's biosynthetic potential with the antiSMASH tool. The strain showed inhibitory activity against both fungi strains. Genome mining revealed that it has 39 BGCs, among which 13 did not show similarity to those in databases. Additionally, we examined the activity of the Streptomyces sp. S-2 strain isolated from black soot against F. culmorum DSM62188. These results show that coal-related strains could be a source of novel bioactive compounds. Future studies will elucidate their full biotechnological potential.

Keywords: Streptomyces; antifungal activity; biosynthetic gene clusters; coal-related environments; gene expression; genome mining; quantitative PCR.


Conflict of interest statement

The authors do not have any conflict of interest.

Figures

Figure 1
Figure 1
Maximum-likelihood phylogenetic tree of the Streptomyces sp. MW-W600-10 strain. The tree shows the phylogenetic relation between MW-W600-10 and other Streptomyces strains. The tree was calculated using IQ-TREE software based on the alignment of core proteomes of 50 Actinobacteria strains, and Micromonospora strains were used as an outgroup. Numbers at the nodes in red represent bootstrap values (% of 1000 repeats). The position of MW-W600-10 has been highlighted in green; the position of another coal-related strain, Streptomyces sp. S-2, has been highlighted in red for better visibility.
Figure 2
Figure 2
Inhibition of fungal growth by Streptomyces sp. MW-W600-10. Representative pictures of the MW-W600-10 strain in co-culture with both examined fungi on MHA plates. Pictures from 3 day Streptomyces pre-culture with MW-W600-10 inoculated at 25 mm from the center of the plates. An 8 mm agar puck with fungal mycelium was placed at the plate center. Pictures were taken at the 3rd, 7th, and 14th day of co-culture. The scale bar represents a distance of 10 mm.
Figure 3
Figure 3
Inhibition of fungal growth by coal-related Streptomyces strains. (A) Effect of co-culture with MW-W600-10 strain on the growth of Nigrospora oryzae roseF7 and Fusarium culmorum DSM62188; (B) effect of co-culture with S-2 strain on the growth of F. culmorum DSM62188. The charts compare the growth of fungal mycelium toward Streptomyces streak colonies (STR), the plate wall (WALL), and fungal growth on control plates (CTRL) for different co-cultures where Streptomyces were inoculated at 25 mm from the center of the plate. Results are shown for the 14th day of co-culture. For each experimental setup, 5 biological repeats were performed for co-cultures and 3 repeats for controls. The red border of the bars indicates the fungus reaching the plate wall or bacterial streaks by the day of measurement. Error bars represent the standard deviation of mycelial growth in independent biological experiments. Statistically significant differences between measurements analyzed for each experimental setup separately are marked by the (a) difference between all measurements or by the (b) difference between measurement and CTRL only (one-way ANOVA, followed by Tuckey’s post hoc test; p ≤ 0.05).
Figure 4
Figure 4
Influence of the distance of the inoculation of Streptomyces on the inhibition of fungi growth. The results present the growth toward the Streptomyces streak at the 14th day of co-culture with bacteria pre-incubated for 3 days. For each experimental setup, 5 biological repeats were performed. Error bars represent the standard deviation of mycelial growth in independent biological repeats. Statistically significant differences between measurements analyzed for each experimental setup separately are marked by “*” (one-way ANOVA, followed by Tuckey’s post hoc test; p ≤ 0.05).
Figure 5
Figure 5
Different effects of Streptomyces sp. MW-W600-10 and Streptomyces sp. S-2 on the growth of F. culmorum DSM62188 in co-cultures—simultaneous and with bacteria pre-incubated for 7 days. The charts compare the growth of fungal mycelium toward Streptomyces streak colonies (STR), the plate wall (WALL), and fungal growth on control plates (CTRL) for co-cultures with Streptomyces inoculated at a 25 mm distance from the center of the plate. Results are shown for the 3rd day of co-culture. For each experimental setup, 5 biological repeats were performed for co-cultures and 3 repeats for controls. The red border of the bars indicates the fungus reaching the plate wall or bacterial streaks by the day of measurement. Error bars represent the standard deviation of mycelial growth in independent biological experiments. Statistically significant differences between measurements analyzed for each experimental setup separately are marked by the (a) difference between all measurements or by the (b) difference between the measurement and CTRL only (one-way ANOVA, followed by Tukey’s post hoc test; p ≤ 0.05).
Figure 6
Figure 6
Comparison of number of BGCs in genomes of closely related Streptomyces strains and strains reported to have a high number of clusters. The BGCs were predicted using the antiSMASH tool, the results were manually investigated, “neighboring” clusters were not counted, and “interleaved” clusters were counted as separate clusters. Clusters not belonging to the shown groups were pooled in the “other” group. The maximum likelihood tree was generated based on the alignment of 18 single-copy genes found in each strain, where positions of coal-related strains have been highlighted for better visibility—MW-W600-10 in green and S-2 in red.
Figure 7
Figure 7
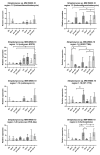
Relative expression of selected BGCs of Streptomyces sp. MW-W600-10 grown as a single culture (3D, pre-3D, 7D, and pre-7D) or in co-culture with F. culmorum DSM62188 (3D + F, pre-3D + F, 7D + F, and pre-7D + F). The strain was cultured in simultaneous (3D and 7D) cultures or with the pre-cultured Streptomyces strain for 3 (pre-3D) or 7 (pre-7D) days. The qPCR was performed on mRNA samples purified from cultures at the 3rd (3D; 3D + F), 6th (pre-3D; pre-3D + F), 7th (7D; 7D + F), and 14th (pre-7D; pre-7D + F) day of incubation. For each sample, two culture plates were used for mRNA purification, and each experimental setup comprised at least 3 biological repeats. The charts show mean values and standard deviations of the expression ratio relative to the control (average of 3D samples) after the removal of outliers. The scale has been adjusted for each cluster separately for better visibility. Statistically significant differences in relative expression levels in different experimental setups are marked by ‘a’ for expression levels significantly different from the expression in the 3D setup; *—significant difference between indicated setups (one-way ANOVA followed by Tukey’s post hoc test, p ≤ 0.05).
Figure 8
Figure 8
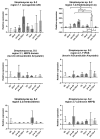
Relative expression of selected BGCs of Streptomyces sp. S-2 grown as a single culture (3D, pre-3D, 7D, and pre-7D) or in co-culture with F. culmorum DSM62188 (3D + F, pre-3D + F, 7D + F, and pre-7D + F). The strain was cultured in simultaneous (3D and 7D) cultures or with the pre-cultured Streptomyces strain for 3 (pre-3D) or 7 (pre-7D) days. The qPCR was performed on mRNA samples purified from cultures at the 3rd (3D; 3D + F), 6th (pre-3D; pre-3D + F), 7th (7D; 7D + F), and 14th (pre-7D; pre-7D + F) day of incubation. For each sample, two culture plates were used for mRNA purification, and each experimental setup comprised at least 3 biological repeats. The charts show mean values of the expression ratio relative to the control (average of 3D samples) after the removal of outliers. The scale has been adjusted for each cluster separately for better visibility. Statistically significant differences in relative expression levels in different experimental setups are marked by ‘a’ for expression levels significantly different from the expression in the 3D setup; *—significant difference between indicated setups (one-way ANOVA followed by Tukey’s post hoc test, p ≤ 0.05).

References

    1. Dean R., Van Kan J.A.L., Pretorius Z.A., Hammond-Kosack K.E., Di Pietro A., Spanu P.D., Rudd J.J., Dickman M., Kahmann R., Ellis J., et al. The Top 10 fungal pathogens in molecular plant pathology. Mol. Plant Pathol. 2012;13:414–430. doi: 10.1111/j.1364-3703.2011.00783.x. - DOI - PMC - PubMed
    1. Michielse C.B., Rep M. Pathogen profile update: Fusarium oxysporum. Mol. Plant Pathol. 2009;10:311–324. doi: 10.1111/j.1364-3703.2009.00538.x. - DOI - PMC - PubMed
    1. Feng J., Hwang R., Chang K.F., Hwang S.F., Strelkov S.E., Gossen B.D., Conner R.L., Turnbull G.D. Genetic variation in Fusarium avenaceum causing root rot on field pea. Plant Pathol. 2010;59:845–852. doi: 10.1111/j.1365-3059.2010.02313.x. - DOI
    1. Scherm B., Balmas V., Spanu F., Pani G., Delogu G., Pasquali M., Migheli Q. Fusarium culmorum: Causal agent of foot and root rot and head blight on wheat. Mol. Plant Pathol. 2013;14:323–341. doi: 10.1111/mpp.12011. - DOI - PMC - PubMed
    1. Goswami R.S., Kistler H.C. Heading for disaster: Fusarium graminearum on cereal crops. Mol. Plant Pathol. 2004;5:515–525. doi: 10.1111/j.1364-3703.2004.00252.x. - DOI - PubMed