. 2021 Jul 12;22(14):7474.
doi: 10.3390/ijms22147474.

Baricitinib, a JAK-STAT Inhibitor, Reduces the Cellular Toxicity of the Farnesyltransferase Inhibitor Lonafarnib in Progeria Cells

Affiliations

Baricitinib, a JAK-STAT Inhibitor, Reduces the Cellular Toxicity of the Farnesyltransferase Inhibitor Lonafarnib in Progeria Cells

Rouven Arnold et al. Int J Mol Sci. .

Abstract

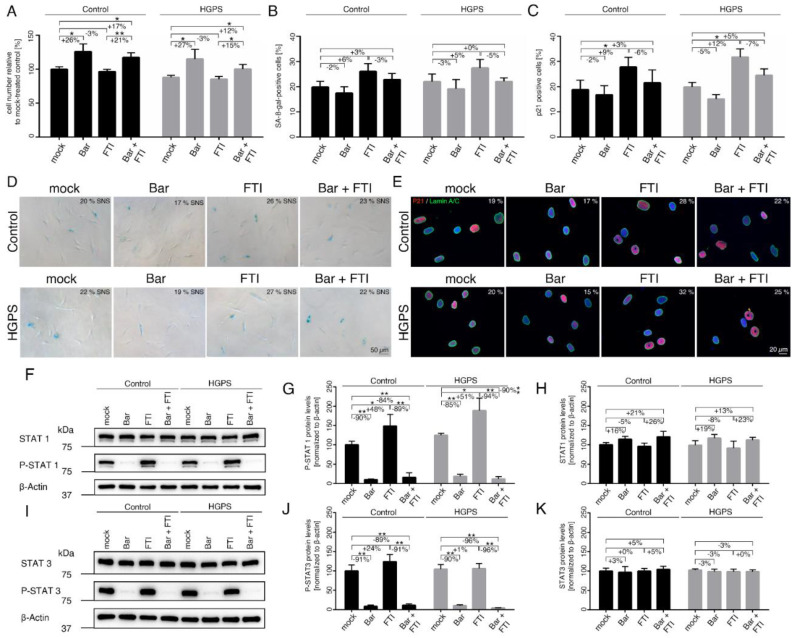
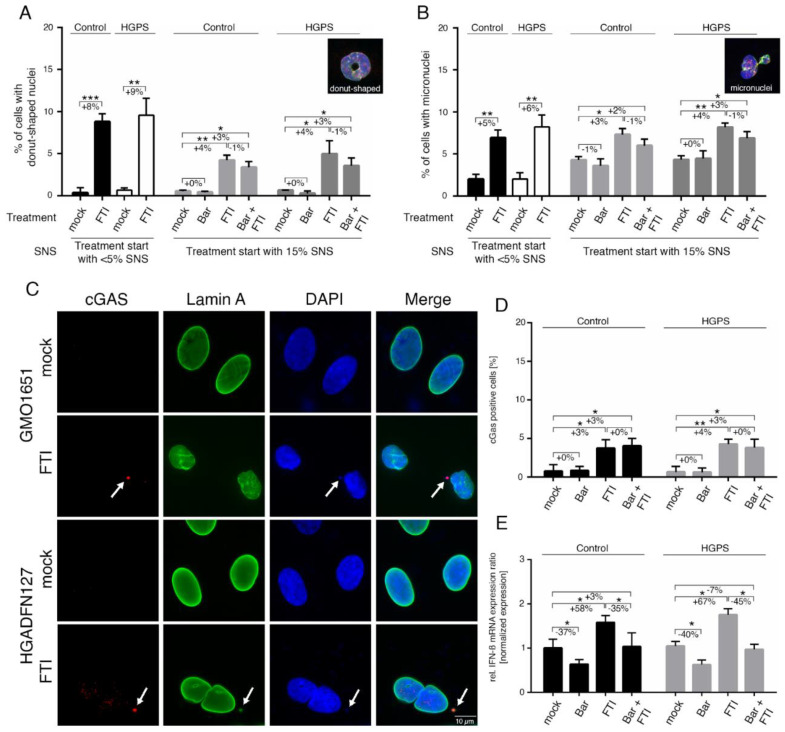
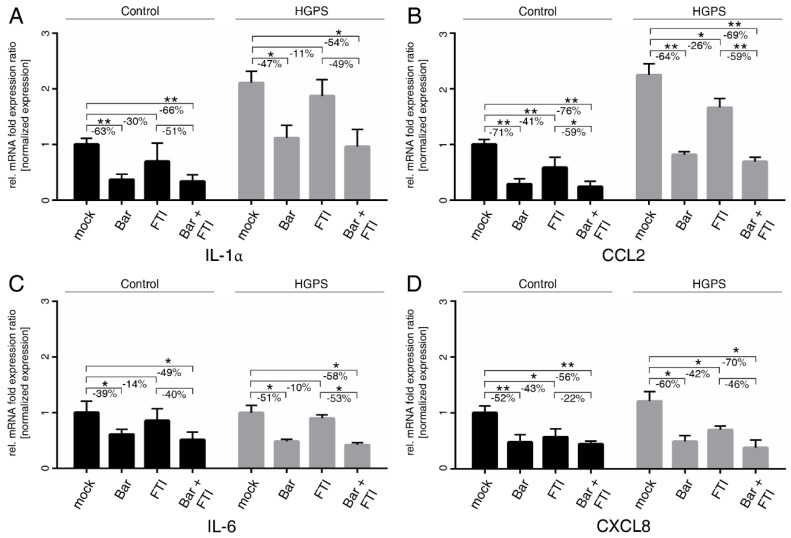
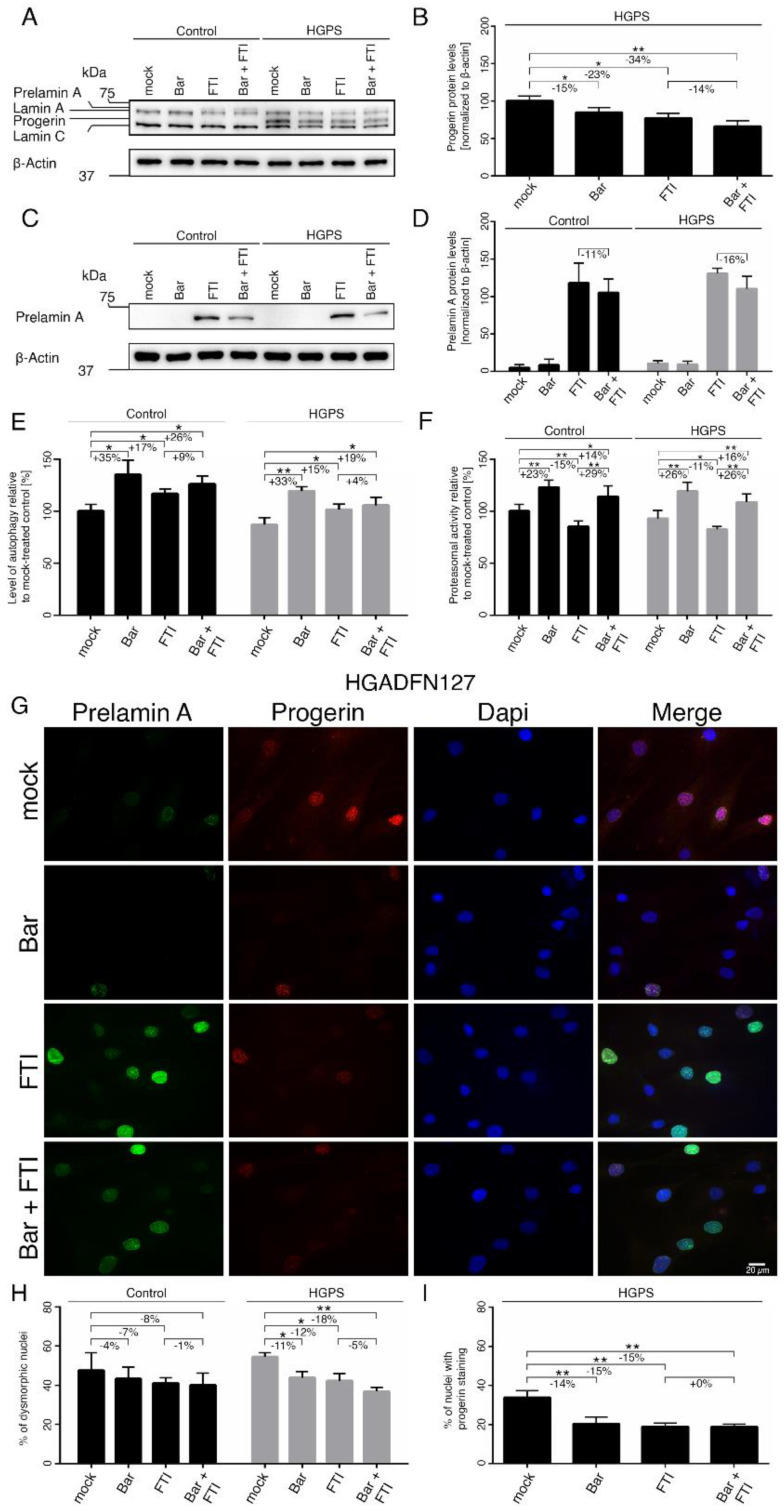
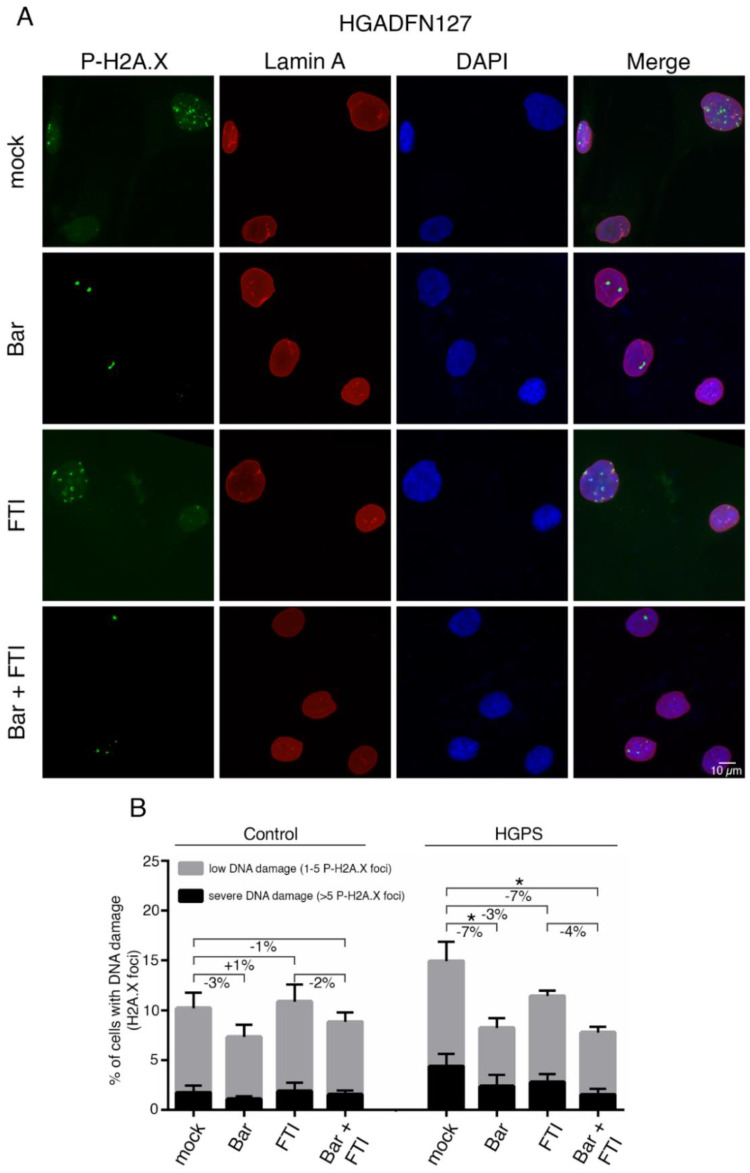
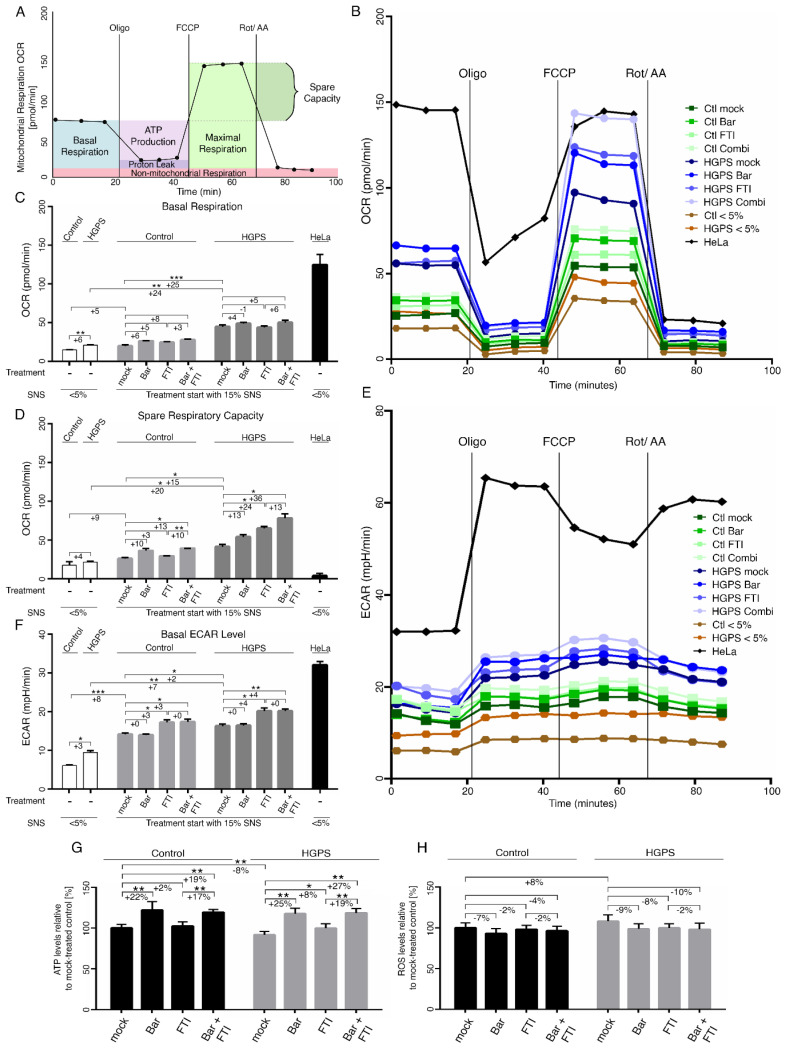
Hutchinson-Gilford progeria syndrome (HGPS) is an ultra-rare multisystem premature aging disorder that leads to early death (mean age of 14.7 years) due to myocardial infarction or stroke. Most cases have a de novo point mutation at position G608G within exon 11 of the LMNA gene. This mutation leads to the production of a permanently farnesylated truncated prelamin A protein called "progerin" that is toxic to the cells. Recently, farnesyltransferase inhibitor (FTI) lonafarnib has been approved by the FDA for the treatment of patients with HGPS. While lonafarnib treatment irrefutably ameliorates HGPS disease, it is however not a cure. FTI has been shown to cause several cellular side effects, including genomic instability as well as binucleated and donut-shaped nuclei. We report that, in addition to these cellular stresses, FTI caused an increased frequency of cytosolic DNA fragment formation. These extranuclear DNA fragments colocalized with cGAs and activated the cGAS-STING-STAT1 signaling axis, upregulating the expression of proinflammatory cytokines in FTI-treated human HGPS fibroblasts. Treatment with lonafarnib and baricitinib, a JAK-STAT inhibitor, not only prevented the activation of the cGAS STING-STAT1 pathway, but also improved the overall HGPS cellular homeostasis. These ameliorations included progerin levels, nuclear shape, proteostasis, cellular ATP, proliferation, and the reduction of cellular inflammation and senescence. Thus, we suggest that combining lonafarnib with baricitinib might provide an opportunity to reduce FTI cellular toxicity and ameliorate HGPS symptoms further than lonafarnib alone.

Keywords: JAK-STAT; age-related disease; baricitinib; farnesyltransferase inhibitor; inflammation; lamin; progeria; progerin; replicative senescence.


Conflict of interest statement

The authors declare no conflict of interest. The funders had no role in the design of the study; in the collection, analyses, or interpretation of data; in the writing of the manuscript, or in the decision to publish the results.

Figures

Figure 1
Figure 1
Replicative senescence of control and HGPS fibroblasts after treatment with baricitinib and FTI. (A) Cell numbers relative to mock-treated control cells. All cultures were started with ~15% senescence. Cells were either treated with vehicle (DMSO), Bar (1 µM), FTI (0.025 µM), or combined drugs for a period of nine days. (B) Graph shows the percentage of SA-ß-gal-positive cells measured after indicated treatments. (C) Percentage of cells positive for p21 after indicated treatment. (D) Representative images of SA-ß-gal-positive cells in treated cultures. Scale bar: 50 µm. (E) Representative immunofluorescence images of control GM01651C and HGPS HGADFN127 fibroblasts after the indicated treatment. Antibodies against p21 (red) and lamin A/C (green) were used, and DNA was stained with DAPI. Fluorescence images were taken at 40× magnification. Scale bar: 20 µm. (F,I) Representative images of western blots for STAT1, P-STAT1, STAT3 and P-STAT3. Quantification of P-STAT1 (G), STAT1 (H), P-STAT3 (J), and STAT3 (K). Graphs show mean ± SD. Representative images are shown (n = 3; * p < 0.05, ** p < 0.01).
Figure 2
Figure 2
FTI treatment activates the cGAS-STING pathway. (A) Determination of the frequency of donut-shaped nuclei with indicated treatment and senescence (SNS). Cells were either treated with vehicle (DMSO), Bar (1 µM), FTI (0.025 µM), or combined drugs for a period of nine days. (B) Determination of the frequency of micronuclei at indicated treatment and senescence after a period of nine days. (C) Representative immunofluorescence images of an HGPS (HGADFN127) fibroblast cell strain treated for nine days as indicated. Antibodies against lamin A (green) and cGAS (red) were used, counterstained with DAPI. Fluorescence images were taken at a 60× magnification. Scale bar: 10 µm. (D) Percentage of cells positive for cGAS after indicated treatment. (E) Quantitative real-time PCR analysis of IFN-β in cells treated as indicated. Relative expression was normalized to expression of GAPDH. Graphs show mean ± SD. Representative images are shown (n = 3; * p < 0.05, ** p < 0.01, *** p < 0.001).
Figure 3
Figure 3
SASP factors are blunted by treatment with Bar and FTI. (AD) Quantitative real-time PCR analysis of IL-1α, CCL2, IL-6, and CXCL8. Cultures at 15%SNS were either treated with vehicle (DMSO), Bar (1 µM), FTI (0.025 µM), or combined drugs for a period of nine days. Relative expression was normalized to expression of GAPDH. Graphs show mean ± SD (n = 3; * p < 0.05, ** p < 0.01).
Figure 4
Figure 4
Bar, FTI and combination treatment prevent nuclear blebbing and progerin nuclear accumulation. (A,C) Representative images of western blots for lamin A/C and prelamin A. Cultures at 15% SNS were either treated with vehicle (DMSO), Bar (1 µM), FTI (0.025 µM), or combined drugs for a period of nine days. Quantification of progerin (B) and prelamin A (D). (E) Autophagy activity was determined by measuring MDC levels using fluorescence photometry. (F) Proteasome activity was determined by measuring chymotrypsin-like proteasome activity using Suc-LLVY-AMC as a substrate. (G) Representative immunofluorescence images of HGPS (HGADFN127) fibroblasts treated for nine days as indicated. Antibodies against prelamin A (green) and progerin (red) were used, and DNA was stained with DAPI. Fluorescence images were taken at 40× magnification. Scale bar: 20 µm. (H,I) The same staining as in (G) and Figure S1a was used to determine the frequency of misshapen nuclei (dysmorphic) and the number of nuclei with bright progerin signals. An average of at least 900 nuclei were counted. Graphs show mean ± SD. Representative images are shown (n = 3; * p < 0.05, ** p < 0.01).
Figure 5
Figure 5
Bar and FTI combination treatment reduce P-H2A.X levels in HGPS cells. (A) Representative immunofluorescence images of HGPS HGADFN127 fibroblasts treated for nine days as indicated. Antibodies against P-H2A.X (green) and lamin A (red) were used, and DNA was stained with DAPI. Fluorescence images were taken at 60× magnification. Scale bar: 10 µm. (B) Number of nuclei with low DNA damage (1–5 P-H2A.X foci) and severe DNA damage (>5 P-H2A.X foci) in control and HGPS cultures treated as indicated. Graphs show mean ± SD. (n = 3; * p < 0.05).
Figure 6
Figure 6
Mitochondrial function and glycolysis are impaired in HGPS fibroblasts. (A) Schematic representation of Seahorse XF Cell Mito stress test and calculated values are indicated. Oxygen consumption rates (OCR) (B) and extracellular acidification (ECAR) (E) were determined with a Seahorse XF96 Flux analyzer in basal and stimulated conditions (n = 3). Additional parameters like basal respiration (C), spare respiratory capacity (D), and basal ECAR levels (F) were calculated with Wave software v2.6.1.53 (Agilent Technologies, Santa Clara, CA, USA). (G) Cellular ATP levels were measured using a CellTiter-Glo luminescence ATP assay. (H) Intracellular ROS levels were determined by measuring oxidized dichlorofluorescein (DCF) levels using a DCFDA cellular ROS detection assay (n = 3). Graphs show mean ± SD. (* p < 0.05, ** p < 0.01, *** p < 0.001).

References

    1. Gordon L.B. PRF by the Numbers. The Progeria Research Foundation. [(accessed on 7 July 2021)]; Available online: https://www.progeriaresearch.org/prf-by-the-numbers/
    1. Gordon L.B., Rothman F.G., López-Otín C., Misteli T. Progeria: A paradigm for translational medicine. Cell. 2014;156:400–407. doi: 10.1016/j.cell.2013.12.028. - DOI - PMC - PubMed
    1. Merideth M.A., Gordon L.B., Clauss S., Sachdev V., Smith A.C.M., Perry M.B., Brewer C.C., Zalewski C., Kim H.J., Solomon B., et al. Phenotype and Course of Hutchinson–Gilford Progeria Syndrome. N. Engl. J. Med. 2008;358:592–604. doi: 10.1056/NEJMoa0706898. - DOI - PMC - PubMed
    1. Harhouri K., Frankel D., Bartoli C., Roll P., de Sandre-Giovannoli A., Lévy N. An overview of treatment strategies for Hutchinson-Gilford Progeria syndrome. Nucleus. 2018;9:246–257. doi: 10.1080/19491034.2018.1460045. - DOI - PMC - PubMed
    1. Eriksson M., Brown W.T., Gordon L.B., Glynn M.W., Singer J., Scott L., Erdos M.R., Robbins C.M., Moses T.Y., Berglund P., et al. Recurrent de novo point mutations in lamin A cause Hutchinson-Gilford progeria syndrome. Nature. 2003;423:293–298. doi: 10.1038/nature01629. - DOI - PMC - PubMed

MeSH terms