. 2021 Jul 13;22(14):7498.
doi: 10.3390/ijms22147498.

Extension of Collagen Deposition in COVID-19 Post Mortem Lung Samples and Computed Tomography Analysis Findings

Affiliations

Extension of Collagen Deposition in COVID-19 Post Mortem Lung Samples and Computed Tomography Analysis Findings

Lorenzo Ball et al. Int J Mol Sci. .

Abstract

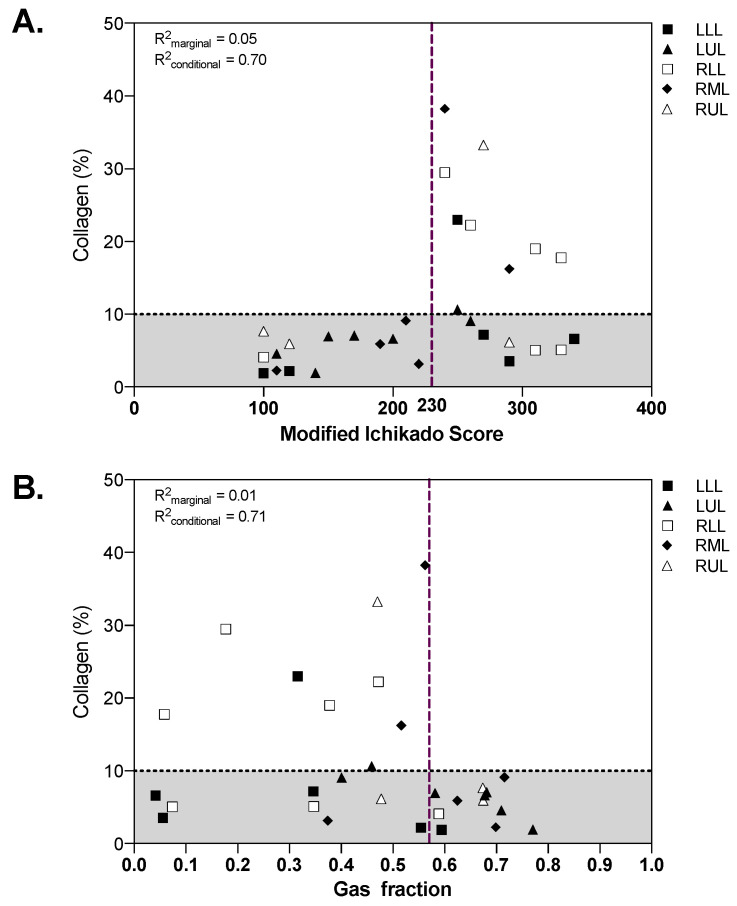
Lung fibrosis has specific computed tomography (CT) findings and represents a common finding in advanced COVID-19 pneumonia whose reversibility has been poorly investigated. The aim of this study was to quantify the extension of collagen deposition and aeration in postmortem cryobiopsies of critically ill COVID-19 patients and to describe the correlations with qualitative and quantitative analyses of lung CT. Postmortem transbronchial cryobiopsy samples were obtained, formalin fixed, paraffin embedded and stained with Sirius red to quantify collagen deposition, defining fibrotic samples as those with collagen deposition above 10%. Lung CT images were analyzed qualitatively with a radiographic score and quantitatively with computer-based analysis at the lobe level. Thirty samples from 10 patients with COVID-19 pneumonia deceased during invasive mechanical ventilation were included in this study. The median [interquartile range] percent collagen extension was 6.8% (4.6-16.2%). In fibrotic compared to nonfibrotic samples, the qualitative score was higher (260 (250-290) vs. 190 (120-270), p = 0.036) while the gas fraction was lower (0.46 (0.32-0.47) vs. 0.59 (0.37-0.68), p = 0.047). A radiographic score above 230 had 100% sensitivity (95% confidence interval, CI: 66.4% to 100%) and 66.7% specificity (95% CI: 41.0% to 92.3%) to detect fibrotic samples, while a gas fraction below 0.57 had 100% sensitivity (95% CI: 66.4% to 100%) and 57.1% specificity (95% CI: 26.3% to 88.0%). In COVID-19 pneumonia, qualitative and quantitative analyses of lung CT images have high sensitivity but moderate to low specificity to detect histopathological fibrosis. Pseudofibrotic CT findings do not always correspond to increased collagen deposition.

Keywords: COVID-19; collagen; computed tomography; fibrosis.


Conflict of interest statement

The authors declare no conflict of interest.

Figures

Figure 1
Figure 1
Histopathological samples stained with Sirius red in two representative patients. (A) illustrates a patient with early disease, normal percent collagen amount and normal alveolar airspaces. (B) illustrates a patient with advanced disease, parenchymal disruption, pathological collagen deposition and extensive loss of aeration.
Figure 2
Figure 2
Quantification of collagen (A) and airspaces (B) in Sirius red-stained samples. Violin plots represent distributions, squares represent individual patient data, thick lines medians, thin dotted lines quartiles. The dotted horizontal line in (panel (A)) represents the threshold defining fibrotic samples (collagen > 10%).
Figure 3
Figure 3
Qualitative CT analysis results in the whole lungs (total) and in each lobe. Violin plots in (A) represent distributions, squares represent individual patient data, thick lines medians, thin dotted lines quartiles. The heatmap in (B) reports the mean estimated percent extension of each CT finding. CT: computed tomography; LLL: left lower lobe; LUL: left upper lobe; RLL: right lower lobe; RML: right middle lobe; RUL: right upper lobe.
Figure 4
Figure 4
Quantitative CT analysis results in the whole lungs (total) and in each lobe. Violin plots in (A) represent distributions, squares represent individual patient data, thick lines medians, thin dotted lines quartiles. The heatmap in (B) reports the mean extension of each quantitative CT aeration compartment expressed as percent of the total lobe tissue. CT: computed tomography; LLL: left lower lobe; LUL: left upper lobe; RLL: right lower lobe; RML: right middle lobe; RUL: right upper lobe.
Figure 5
Figure 5
Qualitative (A) and quantitative (B) CT analysis as function of collagen percent extension. The dotted horizontal line in panel A represents the threshold defining fibrotic samples (collagen > 10%), vertical dashed lines represent the cut-off identified in the receiver operating characteristics analysis. The marginal R2 describes the proportion of variance explained by the CT parameter alone, the conditional R2 the proportion of variance explained by both the CT parameter and the random effect (patient). CT: computed tomography; LLL: left lower lobe; LUL: left upper lobe; RLL: right lower lobe; RML: right middle lobe; RUL: right upper lobe.

References

    1. Zhu N., Zhang D., Wang W., Li X., Yang B., Song J., Zhao X., Huang B., Shi W., Lu R., et al. A Novel Coronavirus from Patients with Pneumonia in China, 2019. N. Engl. J. Med. 2020;382:727–733. doi: 10.1056/NEJMoa2001017. - DOI - PMC - PubMed
    1. Huang C., Wang Y., Li X., Ren L., Zhao J., Hu Y., Zhang L., Fan G., Xu J., Gu X., et al. Clinical Features of Patients Infected with 2019 Novel Coronavirus in Wuhan, China. Lancet Lond. Engl. 2020;395:497–506. doi: 10.1016/S0140-6736(20)30183-5. - DOI - PMC - PubMed
    1. ARDS Definition Task Force. Ranieri V.M., Rubenfeld G.D., Thompson B.T., Ferguson N.D., Caldwell E., Fan E., Camporota L., Slutsky A.S. Acute Respiratory Distress Syndrome: The Berlin Definition. JAMA. 2012;307:2526–2533. doi: 10.1001/jama.2012.5669. - DOI - PubMed
    1. Chiumello D., Busana M., Coppola S., Romitti F., Formenti P., Bonifazi M., Pozzi T., Palumbo M.M., Cressoni M., Herrmann P., et al. Physiological and Quantitative CT-Scan Characterization of COVID-19 and Typical ARDS: A Matched Cohort Study. Intensive Care Med. 2020 doi: 10.1007/s00134-020-06281-2. - DOI - PMC - PubMed
    1. Robba C., Battaglini D., Ball L., Patroniti N., Loconte M., Brunetti I., Vena A., Giacobbe D.R., Bassetti M., Rocco P.R.M., et al. Distinct Phenotypes Require Distinct Respiratory Management Strategies in Severe COVID-19. Respir. Physiol. Neurobiol. 2020;279:103455. doi: 10.1016/j.resp.2020.103455. - DOI - PMC - PubMed