. 2021 Jul 15;22(14):7590.
doi: 10.3390/ijms22147590.

CFTR Lifecycle Map-A Systems Medicine Model of CFTR Maturation to Predict Possible Active Compound Combinations

Affiliations

CFTR Lifecycle Map-A Systems Medicine Model of CFTR Maturation to Predict Possible Active Compound Combinations

Liza Vinhoven et al. Int J Mol Sci. .

Abstract

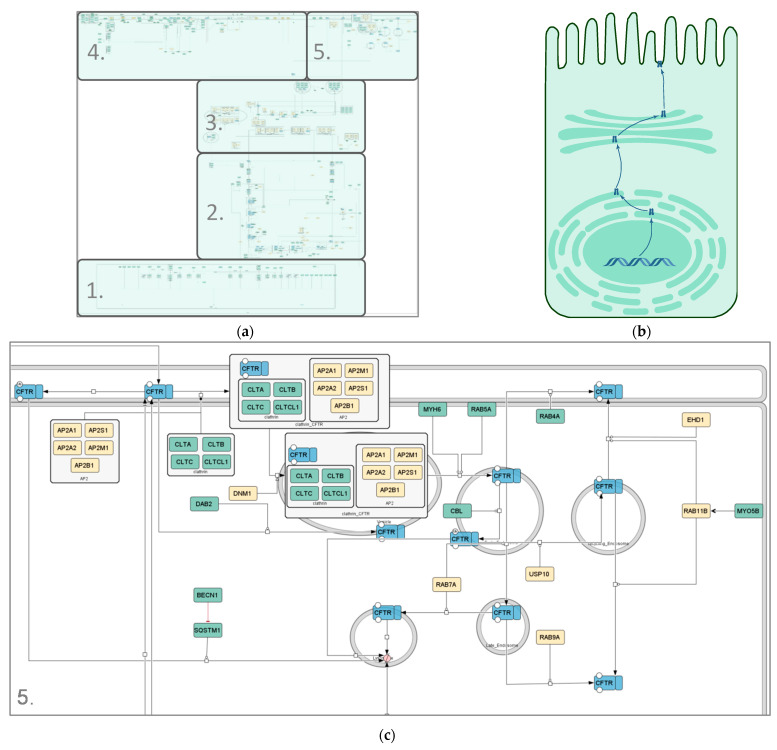
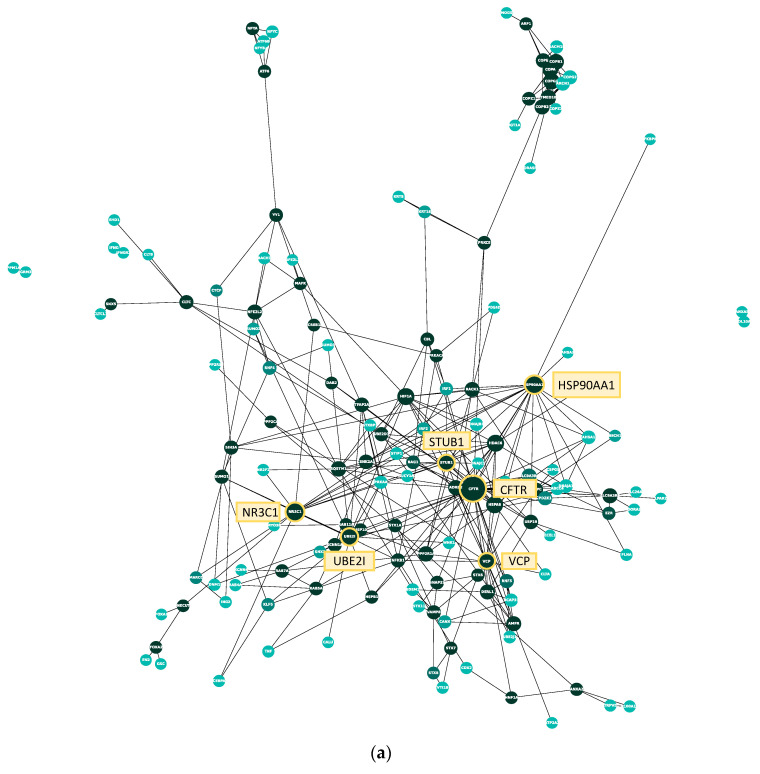
Different causative therapeutics for CF patients have been developed. There are still no mutation-specific therapeutics for some patients, especially those with rare CFTR mutations. For this purpose, high-throughput screens have been performed which result in various candidate compounds, with mostly unclear modes of action. In order to elucidate the mechanism of action for promising candidate substances and to be able to predict possible synergistic effects of substance combinations, we used a systems biology approach to create a model of the CFTR maturation pathway in cells in a standardized, human- and machine-readable format. It is composed of a core map, manually curated from small-scale experiments in human cells, and a coarse map including interactors identified in large-scale efforts. The manually curated core map includes 170 different molecular entities and 156 reactions from 221 publications. The coarse map encompasses 1384 unique proteins from four publications. The overlap between the two data sources amounts to 46 proteins. The CFTR Lifecycle Map can be used to support the identification of potential targets inside the cell and elucidate the mode of action for candidate substances. It thereby provides a backbone to structure available data as well as a tool to develop hypotheses regarding novel therapeutics.

Keywords: CFTR; CFTR maturation; CFTR modulators; cystic fibrosis; systems medicine model; trafficking.


Conflict of interest statement

The authors declare no conflict of interest.

Figures

Figure 1
Figure 1
Venn diagram of the interactors in the manually curated core map vs. coarse map. The manually curated list of interactors within the core map comprises 170 interactors, the coarse map derived from high-throughput data contains 1384 interactors, and 46 interactors occur in both lists. The overlap was subtracted from the high-throughput interactome for the visualization to avoid redundancies, resulting in 1338 interactors in the coarse map.
Figure 2
Figure 2
Different representations of the CFTR lifecycle. (a) Image of the SBGN-compliant manually curated CFTR lifecycle core map; (b) cartoon representation of the CFTR lifecycle in an apical epithelial cell; (c) zoomed-in section of the endocytosis pathway in the manually curated CFTR lifecycle core map (submap 5). Compartments are depicted in grey, CFTR in blue and interactors in differing shades of green and yellow. The green color scheme represents interactors identified in at least one polarized cell line; yellow interactors were identified in non-polarized cell lines only. State transitions, catalysis and positive influences are shown in black; negative influences and inhibitions are displayed in red. Different shapes represent different kinds of interactors. Rounded rectangles correspond to proteins, ovals and circles to small molecules and ions, respectively, rectangles correspond to genes, rhomboids to RNA molecules and chevron shapes to receptors. The map was created using CellDesigner4.4.2.
Figure 3
Figure 3
Protein–protein interaction network and degree distribution of the manual CFTR map. (a) Each node represents one protein, each edge between them a physical interaction shown in a small-scale study and reported on BioGrid. The larger a node, the higher its degree (i.e., the more interactions it shares with other proteins). CFTR and the five proteins with the next-highest degree are marked in yellow. The color of the protein represents its betweenness centrality, which is a measure of how important the node is to the flow of information through the CFTR Lifecycle Map. The betweenness centrality of a protein is the number of times it lies on the shortest path between two other proteins. The darker the node, the higher its betweenness centrality; (b) bar plot of the degree distribution of the protein–protein interaction network in A. The x-axis shows the degree of a protein; the degree is the number of other proteins a protein interacts with. The y-axis shows the number of proteins in the network with a certain degree. For example, the number of proteins that interact with only one other protein in the network (i.e., have a degree of 1) is 30, the number of proteins that interact with six other proteins is ten. The node with the highest degree (38) is CFTR.
Figure 3
Figure 3
Protein–protein interaction network and degree distribution of the manual CFTR map. (a) Each node represents one protein, each edge between them a physical interaction shown in a small-scale study and reported on BioGrid. The larger a node, the higher its degree (i.e., the more interactions it shares with other proteins). CFTR and the five proteins with the next-highest degree are marked in yellow. The color of the protein represents its betweenness centrality, which is a measure of how important the node is to the flow of information through the CFTR Lifecycle Map. The betweenness centrality of a protein is the number of times it lies on the shortest path between two other proteins. The darker the node, the higher its betweenness centrality; (b) bar plot of the degree distribution of the protein–protein interaction network in A. The x-axis shows the degree of a protein; the degree is the number of other proteins a protein interacts with. The y-axis shows the number of proteins in the network with a certain degree. For example, the number of proteins that interact with only one other protein in the network (i.e., have a degree of 1) is 30, the number of proteins that interact with six other proteins is ten. The node with the highest degree (38) is CFTR.
Figure 4
Figure 4
Image of the high-throughput CFTR Endocytosis, Recycling and Degradation map. (a) Whole map; (b) zoomed-in section of the map. Compartments are depicted in grey, CFTR in blue and interactors in shades of red (degradation associated) and yellow (recycling associated). State transitions and modulations are shown in black. Different shapes represent different kinds of interactors. Rounded rectangles correspond to proteins, rectangles correspond to genes and rhomboids to RNA molecules. The map was created using libsbgnpy 0.2.2 and CellDesigner4.4.2.
Figure 5
Figure 5
Top 20 prioritized Gene Ontology processes from BioInfoMiner analysis of the CFTR Lifecycle Map. (a) Bar plot of the processes prioritized among the top 20 in both the core map and the coarse map datasets and percentage of genes from the respective map associated with the processes; (b) bar plot of the processes prioritized among the top 20 in only the manually curated gene list of the core map and percentage of genes from the core map associated with the processes; (c) bar plot of the processes prioritized among the top 20 in only the high-throughput interactome of the coarse map and percentage of genes from the coarse map associated with the processes.

References

    1. Bobadilla J.L., Macek M., Fine J.P., Farrell P.M. Cystic fibrosis: A worldwide analysis of CFTR mutations—Correlation with incidence data and application to screening. Hum. Mutat. 2002;19:575–606. doi: 10.1002/humu.10041. - DOI - PubMed
    1. O’Sullivan B.P., Freedman S.D. Cystic fibrosis. Lancet. 2009;373:1891–1904. doi: 10.1016/S0140-6736(09)60327-5. - DOI - PubMed
    1. Elborn J.S. Cystic fibrosis. Lancet. 2016;388:2519–2531. doi: 10.1016/S0140-6736(16)00576-6. - DOI - PubMed
    1. Riordan J.R., Rommens J.M., Kerem B.S., Alon N.O.A., Rozmahel R., Grzelczak Z., Zielenski J., Lok S.I., Plavsic N., Chou J.L., et al. Identification of the cystic fibrosis gene: Cloning and characterization of complementary DNA. Science. 1989;245:1066–1073. doi: 10.1126/science.2475911. - DOI - PubMed
    1. O’Riordan C.R., Lachapelle A.L., Marshall J., Higgins E.A., Cheng S.H. Characterization of the oligosaccharide structures associated with the cystic fibrosis transmembrane conductance regulator. Glycobiology. 2000;10:1225–1233. doi: 10.1093/glycob/10.11.1225. - DOI - PubMed

MeSH terms