. 2021 Jul 19;22(14):7718.
doi: 10.3390/ijms22147718.

Metabolic Pathways Involved in Formation of Spontaneous and Lipopolysaccharide-Induced Neutrophil Extracellular Traps (NETs) Differ in Obesity and Systemic Inflammation

Affiliations

Metabolic Pathways Involved in Formation of Spontaneous and Lipopolysaccharide-Induced Neutrophil Extracellular Traps (NETs) Differ in Obesity and Systemic Inflammation

Iwona Cichon et al. Int J Mol Sci. .

Abstract

Obesity manifests itself with low-grade chronic inflammation that shapes immune responses during infection. Albeit obese individuals are at risk of higher mortality due to comorbidities, they are better protected from systemic inflammation. Recently, we showed that in the vasculature of obese mice kept on high-fat diet (HFD), neutrophils produce less neutrophil extracellular traps (NETs) than in lean controls (normal diet, ND). NETs are used by neutrophils to counteract severe infection, but they also cause collateral damage. Hardly anything is known about metabolic requirements for their formation, especially in the context of obesity and/or sepsis. Thus, we aimed to study the immunometabolism of NET formation by application of ex vivo neutrophil analyses (Seahorse analyzer, selective inhibitors, confocal imaging) and intravital microscopy. The obtained data show that glycolysis and/or pentose phosphate pathway are involved in NETs release by ND neutrophils in both physiological and inflammatory conditions. In contrast, such cells of septic HFD mice utilize these routes only to spontaneously cast NETs, while after secondary ex vivo activation they exhibit so called "exhausted phenotype", which manifests itself in diminished NET release despite high glycolytic potential and flexibility to oxidize fatty acids. Moreover, impact of ATP synthase inhibition on NET formation is revealed. Overall, the study shows that the neutrophil potential to cast NETs depends on both the metabolic and inflammatory state of the individual.

Keywords: ATP synthase; GLUT1; PPP pathway; fatty acids; glycolysis; immunometabolism; neutrophil extracellular traps; neutrophils; obesity; systemic inflammation.


Conflict of interest statement

The authors declare no conflict of interest.

Figures
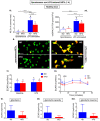
Figure 1
Figure 1
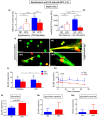
Short-term formation of neutrophil extracellular traps (NETs), and metabolic parameters of neutrophils isolated from healthy mice with obesity induced by high fat diet (HFD) and from their lean controls (ND). Animals were not treated in any way, thus they are described as healthy. NET formation and metabolic parameters were measured within one hour since cell seeding or ex vivo activation with lipopolysaccharide (LPS). NETs were quantified upon staining of neutrophil elastase (NE, ImageJ software) (Ai), and (Aii) extracellular DNA (extDNA) with SYTOX green; fluorescent signal was quantified using a microplate reader (relative fluorescence units, RFU); (B) representative images of NETs are presented for spontaneous NETs of ND and HFD mice and for NETs induced with lipopolysaccharide (LPS). NETs were detected by immunocytochemical counterstaining of neutrophil elastase (NE, red) along with extracellular DNA (extDNA, green). Scale bars indicate: 25 μm. Metabolic parameters were measured with Seahorse analyzer (C,D). Data quantification of Extracellular Acidification Rate (ECAR) (Ci) and a representative Seahorse readout (Cii) are presented. (D) Glycolysis Stress Test was used to establish glycolysis rate (Di), glycolysis capacity (Dii), and glycolytic reserve (Diii). Asterisks indicate significant differences between groups according to unpaired two-tailed Student’s t-test (* p ≤ 0.05, **** p ≤ 0.0001). Results of one-way ANOVA (post hoc Bonferroni): any two means that do not share same letter are significantly different. Data are shown as mean ± s.d.; n ≥ 3 per group/repetition.
Figure 2
Figure 2
Short-term formation of neutrophil extracellular traps (NETs), and metabolic parameters of neutrophils isolated from septic mice with obesity induced by high fat diet (HFD) and their lean controls (ND). Systemic inflammation/endotoxemia was induced 24 h prior to neutrophil isolation by injecting animals with 1 mg/kg body weight of lipopolysaccharide (LPS). NET formation and metabolic parameters were measured within one hour since cell seeding or ex vivo activation with LPS. NETs were quantified upon staining of neutrophil elastase (NE, ImageJ software) (Ai), and (Aii) extracellular DNA (extDNA) with SYTOX green; fluorescent signal was quantified using a microplate reader (relative fluorescence units, RFU); (B) representative images of NETs are presented for spontaneous NETs of ND and HFD mice and for NETs induced with lipopolysaccharide (LPS). NETs were detected by immunocytochemical counterstaining of neutrophil elastase (NE, red) along with extracellular DNA (extDNA, green). Scale bars indicate: 25 μm. Metabolic parameters were measured with a Seahorse analyzer (C,D). Data quantification of Extracellular Acidification Rate (ECAR) (Ci) and a representative Seahorse readout (Cii) are presented. (D) Glycolysis Stress Test was used to establish glycolysis rate (Di), glycolysis capacity (Dii), and glycolytic reserve (Diii). Asterisks indicate significant differences between groups according to unpaired two-tailed Student’s t-test (* p ≤ 0.05, ** p ≤ 0.01, *** p ≤ 0.001, **** p ≤ 0.0001). Results of one-way ANOVA (post hoc Bonferroni): any two means that do not share same letter are significantly different. Data are shown as mean ± s.d.; n ≥ 3 per group/repetition.
Figure 3
Figure 3
Comparison of mitochondria counts and metabolic activity between neutrophils isolated from obese mice due to high fat diet (HFD) and their lean controls (ND) in a healthy state and with ongoing sepsis. Neutrophils were collected from ND and HFD mice that were either healthy (not treated in any way) or with an ongoing systemic inflammation/endotoxemia induced 24 h prior to neutrophil isolation by injecting animals with 1 mg/kg body weight of lipopolysaccharide (LPS). Metabolic parameters were measured within one hour since cell seeding or ex vivo activation with LPS. Mitochondria were visualized upon staining (MitoTracker green-positive organelles) of neutrophils. Scale bars indicate 20 μm. Representative images for healthy mice are shown (A), and data quantification for both healthy and septic mice is shown in (B) (RFU, relative fluorescence units). Metabolic parameters were measured with a Seahorse analyzer (C,D). Data quantification of Oxygen Consumption Rate (OCR) (Ci,Di) and representative Seahorse readouts (Cii,Dii) are presented where C corresponds to neutrophils isolated from healthy mice, and D to their origin from septic mice, respectively. Asterisk indicates significant differences between groups according to unpaired two-tailed Student’s t-test (* p ≤ 0.05). Results of one-way ANOVA (post hoc Bonferroni): means that share same letter are not significantly different. Data are shown as mean ± s.d.; n ≥ 3 per group/repetition.
Figure 4
Figure 4
Comparison of fatty acid (FA) oxidation between neutrophils isolated from obese mice due to high fat diet (HFD) and their lean controls (ND). Neutrophils were collected from healthy mice. Oxygen Consumption Rate (OCR) was measured with a Seahorse analyzer applying Mito Fuel Flex Test within two hours since cell activation with lipopolysaccharide (LPS). Two parameters were directly evaluated: neutrophil dependency on FA oxidation (A,B), cell capacity to oxidize FA (A,C). Fuel flexibility of the cells was recalculated as difference between their capacity and dependency. Data quantification is shown in (A), and representative Seahorse readouts in (B,C), where (B) presents measurement steps and readouts for dependency, and (C) for capacity. Asterisks indicate significant differences between groups according to unpaired two-tailed Student’s t-test (* p ≤ 0.05, ** p ≤ 0.01). Results of one-way ANOVA (post hoc Bonferroni): any two means that do not share same letter are significantly different. Data are shown as mean ± s.d.; n ≥ 3 per group/repetition.
Figure 5
Figure 5
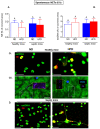
Long-term spontaneous formation of neutrophil extracellular traps (NETs) by neutrophils of mice with obesity induced by high fat diet (HFD) and their lean controls (ND) either ex vivo or in vivo. Studies were performed on either healthy mice (not treated in any way; healthy mice) or with ongoing systemic inflammation/endotoxemia induced 24 h prior to analyses by injecting animals with 1 mg/kg body weight of lipopolysaccharide (LPS; septic mice). Ex vivo NET formation was evaluated 6 h after cell seeding without any further stimulation (AC). NET quantification: area [%] covered by neutrophil elastase (NE) (A) and extracellular DNA (extDNA) (B) Representative images from ex vivo studies: immunocytochemical counterstaining of neutrophil elastase (NE, red) along with extracellular DNA staining (extDNA, green). Scale bar indicates 25 μm (Ci,D). Additionally, in vivo NET formation in liver vasculature was estimated in healthy untreated mice (Cii). On images neutrophil elastase (NE, violet) is visible lining along sinusoids (black ducts) which are localized in between autofluorescent hepatocytes (dim green). White dashed line denotes regions rich in neutrophil elastase. Areas are additionally shown in Cy5 channel (NE signal) only (yellow dashed line). Neutrophils are denoted in blue. Scale bar indicates 25 μm (Cii). Results of one-way ANOVA (post hoc Bonferroni): means that share same letter are not significantly different. Unpaired two-tailed Student’s t-test did not reveal any differences between groups.
Figure 6
Figure 6
GLUT1-dependent long-term spontaneous formation of neutrophil extracellular traps (NETs) by neutrophils of mice with obesity induced by high fat diet (HFD) and their lean controls (ND). Neutrophils were collected from healthy mice, pretreated with glucose transporter protein 1 (GLUT1) inhibitor, and NET formation was estimated after 6 h. Additionally, some neutrophils were cultured in HBSS supplemented with high glucose (22 mM, HG) or normal glucose (5.5 mM, NG). NETs were quantified upon staining of neutrophil elastase (NE, ImageJ software) (Ai), and (Aii) extracellular DNA (extDNA) with SYTOX green; fluorescent signal was quantified using a microplate reader (relative fluorescence units, RFU). (B) Expression of GLUT1 (red) was estimated in resting neutrophils by immunocytochemistry and is expressed as a percentage of GLUT1-positive cells per field of view (FOV; (C)). In (Bi), yellow dashed line denotes exemplary cells enlarged by 250% (original location of the cells is marked with a white dashed line). In (Bii), only GLUT1-positive signal is shown (red). Scale bar indicates 25 μm ((B)—representative images, (C)—data quantification). Asterisks indicate significant differences between groups upon unpaired two-tailed Student’s t-test (* p ≤ 0.05, ** p ≤ 0.01). Results of one-way ANOVA (post hoc Bonferroni): any two means that do not share same letter are significantly different. Data are shown as mean ± s.d.; n ≥ 3 per group.
Figure 7
Figure 7
Long-term LPS-induced formation of neutrophil extracellular traps (NETs) by neutrophils of mice with obesity induced by high fat diet (HFD) and their lean controls (ND) either ex vivo or in vivo. Studies were performed on either healthy mice (not treated in any way; healthy mice) or with ongoing systemic inflammation/endotoxemia induced 24 h prior to analyses by injecting animals with 1 mg/kg body weight of lipopolysaccharide (LPS; septic mice). Ex vivo NET formation was evaluated 6 h after cell activation with lipopolysaccharide (LPS; (Ai,Aii)). NET quantification: area [%] covered by neutrophil elastase (NE) (A) and extracellular DNA (extDNA) (B) Representative images from ex vivo studies: immunocytochemical counterstaining of neutrophil elastase (NE, red) along with extracellular DNA staining (extDNA, green). Scale bar indicates 25 μm (Aiii). Additionally, in vivo NET formation in liver vasculature was estimated at 6 h of endotoxemia (B). On images neutrophil elastase (NE, violet) is visible lining along sinusoids (black ducts) which are localized in between autofluorescent hepatocytes (dim green). White dashed line denotes regions rich in neutrophil elastase (violet) and histone H2A.X (red). Areas are additionally shown in Cy5 channel (NE signal) only (yellow dashed line). Neutrophils are denoted in blue. Scale bar indicates 25 μm (B). (C) In some ex vivo experiments, neutrophils were pretreated prior to LPS stimulation with 2-deoxy-D-glucose (2-DG; Ci for ND neutrophils, Cii for HFD cells). Additionally, some neutrophils were cultured in HBSS supplemented with high glucose (22 mM, HG) or normal glucose (5.5 mM, NG), or mannitol as osmolarity control (Ci,Cii). Asterisks indicate significant differences between groups upon unpaired two-tailed Student’s t-test (* p ≤ 0.05, **** p ≤ 0.0001). Results of one-way ANOVA (post hoc Bonferroni): any two means that do not share same letter are significantly different. Data are shown as mean ± s.d.; n ≥ 3 per group.
Figure 8
Figure 8
GLUT1-dependent long-term LPS-induced formation of neutrophil extracellular traps (NETs) by neutrophils of mice with obesity induced by high fat diet (HFD) and their lean controls (ND). Neutrophils were collected from healthy mice, and prior to ex vivo studies in which they were stimulated with lipopolysaccharide (LPS) for 6 h, they were pretreated with glucose transporter protein 1 (GLUT1) inhibitor. Additionally, some neutrophils were cultured in HBSS supplemented with high glucose (22 mM, HG) or normal glucose (5.5 mM, NG). NETs were quantified upon staining of neutrophil elastase (NE, ImageJ software) (Ai), and (Aii) extracellular DNA (extDNA) with SYTOX green; fluorescent signal was quantified using a microplate reader (relative fluorescence units, RFU). (B) Expression of GLUT1 (red) was estimated in LPS-stimulated neutrophils by immunocytochemistry and is expressed as a percentage of GLUT1-positive cells per field of view (FOV; C). In (Bi), yellow dashed line denotes exemplary cells enlarged by 250% (original location of the cells is marked with a white dashed line). In (Bii), only GLUT1-positive signal is shown (red). Scale bar indicates 25 μm ((B)—representative images, (C)—data quantification). Asterisks indicate significant differences between groups upon unpaired two-tailed Student’s t-test (* p ≤ 0.05, ** p ≤ 0.01). Results of one-way ANOVA (post hoc Bonferroni): any two means that do not share same letter are significantly different. Data are shown as mean ± s.d.; n ≥ 3 per group.
Figure 9
Figure 9
Metabolic pathways involved in long-term LPS-induced formation of neutrophil extracellular traps (NETs) by neutrophils of mice with obesity induced by high fat diet (HFD) and their lean controls (ND). Neutrophils were collected from healthy mice, and prior to ex vivo studies in which they were stimulated with lipopolysaccharide (LPS) for 6 h, they were pretreated with numerous inhibitors. NETs were quantified upon staining of extracellular DNA with SYTOX green and fluorescent signal was measured using a microplate reader in ND (A) and HFD (B) neutrophil cultures. It is expressed as relative fluorescence units (RFU). Pentose phosphate pathway (PPP) was inhibited with 6-aminonicotinamide (6-AN) and dehydroepiandrosterone (DHEA) (blue columns); Krebs cycle was blocked with dimethyl malonate (DMM, an orange column); OXPHOS was inhibited with a range of inhibitors (rotenone, antimycin A, oligomycin, Bz-423, piceatannol; dark green columns). ATP synthase (mitochondrial and surface) was inhibited with angiostatin (a light green column). (C) Effects of oligomycin and angiostatin were recaptured in studies in which NETs were confirmed by immunocytochemical costaining of citrullinated histones H3 (citH3, red) along extracellular DNA (SYTOX green); representative images—(Ci), and quantification (area [%] covered by neutrophil elastase (NE, (Cii)) and extracellular DNA (extDNA, (Ciii))). Scale bar indicates 50 μm. Asterisks indicate significant differences between groups upon unpaired two-tailed Student’s t-test (* p ≤ 0.05, ** p ≤ 0.01, *** p ≤ 0.001, **** p ≤ 0.0001). Results of one-way ANOVA (post hoc Bonferroni): any two means that do not share same letter are significantly different. Data are shown as mean ± s.d.; n ≥ 3 per group.
Figure 10
Figure 10
Key metabolic pathways/fuels regulating neutrophil extracellular trap (NET) formation by neutrophils of healthy and septic mice with obesity induced by high fat diet (HFD) and their lean controls (ND). Dependency/independency (and tendency) for glucose- (violet), glycolysis- (green), fatty acids- (navy blue), pentose phosphate pathway- (PPP, blue), oxidative phosphorylation-involvement (OXPHOS, yellow) in NET formation were marked with arrows in the corresponding colors. Short-term spontaneous (light green panel) and lipopolisaccharide (LPS)-induced (1 h, pink panel) NETs release was studied as well as long-term (6 h, pink panel) LPS-induced NETs were compared differences between them are presented as balanced/unbalanced scales.

References

    1. Pillon N.J., Loos R.J.F., Marshall S.M., Zierath J.R. Metabolic consequences of obesity and type 2 diabetes: Balancing genes and environment for personalized care. Cell. 2021;184:1530–1544. doi: 10.1016/j.cell.2021.02.012. - DOI - PMC - PubMed
    1. Controlling the Global Obesity Epidemic. [(accessed on 4 May 2021)]; Available online: https://www.who.int/activities/controlling-the-global-obesity-epidemic.
    1. Prescott H.C., Chang V.W., O’Brien J.M., Jr., Langa K.M., Iwashyna T.J. Obesity and One-Year Outcomes in Older Americans with Severe Sepsis. Crit. Care Med. 2014;23:1–7. doi: 10.1097/CCM.0000000000000336. - DOI - PMC - PubMed
    1. Khan M., Patrick A.L., Fox-Robichaud A.E. Development of a murine model of early sepsis in diet-induced obesity. Biomed. Res. Int. 2014;2014:719853. doi: 10.1155/2014/719853. - DOI - PMC - PubMed
    1. Siegl D., Annecke T., Johnson B.L., Schlag C., Martignoni A., Huber N., Conzen P., Caldwell C.C., Tschöp J. Obesity-induced hyperleptinemia improves survival and immune response in a murine model of sepsis. Anesthesiology. 2014;121:98–114. doi: 10.1097/ALN.0000000000000192. - DOI - PubMed

MeSH terms

Substances

LinkOut - more resources