

Performance Evaluation of Particulate Matter and Indoor Microclimate Monitors in University Classrooms under COVID-19 Restrictions
- PMID: 34299813
- PMCID: PMC8305222
- DOI: 10.3390/ijerph18147363
Performance Evaluation of Particulate Matter and Indoor Microclimate Monitors in University Classrooms under COVID-19 Restrictions
Abstract
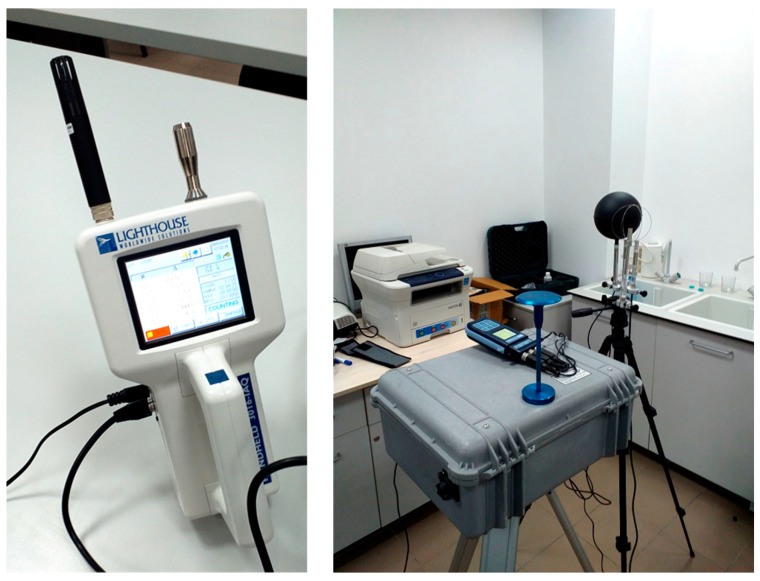
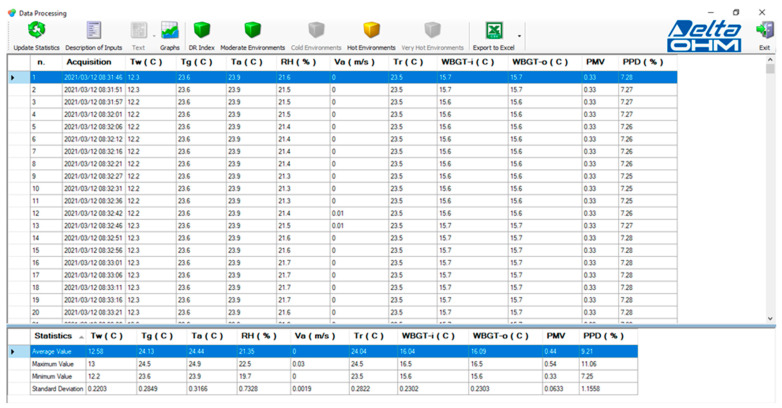
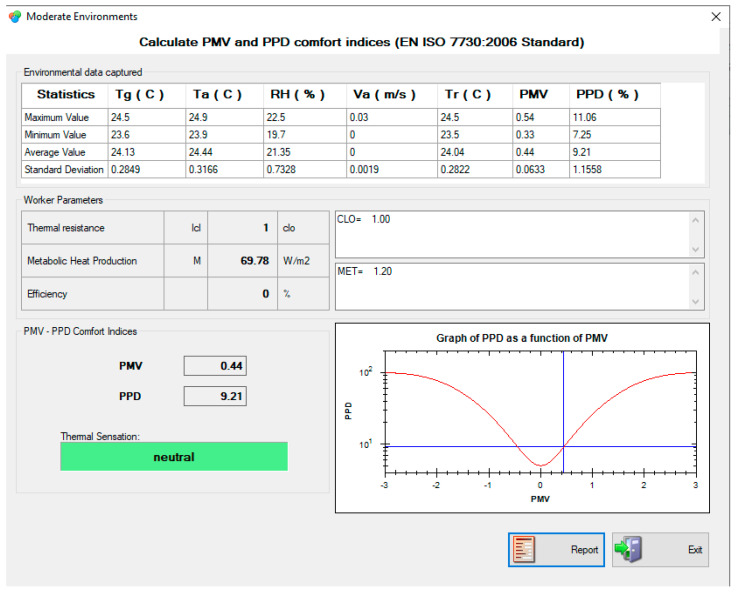
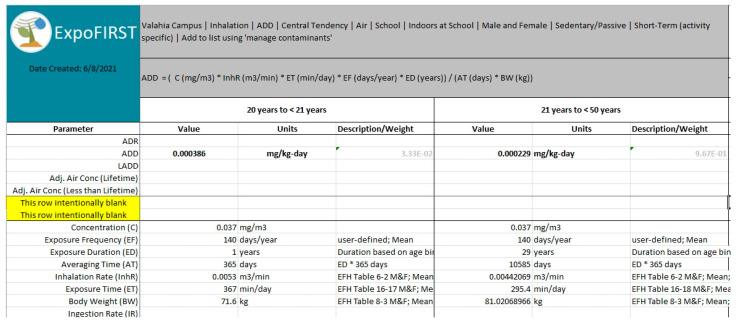
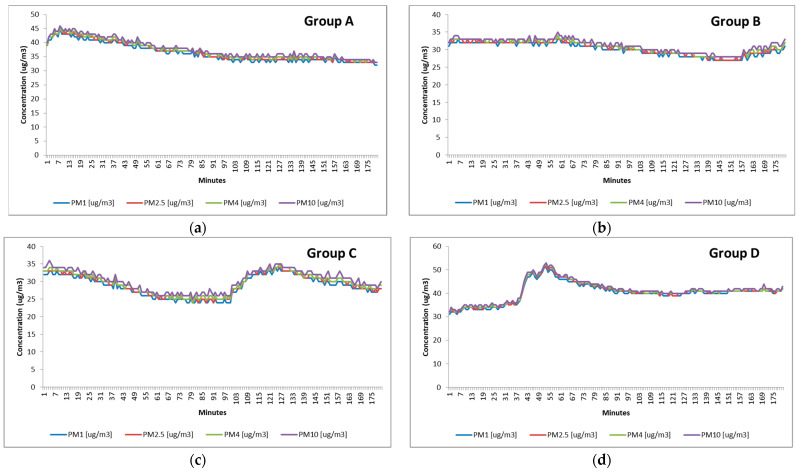
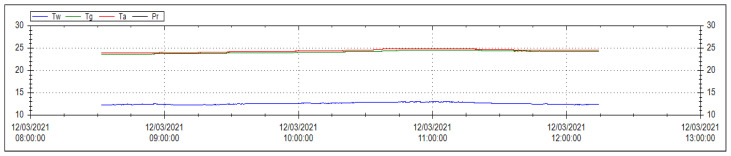
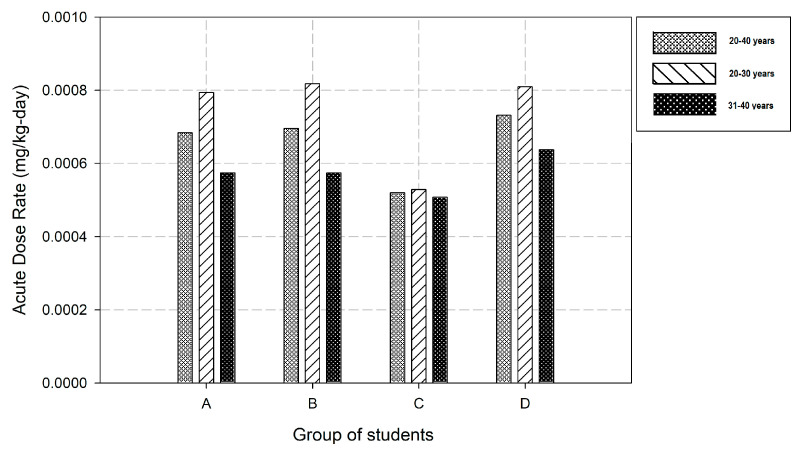
Optical monitors have proven their versatility into the studies of air quality in the workplace and indoor environments. The current study aimed to perform a screening of the indoor environment regarding the presence of various fractions of particulate matter (PM) and the specific thermal microclimate in a classroom occupied with students in March 2019 (before COVID-19 pandemic) and in March 2021 (during pandemic) at Valahia University Campus, Targoviste, Romania. The objectives were to assess the potential exposure of students and academic personnel to PM and to observe the performances of various sensors and monitors (particle counter, PM monitors, and indoor microclimate sensors). PM1 ranged between 29 and 41 μg m-3 and PM10 ranged between 30 and 42 μg m-3. It was observed that the particles belonged mostly to fine and submicrometric fractions in acceptable thermal environments according to the PPD and PMV indices. The particle counter recorded preponderantly 0.3, 0.5, and 1.0 micron categories. The average acute dose rate was estimated as 6.58 × 10⁻⁴ mg/kg-day (CV = 14.3%) for the 20-40 years range. Wearing masks may influence the indoor microclimate and PM levels but additional experiments should be performed at a finer scale.
Keywords: PM1; PM2.5; acute dose rate (ADR); mask wearing; particle counter; predicted mean vote (PMV); predicted percentage of dissatisfied (PPD); size segregated mass fractions; thermal microclimate.
Conflict of interest statement
The authors declare no conflict of interest.
Figures
References
-
- Chereminisoff N.P. Handbook of Air Pollution Prevention and Control. 1st ed. Butterworth-Heinemann; Oxford, UK: 2002. pp. 1–477.
-
- Burnett R.T., Arden Pope C., Ezzati M., Olives C., Lim S.S., Mehta S., Shin H.H., Singh G., Hubbell B., Brauer M., et al. An integrated risk function for estimating the global burden of disease attributable to ambient fine particulate matter exposure. Environ. Health Perspect. 2014;122:397. doi: 10.1289/ehp.1307049. - DOI - PMC - PubMed
-
- Schnelle K.B., Jr., Brown C.A. Air Pollution Control Technology Handbook. 1st ed. CRC Press; Boca Raton, FL, USA: 2001. pp. 1–408.
Publication types
MeSH terms
Substances
Grants and funding
LinkOut - more resources
Full Text Sources
Medical
Research Materials
