. 2021 Jul 16;18(14):7592.
doi: 10.3390/ijerph18147592.

Which National Factors Are Most Influential in the Spread of COVID-19?

Affiliations

Which National Factors Are Most Influential in the Spread of COVID-19?

Hakyong Kim et al. Int J Environ Res Public Health. .

Abstract

The outbreak of the novel COVID-19, declared a global pandemic by WHO, is the most serious public health threat seen in terms of respiratory viruses since the 1918 H1N1 influenza pandemic. It is surprising that the total number of COVID-19 confirmed cases and the number of deaths has varied greatly across countries. Such great variations are caused by age population, health conditions, travel, economy, and environmental factors. Here, we investigated which national factors (life expectancy, aging index, human development index, percentage of malnourished people in the population, extreme poverty, economic ability, health policy, population, age distributions, etc.) influenced the spread of COVID-19 through systematic statistical analysis. First, we employed segmented growth curve models (GCMs) to model the cumulative confirmed cases for 134 countries from 1 January to 31 August 2020 (logistic and Gompertz). Thus, each country's COVID-19 spread pattern was summarized into three growth-curve model parameters. Secondly, we investigated the relationship of selected 31 national factors (from KOSIS and Our World in Data) to these GCM parameters. Our analysis showed that with time, the parameters were influenced by different factors; for example, the parameter related to the maximum number of predicted cumulative confirmed cases was greatly influenced by the total population size, as expected. The other parameter related to the rate of spread of COVID-19 was influenced by aging index, cardiovascular death rate, extreme poverty, median age, percentage of population aged 65 or 70 and older, and so forth. We hope that with their consideration of a country's resources and population dynamics that our results will help in making informed decisions with the most impact against similar infectious diseases.

Keywords: COVID-19; SARS-CoV-2; growth curve models; pandemic.


Conflict of interest statement

The authors declare no conflict of interest.

Figures

Figure 1
Figure 1
Cumulative confirmed cases divided into two segments using the segmentation algorithm. Japan is the typical country with two waves (red: first segment and green: second segment). (A) Epidemic segmented growth curve of COVID-19 fitted by the logistic model. Estimated parameters were (α1, β1, γ1, α2, β2, γ2) = (16549.7588, 7.8244, 0.1231, 58877.8030, 6.7353, and 0.0859, respectively). (B) Epidemic segmented growth curve of COVID-19 fitted by the Gompertz model. Estimated parameters were (α1, β1, γ1, α2, β2, γ2) = (17,531.5024, 89.4251, 0.0760, 98,622.3568, 15.6933, and 0.0325, respectively).
Figure 2
Figure 2
Daily new confirmed cases before (A) and after smoothing using Nadaraya–Watson kernel regression (B).
Figure 3
Figure 3
Differences in the number of countries across segmentation, growth curve models, and MSSE criteria. For the segmented logistic model, 124 countries were fitted, and for the segmented Gompertz model, 119 countries were fitted. To check (validate) the goodness of fit of the above 2 models, we employed MSSE (mean squared scaled error) criteria. For each of the two models, 5 countries showed high MSSE, and therefore those 5 countries were excluded in the subsequent analysis (Aruba, Equatorial Guinea, Krygyzstan, Rwanda, and Thailand for the segmented logistic model, and China, Equatorial Guinea, Kyrgyzstan, Rwanda, and Zambia for the segmented Gompertz model).
Figure 4
Figure 4
Differences in values of maximum predicted cumulative cases (α) and rate of spread of COVID-19 observed (γ) among countries. (A,C) The variation of α vs. γ using the logistic model for the first and second segments, respectively. (B,D) The variation of α vs. γ using the Gompertz model for the first and second segments, respectively.
Figure 4
Figure 4
Differences in values of maximum predicted cumulative cases (α) and rate of spread of COVID-19 observed (γ) among countries. (A,C) The variation of α vs. γ using the logistic model for the first and second segments, respectively. (B,D) The variation of α vs. γ using the Gompertz model for the first and second segments, respectively.
Figure 5
Figure 5
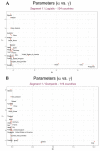
p-values of coefficients of national factors with α and γ. Population, annual precipitation, pharmaceutical sales, and imports to GDP ratio were statistically significant with α, the number of maximum predicted confirmed cases (A,C). Age-related factors, population, percentage of malnourished population, life expectancy, temperature, etc. were significantly related with γ, rate of spread of COVID-19 (B,D) (see Figure S8 for the relationship of national factors with β).
Figure 5
Figure 5
p-values of coefficients of national factors with α and γ. Population, annual precipitation, pharmaceutical sales, and imports to GDP ratio were statistically significant with α, the number of maximum predicted confirmed cases (A,C). Age-related factors, population, percentage of malnourished population, life expectancy, temperature, etc. were significantly related with γ, rate of spread of COVID-19 (B,D) (see Figure S8 for the relationship of national factors with β).
Figure 6
Figure 6
Coefficients of the relationship between national factors and γ. θ1 is the coefficient of the relationship between a national factor and a GCM parameter. Significant national factors (orange) had large coefficients compared with non-significant factors (blue) in both Gompertz (A,C) and logistic models (B,D).
Figure 6
Figure 6
Coefficients of the relationship between national factors and γ. θ1 is the coefficient of the relationship between a national factor and a GCM parameter. Significant national factors (orange) had large coefficients compared with non-significant factors (blue) in both Gompertz (A,C) and logistic models (B,D).
Figure 7
Figure 7
Significant national factors with number of maximum predicted cumulative confirmed cases (α) and rate of spread of COVID-19 (γ). Median age, being aged 65 or older, being aged 70 or older, aging index, cardiovascular death rate, life expectancy, and national competitiveness were the only national factors that were found to be significant across the two models and segments (A). Population was significant across the two models and segments (B) (see Figure S11 for significant national factors with β).

Similar articles

Cited by

References

    1. Priyadarsini S.L., Suresh M. Factors influencing the epidemiological characteristics of pandemic COVID 19: A TISM approach. Int. J. Healthc. Manag. 2020;13:89–98. doi: 10.1080/20479700.2020.1755804. - DOI
    1. Li Q., Guan X., Wu P., Wang X., Zhou L., Tong Y., Ren R., Leung K.S.M., Lau E.H.Y., Wong J.Y., et al. Early Transmission Dynamics in Wuhan, China, of Novel Coronavirus-Infected Pneumonia. N. Engl. J. Med. 2020;382:1199–1207. doi: 10.1056/NEJMoa2001316. - DOI - PMC - PubMed
    1. WHO Director-General’s Opening Remarks. [(accessed on 8 February 2021)]; Available online: https://www.who.int/dg/speeches/detail/whComingsoono-director-general-s-....
    1. Worldometer. [(accessed on 8 February 2021)]; Available online: https://www.worldometers.info/coronavirus/
    1. Bootsma M.C.J., Ferguson N.M. The effect of public health measures on the 1918 influenza pandemic in U.S. cities. Proc. Natl. Acad. Sci. USA. 2007;104:7588–7593. doi: 10.1073/pnas.0611071104. - DOI - PMC - PubMed

Publication types