. 2021 Aug;31(8):1447-1461.
doi: 10.1101/gr.275528.121. Epub 2021 Jul 22.

Three-dimensional missense tolerance ratio analysis

Affiliations

Three-dimensional missense tolerance ratio analysis

Riley E Perszyk et al. Genome Res. 2021 Aug.

Abstract

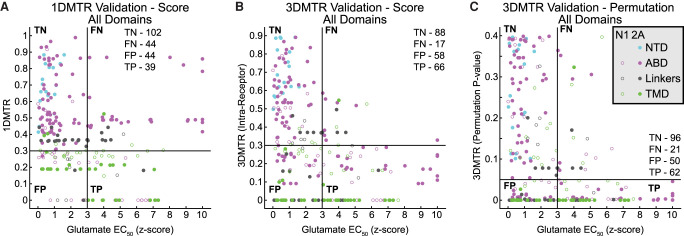
A wealth of genetic information is available describing single-nucleotide variants in the human population that appear to be well-tolerated and in and of themselves do not confer disease. These variant data sets contain signatures about the protein structure-function relationships and provide an unbiased view of various protein functions in the context of human health. This information can be used to determine regional intolerance to variation, defined as the missense tolerance ratio (MTR), which is an indicator of stretches of the polypeptide chain that can tolerate changes without compromising protein function in a manner that impacts human health. This approach circumvents the lack of comprehensive data by averaging the data from adjacent residues on the polypeptide chain. We reasoned that many motifs in proteins consist of nonadjacent residues, but together function as a unit. We therefore developed an approach to analyze nearest neighbors in three-dimensional space as determined by crystallography rather than on the polypeptide chain. We used members of the GRIN gene family that encode subunits of NMDA-type ionotropic glutamate receptors (iGluRs) to exemplify the differences between these methods. Our method, 3DMTR, provides new information about regions of intolerance within iGluRs, allows consideration of protein-protein interfaces in multimeric proteins, and moves this important research tool from one-dimensional analysis to a structurally relevant tool. We validate the improved 3DMTR score by showing that it more accurately classifies the functional consequences of a set of newly measured and published point mutations of Grin family genes than existing methods.


Figures

Figure 1.
Figure 1.
The sequential MTR score (1DMTR) of GRIN2A and structural mapping of GRIN2A variants. (A) The 1DMTR score of GRIN2A, calculated using gnomAD v2.1.1. (B) Linear domain map of the GRIN2A gene semiautonomous domains of the receptor. The linear map matches the x-axis of the graph in A. A raster plot of the GRIN2A variants found in gnomAD is plotted below the linear map: (orange) synonymous variants; (cyan) missense variants. (C) View of the GRIN2A structure (homology model) (Supplemental File 1) depicting the GRIN2A variants shown in B. (D) View of the GRIN2A subunit illustrating the extracellular and transmembrane domains. The NTD is depicted in cyan, the first ABD segment (ABD-S1) in magenta, the second ABD segment (ABD-S2) in purple, the TMD in green, and the linkers in gray. (E) View of the GRIN2A subunit colored to depict its position along the polypeptide chain, represented by the gradient shown below the structure. The gradient is shown next to the linear domain map depicting the main receptor domains. Some residues in the M1-M2 linker are missing from the structure, shown by the black region in the linear scale. (F) A closer view of the GRIN2A ABD highlighting the two portions of the polypeptide chain (ABD-S1, ABD-S2) that form the domain.
Figure 2.
Figure 2.
GRIN2A comparison of the closest residues as determined by sequence (1D) or inter-residue distances (3D). (A) Residue distances from Pro686. (A1) A linear heatmap raster plot and heatmap showing the distance of all residues in the GRIN2A subunit to residue Pro686. (A2) A closer view of the ABD in A1. (B) Closest 31 residues (1D) to Pro686. (B1) A linear raster plot and structural view of the 31 sequentially closest (1D) residues (blue) to Pro686 (red), with the side chains depicted by sticks. (B2) A closer view of the ABD in B1. (C) Closest 31 residues (3D) to Pro686. (C1) A linear raster plot and structural view of the 31 closest (3D) residues (blue) to Pro686 (red), side chains depicted by sticks. (C2) A closer view of the ABD in C1.
Figure 3.
Figure 3.
Comparison of the GRIN2A 1DMTR and 3DMTR intra-subunit scores. (A) The linear (1D) MTR score of GRIN2A. (A1) The 1DMTR score shown via a scatter plot and raster plot (see color bar for score representation; intolerant scores are blue, tolerant scores are red). (A2) View of the 1DMTR score heatmap applied to the GRIN2A structure. (A3) A closer view of the ABD in A2. (A4) A closer view of the TMD in A2. (B) The 3DMTR score of GRIN2A, illustrated similarly as in A. (C) The difference in the 3DMTR and the 1DMTR score of GRIN2A. The color bar for the raster plots and the structure heatmaps is shown above C2.
Figure 4.
Figure 4.
Comparison of the included residues in the 1DMTR, 3DMTR intra-subunit, and 3DMTR intra-receptor calculation. (A) Structural views of the GRIN1/2A receptor. The GRIN1 subunits are colored in pale yellow and the GRIN2A subunits are colored pale green. The full receptor is shown in A1, a top down view of the four isolated NTDs of the receptor in A2, and a side view of one NTD dimer in A3. B) The closest 31 residues as determined using the 1D polypeptide sequence (B1), the inter-residue distances within just the GRIN2A subunit (B2), and the inter-residue distances within the GRIN1/2A receptor structure (B3). This viewpoint is depicted by the cartoon eye labeled (B) in A1. Of the closest 31 residues in the receptor structure to GRIN2A-Chain B-Phe652, there are three residues from Chain A, nine residues from Chain C, and 19 residues from Chain B. A view of the receptor structure and a raster plot of the closest residues are shown. In the structure views, the closest 31 residue side chains are depicted by sticks and colored based on the subunit coloring in A: (yellow) GRIN1; (green) GRIN2; (red) Phe652.
Figure 5.
Figure 5.
3DMTR intra-receptor score of GRIN1/2A. (A) Scatter plots of the GRIN1 (A1) and GRIN2A (A2) 3DMTR (intra-receptor) score. (Below) Raster plots of each subunit's 1DMTR, 3DMTR intra-subunit, and the 3DMTR intra-receptor scores. (*) Primary differences between the intra-subunit and intra-receptor 3DMTR scores. (B) Structural heatmap views showing the 3DMTR (intra-receptor) score on the full receptor (B1), a top down view of the four isolated NTDs of the receptor (B2), a side view of one NTD dimer (B3); one of the GRIN1 (B4) and GRIN2A (B5) subunits are shown in isolation. All raster plots and structural heatmaps use the same color bar, shown at the top right of B5.
Figure 6.
Figure 6.
Permutation analysis (residue randomization) identifies the 3DMTR scores that are unlikely given random chance. (A1) Scatter plot of the GRIN1 (Chain C) 3DMTR score (magenta line, black dots), the permutation 3DMTR score mean (black line), and ±1 and ±2 standard deviations of the permutation 3DMTR score (gray areas). The mean and standard deviation are calculated for each residue based on the permutation results for that particular residue (for the distributions of several example data sets, see Supplemental Fig. S10). (A2) Raster plots of the GRIN1 3DMTR score and the calculated significance via permutation analysis. A residue is deemed highly intolerant (blue, less than the permutation analysis mean minus 2 standard deviations) and highly tolerant (red, more than the permutation analysis mean plus 2 standard deviations). (B) Permutation analysis for GRIN2A (Chain B) as shown by similar plots in A. (C) The structural map of calculated significance from permutation analysis (same as the raster plots above), mapped onto a GRIN1 subunit and GRIN2A subunit (C1). Closer view of the ABDs: (C2) GRIN1; (C3) GRIN2A. Closer view of the NTDs, shown with side chains (sticks) of the identified significant residues: (C4) top down; (C5) side view depicted in C4.
Figure 7.
Figure 7.
The 3DMTR is a better predictor of functional consequences of GRIN1/2A point mutations. (AC) Scatter plots of various residues’ glutamate EC50 (represented as a Z-score based on intra-study wild-type distribution) and MTR score: (A) 1DMTR; (B) 3DMTR; (C) 3DMTR permutation analysis. Thresholds for the MTR score, <0.3 (A), <0.3 (B), <0.05 (C), and for the glutamate EC50 Z-score (>3) were determined from the distribution of WT EC50 values across the studies included. Implementation of threshold criteria creates a binary classification to determine the portions of the residues which are deemed highly intolerant and have differences in receptor function when mutated. Thus, each residue can be classified as true negative (TN), false negative (FN), false positive (FP), and true positive (TP), and the various MTR methods can be compared.

References

    1. Addis L, Virdee JK, Vidler LR, Collier DA, Pal DK, Ursu D. 2017. Epilepsy-associated GRIN2A mutations reduce NMDA receptor trafficking and agonist potency-molecular profiling and functional rescue. Sci Rep 7: 66. 10.1038/s41598-017-00115-w - DOI - PMC - PubMed
    1. Amin JB, Moody GR, Wollmuth LP. 2020. From bedside-to-bench: what disease-associated variants are teaching us about the NMDA receptor. J Physiol 599: 397–416. 10.1113/JP278705 - DOI - PMC - PubMed
    1. Anson LC, Chen PE, Wyllie DJA, Colquhoun D, Schoepfer R. 1998. Identification of amino acid residues of the NR2A subunit that control glutamate potency in recombinant NR1/NR2A NMDA receptors. J Neurosci 18: 581–589. 10.1523/JNEUROSCI.18-02-00581.1998 - DOI - PMC - PubMed
    1. Bledsoe D, Tamer C, Mesic I, Madry C, Klein BG, Laube B, Costa BM. 2017. Positive modulatory interactions of NMDA receptor GluN1/2B ligand binding domains attenuate antagonists activity. Front Pharmacol 8: 229. 10.3389/fphar.2017.00229 - DOI - PMC - PubMed
    1. Chen PE, Geballe MT, Stansfeld PJ, Johnston AR, Yuan H, Jacob AL, Snyder JP, Traynelis SF, Wyllie DJA. 2005. Structural features of the glutamate binding site in recombinant NR1/NR2A N-methyl-D-aspartate receptors determined by site-directed mutagenesis and molecular modeling. Mol Pharmacol 67: 1470–1484. 10.1124/mol.104.008185 - DOI - PubMed

Publication types

LinkOut - more resources