. 2021 Aug;31(8):1433-1446.
doi: 10.1101/gr.265058.120. Epub 2021 Jul 22.

Longitudinal linked-read sequencing reveals ecological and evolutionary responses of a human gut microbiome during antibiotic treatment

Affiliations

Longitudinal linked-read sequencing reveals ecological and evolutionary responses of a human gut microbiome during antibiotic treatment

Morteza Roodgar et al. Genome Res. 2021 Aug.

Abstract

Gut microbial communities can respond to antibiotic perturbations by rapidly altering their taxonomic and functional composition. However, little is known about the strain-level processes that drive this collective response. Here, we characterize the gut microbiome of a single individual at high temporal and genetic resolution through a period of health, disease, antibiotic treatment, and recovery. We used deep, linked-read metagenomic sequencing to track the longitudinal trajectories of thousands of single nucleotide variants within 36 species, which allowed us to contrast these genetic dynamics with the ecological fluctuations at the species level. We found that antibiotics can drive rapid shifts in the genetic composition of individual species, often involving incomplete genome-wide sweeps of pre-existing variants. These genetic changes were frequently observed in species without obvious changes in species abundance, emphasizing the importance of monitoring diversity below the species level. We also found that many sweeping variants quickly reverted to their baseline levels once antibiotic treatment had concluded, demonstrating that the ecological resilience of the microbiota can sometimes extend all the way down to the genetic level. Our results provide new insights into the population genetic forces that shape individual microbiomes on therapeutically relevant timescales, with potential implications for personalized health and disease.


Figures

Figure 1.
Figure 1.
Read cloud sequencing of the gut microbiome of a single individual during disease, antibiotic treatment, and recovery. (A) Study design. Linked-read metagenomic sequencing was performed on 19 fecal samples collected from a single individual over a period of 5 mo. During this time, the individual was diagnosed with human rhinovirus (HRV) and Lyme disease and received an oral course of doxycycline. Samples are colored according to the epochs defined in Supplemental Table S1. (B) Rank relative abundance distribution at the species level, estimated from shotgun metagenomic reads (Methods). Colored lines show distributions obtained from individual time points, using the same color scheme as panel A. Solid and dashed black lines denote median and maximum relative abundances across all time points, respectively. (C) Species-level composition over time. Top panel illustrates Jensen-Shannon distance to each of four baseline samples as a function of time. Bottom panel shows relative abundance trajectories for a subset of the most abundant species; others are grouped together into the “other” category. (D) Schematic of linked-read sequencing with the 10x Genomics platform. High molecular weight metagenomic DNA is partitioned into millions of microfluidic droplets. Amplification and ligation reactions are performed within each droplet, yielding millions of short-read libraries that are tagged with droplet-specific DNA barcodes. The resulting “read clouds” are then pooled together and sequenced on an Illumina instrument. (E) Observed statistics of read clouds from the first three time points. The top panel shows total number of read pairs contributed by read clouds as a function of the number of read pairs they contain. The bottom panel shows a measure of the effective number of species that are detected in each read cloud as a function of the number of read pairs it contains (Methods). Many read clouds contain fragments from several different DNA molecules.
Figure 2.
Figure 2.
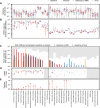
Varied ecological and genetic responses across 36 abundant species in the same host. (A) Relative abundances of species through time, partitioned according to the epochs defined in Figure 1A. Each time point is indicated by a point, and the time points from the same epoch are connected by a vertical line to aid in visualization. For comparison, the gray distribution shows the corresponding values across a larger human cohort (Methods). Species whose relative abundance drops by more than 10-fold between baseline and antibiotic time points are indicated with a single star. Only a minority of the most abundant species experience such reductions in relative abundance during treatment. (B) Within-species nucleotide diversity for each time point, as measured by the fraction of core genome sites with intermediate allele frequencies (0.2 < f< 0.8) (Methods). Points are plotted using the same color scheme as panel A. (C) The total number of single nucleotide (SNV) differences between a baseline time point and each of the later epochs (Methods). The height of the white area indicates the total number of polymorphic SNVs that were tested for temporal variation. Different species display a range of different behaviors, which can be partitioned into putative cases of competition between distantly related strains (left of vertical divider line) and evolution within a dominant resident strain (right). (D) Initial frequencies of alleles identified in panel C. For species with more than 10 SNV differences, the data are summarized by the median initial frequency (square symbol) and the interquartile range (line). Many alleles have nonzero frequency before the sweep occurs. (E) Fraction of SNV differences in panel C that are retained at the final time point (f > 0.7). In many species, only a minority of SNV differences gained during disease or treatment are retained.
Figure 3.
Figure 3.
Ecological and genetic dynamics in six example species. (AF) A subset of the species in Figure 2 were chosen to illustrate a range of characteristic behaviors. For each of the six species, the top panel shows the relative abundance of that species over time, whereas the bottom panel shows the frequencies of single nucleotide variants (SNVs) within that species. Colored lines indicate SNVs that underwent a significant shift in frequency over time (Methods), whereas a subset of nonsignificant SNVs are shown in light gray for comparison. The colors of temporally varying SNVs are assigned by a hierarchical clustering scheme, which is also used to determine their polarization (Methods). The shaded region denotes the antibiotic treatment period depicted in Figure 1A.
Figure 4.
Figure 4.
High levels of linkage disequilibrium (LD) in many resident populations. (A) Schematic of read cloud sharing between two SNVs separated by coordinate distance ℓ on the same reference contig. Three or fewer haplotypes are consistent with clonal evolution, whereas four haplotypes indicate a possible recombination event. (B) Observed fraction of shared read clouds as a function of ℓ for SNVs in the six example species in Figure 3. (C) Linkage disequilibrium between pairs of SNVs across a range of different species. The top panel shows the total number of linked SNV pairs (i.e., those with significantly elevated levels of read cloud sharing) for species in Figure 2 with sufficient coverage (Methods). For each species, the three bars denote SNV pairs with ℓ < 200 bp, 200 bp < ℓ < 2 kb, and ℓ > 2 kb, respectively. SNVs are included only if the minor allele has frequency f > 0.1. The bottom panel shows the observed proportion of SNV pairs in the top panel that fall in each of the LD categories illustrated in panel A. Across species, only a small fraction of SNV pairs provide evidence for recombination.
Figure 5.
Figure 5.
Signatures of strain replacement and evolutionary modification. (AF) Statistical properties of temporally varying SNVs from the six example species in Figure 3. For each species, the bars on the left show the relative proportion of SNVs with different protein-coding effects and allele prevalence across other hosts in a larger cohort (Methods). Protein-coding effects are estimated from the codon degeneracy at each site (4D = fourfold degenerate/synonymous, 1D = onefold degenerate/nonsynonymous). Allele prevalences for SNVs not observed in other hosts are indicated by light red or blue shading. Pie charts indicate the relative proportion of private marker SNVs for each species that are preserved or disrupted throughout the sampling interval (Methods). Large fractions of disrupted marker SNVs indicate a strain replacement event.

References

    1. Agwuh KN, MacGowan A. 2006. Pharmacokinetics and pharmacodynamics of the tetracyclines including glycylcyclines. J Antimicrob Chemother 58: 256–265. 10.1093/jac/dkl224 - DOI - PubMed
    1. Asnicar F, Manara S, Zolfo M, Truong DT, Scholz M, Armanini F, Ferretti P, Gorfer V, Pedrotti A, Tett A, et al. 2017. Studying vertical microbiome transmission from mothers to infants by strain-level metagenomic profiling. mSystems 2: e00164-16. 10.1128/mSystems.00164-16 - DOI - PMC - PubMed
    1. Bishara A, Moss EL, Kolmogorov M, Parada AE, Weng Z, Sidow A, Dekas AE, Batzoglou S, Bhatt AS. 2018. High-quality genome sequences of uncultured microbes by assembly of read clouds. Nat Biotechnol 36: 1067–1075. 10.1038/nbt.4266 - DOI - PMC - PubMed
    1. Bollback JP, York TL, Nielsen R. 2008. Estimation of 2Nes from temporal allele frequency data. Genetics 179: 497–502. 10.1534/genetics.107.085019 - DOI - PMC - PubMed
    1. Buffie CG, Bucci V, Stein RR, McKenney PT, Ling L, Gobourne A, No D, Liu H, Kinnebrew M, Viale A, et al. 2015. Precision microbiome reconstitution restores bile acid mediated resistance to Clostridium difficile. Nature 517: 205–208. 10.1038/nature13828 - DOI - PMC - PubMed

Publication types

Substances