. 2021 Sep;31(9):1561-1572.
doi: 10.1101/gr.275358.121. Epub 2021 Jul 23.

Genome-wide variability in recombination activity is associated with meiotic chromatin organization

Affiliations

Genome-wide variability in recombination activity is associated with meiotic chromatin organization

Xiaofan Jin et al. Genome Res. 2021 Sep.

Abstract

Recombination enables reciprocal exchange of genomic information between parental chromosomes and successful segregation of homologous chromosomes during meiosis. Errors in this process lead to negative health outcomes, whereas variability in recombination rate affects genome evolution. In mammals, most crossovers occur in hotspots defined by PRDM9 motifs, although PRDM9 binding peaks are not all equally hot. We hypothesize that dynamic patterns of meiotic genome folding are linked to recombination activity. We apply an integrative bioinformatics approach to analyze how three-dimensional (3D) chromosomal organization during meiosis relates to rates of double-strand-break (DSB) and crossover (CO) formation at PRDM9 binding peaks. We show that active, spatially accessible genomic regions during meiotic prophase are associated with DSB-favored loci, which further adopt a transient locally active configuration in early prophase. Conversely, crossover formation is depleted among DSBs in spatially accessible regions during meiotic prophase, particularly within gene bodies. We also find evidence that active chromatin regions have smaller average loop sizes in mammalian meiosis. Collectively, these findings establish that differences in chromatin architecture along chromosomal axes are associated with variable recombination activity. We propose an updated framework describing how 3D organization of brush-loop chromosomes during meiosis may modulate recombination.


Figures

Figure 1.
Figure 1.
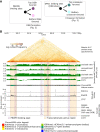
Multiple chromatin organization data sets are integrated with measurements of recombination activity at the levels of PRDM9 binding, DSB, and crossover formation. (A) Overview of recombination-related comparisons explored in this paper. Figure 2 explores chromatin conformation at PRDM9 binding peaks, stratifying based on their likelihood of forming DSBs as measured via DMC1-SSDS ChIP-seq signal. Subsequently, Figure 3 explores chromatin conformation at DMC1-SSDS binding peaks, indicative of DSBs, stratifying based on their likelihood of forming crossovers. (B) Key data sets used in this study (see also Supplemental Section S1), shown in a browser view of a representative 1.3-Mb region on mm10 Chromosome 2. Pachynema Hi-C contact frequencies are shown as a heatmap, in addition to Hi-C-derived cis/total ratio and compartment score for zygonema and pachynema. Hi-C contact information is accompanied by epigenetic chromatin state information using ChromHMM annotations of histone marks in mouse testis (for color legend, see bottom), as well as meiotic ChIP-seq tracks of cohesin subunit RAD21L, RNAPII, and CTCF. Recombination activity measurements include ChIP-seq binding tracks of PRDM9, DMC1 (marking DSBs), as well as crossover likelihood score derived from single-sperm whole-genome sequencing. Several relationships to note in this region: (1) enriched Hi-C contacts between transcriptionally active regions during meiosis, highlighted in orange shaded boxes; (2) colocalized DSB formation and crossover formation at PRDM9 binding peaks, highlighted in purple shaded boxes; (3) differences in DSB and crossover likelihood among PRDM9 binding peaks; and (4) locally depressed cis/total ratio and elevated compartment score at these loci in zygonema. Hi-C bins with missing data are ignored for visualization of maps and derived scores.
Figure 2.
Figure 2.
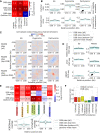
Chromatin environments at PRDM9 sites. (A) Summary of recombination activity at PRDM9 sites, with additional partition into the top and bottom quartiles by DMC1-SSDS ChIP-seq score, measuring DSB activity. Top (i.e., DSB-favored) sites have more bound PRDM9 and greater likelihood of crossover formation. Heatmap shows log fold enrichment over genome median, and an asterisk indicates a Bonferroni-adjusted P < 0.01 difference between top and bottom partitioned sites. (B) Hi-C cis/total ratio (top) and compartment score (bottom), symmetric-averaged across PRDM9 sites, calculated for ES, zygonema, and pachynema data sets. Shading represents 95% confidence intervals. Top DSB-favored sites are associated with higher compartment score in all data sets and lower cis/total ratio in ES. Black arrows indicate zygomena-specific shifts toward active, spatially accessible chromatin, which are enhanced at DSB-favored sites. (C) Normalized chromatin contact matrices, symmetric-averaged across PRDM9 sites, for embryonic stem (ES) cell, zygonema, and pachynema Hi-C data sets. We observe contact depletion at PRDM9 sites during zygonema and enriched contacts near DSB-favored sites during pachynema. (D) RAD21/RAD21L cohesin subunit (top), CTCF (middle), and RNAPII (bottom) ChIP-seq tracks, symmetric-averaged across PRDM9 sites, calculated for ES cell and meiotic data sets. Elevated RNAPII occupancy during meiosis appears to be associated with increased DSB formation (black arrow). (E) Overlap of ChromHMM histone annotations with PRDM9 sites. Note DSB-favored sites are depleted for unmarked chromatin while enriched for H3K36me3 chromatin typical of gene bodies. Heatmap shows log fold enrichment over genome-wide mean, and an asterisk indicates a Bonferroni-adjusted P < 0.01 difference between most (top) and least (bottom) DSB-favored sites. Insets plot overlap fraction symmetric-averaged around PRDM9 sites; shading represents 95% confidence intervals. (F) Distribution of DMC1 ChIP-seq scores (i.e., DSB activity) at PRDM9 sites split by ChromHMM state. DSB formation is elevated within H3K36me3-marked chromatin characteristic of gene bodies.
Figure 3.
Figure 3.
Spatially accessible chromatin is depleted for crossover formation, particularly at gene bodies. (A) Summary of recombination activity at DSB binding sites (from DMC1-SSDS ChIP-seq), with additional partition into the top and bottom quartiles for crossover likelihood. Top (i.e., crossover-favored) sites have modestly stronger inherent DSB activity and show greater likelihood of crossover formation. Heatmap shows log fold enrichment over genome median, and an asterisk indicates a Bonferroni-adjusted P < 0.01 difference between the top and bottom partitioned sites. (B) Hi-C cis/total ratio (top) and compartment score (bottom), symmetric-averaged across DSB sites, calculated for ES cell, zygonema, and pachynema data sets. Shading represents 95% confidence intervals. Top CO-favored sites are associated with a higher cis/total ratio, particularly during meiosis, indicative of reduced spatial accessibility (black arrow). (C) Normalized chromatin contact matrices, symmetric-averaged across DSB sites, for ES cell, zygonema, and pachynema Hi-C data sets. We observe reduced contact frequency near top CO-favored sites and vice versa, particularly during pachynema. (D) RAD21/RAD21L cohesin subunit (top), CTCF (middle), and RNAPII (bottom) ChIP-seq tracks, symmetric-averaged across DSB sites, calculated for ES cell and meiotic data sets. Elevated RNAPII occupancy during meiosis appears to be associated with decreased crossover formation (black arrow). (E) Overlap of ChromHMM histone annotations with crossover-partitioned DSB sites. Note CO-favored sites are depleted for the H3K36me3 chromatin typical of gene bodies and are enriched for unmarked chromatin. Heatmap shows log fold enrichment over genome-wide mean, and an asterisk indicates a Bonferroni-adjusted P < 0.01 difference between most (top) and least (bottom) CO-favored sites. Insets plot overlap fraction symmetric-averaged around DSB sites; shading represents 95% confidence intervals. (F) Distribution of crossover likelihood scores at DSB sites split by ChromHMM state. Crossover formation is depleted at DSBs in H3K36me3 chromatin, despite abundant DSB activity (see Fig. 2F), indicating that gene-body crossover depletion occurs at the DSB-to-CO stage rather than the PRDM9-to-DSB stage.
Figure 4.
Figure 4.
Principal component analysis (PCA) with linear model reveals variable chromatin organization at PRDM9 and DSB sites and its relationship with recombination activity. (A) Loadings for the top four principal components (PC1–PC4) of variation at joint PRDM9–DSB sites based on underlying chromatin organization variables (horizontal axis). Two values of each variable were included: one measuring local value at the joint PRDM9–DSB site and the other a 500-kb average around the site. Positive PC1 loadings reflect presence of active chromatin, which is typically characterized by a low cis/total ratio, high compartment, FIRE, and insulation scores, as well as increased histone modifications, RAD21L cohesin subunit, and RNAPII. Positive PC2 loadings indicate the presence of H3K36me3 histone marks typical of gene bodies, which tend to colocalize with increases in FIRE score, as well as meiotic-specific decreases in cis/total ratio. PC3 reflects divergence from the typical correlation between activity and spatial accessibility: Specifically, positive PC3 loadings indicate chromatin regions that are more spatially accessible (lower cis/total ratio) than expected given their activity (compartment score). Positive PC4 loadings indicate strong local enrichment of RAD21L/CTCF/RNAPII, characteristic of occupancy sites. (B) Results from a linear model for DSB activity (quantified by DMC1-SSDS ChIP-seq score) at PRDM9 sites as a function of the principal components described in A and adjusted for centromeric proximity (chromosomal position) and inherent PRDM9 binding variability (PRDM9 ChIP-seq score). Forward selection was used to choose statistically significant principal components to include in the model. Note that the strongest predictors are positive inherent PRDM9 binding strength and positive PC1, reflecting increased DSB formation at PRDM9 sites in active, spatially accessible chromatin. PC colors as in panel A. (C) Results from a linear model with forward feature selection for crossover likelihood at DSB sites as a function of principal components and adjusted for centromeric proximity (chromosomal position) and inherent DSB variability (DMC1-SSDS ChIP-seq score). DMC1-SSDS score and chromosomal position both positively predict crossover formation, reflective of inherent DSB variability and pericentromeric crossover depletion. PC1–PC4 all negatively predict crossover formation, reflecting crossover depletion at DSB sites in active chromatin, particularly at gene bodies, as well as promoters and spatially accessible regions. PC colors as in panel A.
Figure 5.
Figure 5.
Proposed framework relating mammalian meiotic chromosomal architecture and recombination. (A) Contact probability versus genomic distance analysis of zygonema Hi-C data set. Orange and blue arrows indicate estimate of loop length for A- and B-compartments, respectively, determined as the maxima of the derivatives of the P(s) curves as in Gassler et al. (2017). (B) Simplified cartoon of proposed chromatin conformation. In early leptonema, meiotic chromosomes adopt a brush-loop architecture, with cohesin and recombination machinery located at the axis. Loops in the A-compartment have, on average, fewer base pairs than the B-compartment. Accordingly, A- and B-compartment regions depicted here represent roughly equal genomic lengths despite greater number of A-compartment loops. Physical size of A- and B-compartment loops may remain comparable owing to the relaxed linear packing density in A-compartment. (C) Concurrently during leptonema, PRDM9 binds across both A- and B-compartment regions, causing local increases in chromatin activity and spatial accessibility. Schematic depicts hypothetical example of 10 total binding events across the A- and B-compartment regions. After PRDM9 binding, a subset of binding loci are recruited to DSB machinery at the axis and form DSBs. This subset is biased toward A-compartment. Later during pachynema, a single crossover point is selected from the DSBs formed earlier, avoiding DSBs formed in gene-body regions.

Similar articles

Cited by

References

    1. Abdennur N, Mirny LA. 2020. Cooler: scalable storage for Hi-C data and other genomically labeled arrays. Bioinformatics 36: 311–316. 10.1093/bioinformatics/btz540 - DOI - PMC - PubMed
    1. Alavattam KG, Maezawa S, Sakashita A, Khoury H, Barski A, Kaplan N, Namekawa SH. 2019. Attenuated chromatin compartmentalization in meiosis and its maturation in sperm development. Nat Struct Mol Biol 26: 175–184. 10.1038/s41594-019-0189-y - DOI - PMC - PubMed
    1. Albert PS, Zhang T, Semrau K, Rouillard JM, Kao YH, Wang CJR, Danilova TV, Jiang J, Birchler JA. 2019. Whole-chromosome paints in maize reveal rearrangements, nuclear domains, and chromosomal relationships. Proc Natl Acad Sci 116: 1679–1685. 10.1073/pnas.1813957116 - DOI - PMC - PubMed
    1. Baker BS, Carpenter ATC, Esposito MS, Esposito RE, Sandler L. 1976. The genetic control of meiosis. Annu Rev Genet 10: 53–134. 10.1146/annurev.ge.10.120176.000413 - DOI - PubMed
    1. Baker CL, Walker M, Kajita S, Petkov PM, Paigen K. 2014. PRDM9 binding organizes hotspot nucleosomes and limits Holliday junction migration. Genome Res 24: 724–732. 10.1101/gr.170167.113 - DOI - PMC - PubMed

Publication types