. 2021 Dec 1;11(12):3008-3027.
doi: 10.1158/2159-8290.CD-20-1631.

Genomes for Kids: The Scope of Pathogenic Mutations in Pediatric Cancer Revealed by Comprehensive DNA and RNA Sequencing

Affiliations

Genomes for Kids: The Scope of Pathogenic Mutations in Pediatric Cancer Revealed by Comprehensive DNA and RNA Sequencing

Scott Newman et al. Cancer Discov. .

Abstract

Genomic studies of pediatric cancer have primarily focused on specific tumor types or high-risk disease. Here, we used a three-platform sequencing approach, including whole-genome sequencing (WGS), whole-exome sequencing (WES), and RNA sequencing (RNA-seq), to examine tumor and germline genomes from 309 prospectively identified children with newly diagnosed (85%) or relapsed/refractory (15%) cancers, unselected for tumor type. Eighty-six percent of patients harbored diagnostic (53%), prognostic (57%), therapeutically relevant (25%), and/or cancer-predisposing (18%) variants. Inclusion of WGS enabled detection of activating gene fusions and enhancer hijacks (36% and 8% of tumors, respectively), small intragenic deletions (15% of tumors), and mutational signatures revealing of pathogenic variant effects. Evaluation of paired tumor-normal data revealed relevance to tumor development for 55% of pathogenic germline variants. This study demonstrates the power of a three-platform approach that incorporates WGS to interrogate and interpret the full range of genomic variants across newly diagnosed as well as relapsed/refractory pediatric cancers.

Significance: Pediatric cancers are driven by diverse genomic lesions, and sequencing has proven useful in evaluating high-risk and relapsed/refractory cases. We show that combined WGS, WES, and RNA-seq of tumor and paired normal tissues enables identification and characterization of genetic drivers across the full spectrum of pediatric cancers. This article is highlighted in the In This Issue feature, p. 2945.


Figures

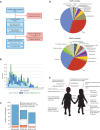
Figure 1. Patient accrual and demographic data. A, Consort diagram depicting patient accrual into G4K. *Three patients were removed from the study when pathology revealed that 1 patient had no cancer, another patient died before a germline sample could be collected, and another patient declined return of germline results and there was insufficient tumor for sequencing. B, Age distribution of patients. C, Number of patients with newly diagnosed or relapsed or refractory tumors, or no tumor available for sequencing, broken down by major tumor type. D, The distribution of cancer types represented in the G4K cohort (top) compared to the distribution of pediatric cancers in the NCI SEER program (bottom). ACT, adrenocortical tumor; STS, soft-tissue sarcoma. E, Eighteen rare tumor types found in the G4K cohort. Rare tumor types were defined as those present at less than 2 per million children annually in the United States.
Figure 1.
Patient accrual and demographic data. A, Consort diagram depicting patient accrual into G4K. *Three patients were removed from the study when pathology revealed that 1 patient had no cancer, another patient died before a germline sample could be collected, and another patient declined return of germline results and there was insufficient tumor for sequencing. B, Age distribution of patients. C, Number of patients with newly diagnosed or relapsed or refractory tumors, or no tumor available for sequencing, broken down by major tumor type. D, The distribution of cancer types represented in the G4K cohort (top) compared to the distribution of pediatric cancers in the NCI SEER program (bottom). ACT, adrenocortical tumor; STS, soft-tissue sarcoma. E, Eighteen rare tumor types found in the G4K cohort. Rare tumor types were defined as those present at less than 2 per million children annually in the United States.
Figure 2. Somatic findings in the 253 analyzed tumors. A, Bar charts showing the numbers and relative contributions of mutational mechanisms affecting cancer genes in the tumors analyzed through G4K. The top 25 mutated genes for hematologic, CNS, and solid tumors are shown as are gene fusions or enhancer hijack events for singletons in CNS and solid tumors. B, Gene fusions and enhancer hijacks detected in G4K samples. Number of samples with a given fusion are indicated in the leftmost column, followed by the genes/loci involved and the diseases in which they were detected (see Supplementary Fig. S3 for schematics depicting the 20 rare fusions). Black or red tiles indicate whether the identified gene fusions or enhancer hijacks have a clear or likely clinical utility, arranged into three columns indicating diagnostic (stethoscope), prognostic (patient chart), and therapeutically relevant (target) categories. In the rightmost column (question mark), tiles indicate lesions with an unknown clinical utility, but considered biologically relevant to the tumor. Red disease names and tiles were identified in the rare tumors, as shown in Fig. 1E. Disease abbreviations and additional details regarding SV classifications and literature citations can be found in Supplementary Table S2.
Figure 2.
Somatic findings in the 253 analyzed tumors. A, Bar charts showing the numbers and relative contributions of mutational mechanisms affecting cancer genes in the tumors analyzed through G4K. The top 25 mutated genes for hematologic, CNS, and solid tumors are shown as are gene fusions or enhancer hijack events for singletons in CNS and solid tumors. B, Gene fusions and enhancer hijacks detected in G4K samples. Number of samples with a given fusion are indicated in the leftmost column, followed by the genes/loci involved and the diseases in which they were detected (see Supplementary Fig. S3 for schematics depicting the 20 rare fusions). Black or red tiles indicate whether the identified gene fusions or enhancer hijacks have a clear or likely clinical utility, arranged into three columns indicating diagnostic (stethoscope), prognostic (patient chart), and therapeutically relevant (target) categories. In the rightmost column (question mark), tiles indicate lesions with an unknown clinical utility, but considered biologically relevant to the tumor. Red disease names and tiles were identified in the rare tumors, as shown in Fig. 1E. Disease abbreviations and additional details regarding SV classifications and literature citations can be found in Supplementary Table S2.
Figure 3. Using multi-omics data to interpret pathogenicity of SVs. A, GenomePaint plots showing two regions, chr8:128500000–130600000 (top) and chr5: 170710000–170790000 (bottom) [hg19], from SJTALL030071. Both panels consist of the RefSeq gene model in green, with MYC and TLX3 highlighted by red boxes; orange bars show regions of copy-number gain supported by increased WGS coverage plotted as the blue histogram immediately below. Gray lollipops marked t(5;8) indicate the position of the translocation breakpoint. RNA-seq coverage is shown below the whole-genome coverage histogram. Additional data from NCI-TARGET are also shown, with narrow red bars representing regions of copy-number gain and gray lollipops representing SV breakpoints surrounding the TLX3 locus. A region or recurrent copy-number gain in TARGET samples is adjacent to the chromosome 8 breakpoint in SJTALL030071. Generally high but nonspecific RNA-seq coverage at this locus suggests a region of high transcriptional activity (distal MYC enhancer) is brought into proximity of TLX3 by the translocation. CNV, copy-number variation. B, A rank-order plot of T-ALL from TARGET showing expression levels of TLX3 mRNA in a set of TLX3-activated tumors compared with tumors in which TLX3 was not activated. SJTALL030071 TLX3 expression (red dot) groups with the activated set. C, Allele-specific expression (ASE) of the TLX3 locus in SJTALL030071. The tumor DNA (top row) shows a series of heterozygous alleles in the TLX3 locus (blue and red stacked bars show relative VAF from WGS data). In the RNA-seq data (second row), expression of only one allele is observed. RNA coverage, read counts at each allele, are shown numerically (third row). Beneath the read counts, black lines map the locations of the alleles to the chromosome 5 coordinates surrounding the TLX3 locus. Beneath the coordinate line, the location of the SJTALL030071 translocation breakpoint is indicated. D, Two-dimensional t-SNE plot of RNA-seq–derived gene expression data from 264 T-ALL samples (41). Major T-ALL subgroups are indicated on the plot, with SJTALL030071 localizing among the TLX3 cluster, as shown by the black arrow. E, Schematic representation of an ETV6–FOXO3 fusion found in SJBALL030052 joining the N-terminal region to the ETV6 sterile alpha motif domain (green) with oligomerization interfaces (red) and ETS domain (purple), with the C-terminal FOXO3 forkhead binding (green), KIX binding (purple), and transactivation domains (red). F, Two-dimensional t-SNE plot of RNA-seq–derived gene expression data from 1,988 B-ALL samples (42). Major subgroups are indicated on the plot, with SJBALL030052 localizing to the periphery of the ETV6–RUNX1 subgroup, as shown by the black arrow.
Figure 3.
Using multi-omics data to interpret pathogenicity of SVs. A, GenomePaint plots showing two regions, chr8:128500000–130600000 (top) and chr5: 170710000–170790000 (bottom) [hg19], from SJTALL030071. Both panels consist of the RefSeq gene model in green, with MYC and TLX3 highlighted by red boxes; orange bars show regions of copy-number gain supported by increased WGS coverage plotted as the blue histogram immediately below. Gray lollipops marked t(5;8) indicate the position of the translocation breakpoint. RNA-seq coverage is shown below the whole-genome coverage histogram. Additional data from NCI-TARGET are also shown, with narrow red bars representing regions of copy-number gain and gray lollipops representing SV breakpoints surrounding the TLX3 locus. A region or recurrent copy-number gain in TARGET samples is adjacent to the chromosome 8 breakpoint in SJTALL030071. Generally high but nonspecific RNA-seq coverage at this locus suggests a region of high transcriptional activity (distal MYC enhancer) is brought into proximity of TLX3 by the translocation. CNV, copy-number variation. B, A rank-order plot of T-ALL from TARGET showing expression levels of TLX3 mRNA in a set of TLX3-activated tumors compared with tumors in which TLX3 was not activated. SJTALL030071 TLX3 expression (red dot) groups with the activated set. C, Allele-specific expression (ASE) of the TLX3 locus in SJTALL030071. The tumor DNA (top row) shows a series of heterozygous alleles in the TLX3 locus (blue and red stacked bars show relative VAF from WGS data). In the RNA-seq data (second row), expression of only one allele is observed. RNA coverage, read counts at each allele, are shown numerically (third row). Beneath the read counts, black lines map the locations of the alleles to the chromosome 5 coordinates surrounding the TLX3 locus. Beneath the coordinate line, the location of the SJTALL030071 translocation breakpoint is indicated. D, Two-dimensional t-SNE plot of RNA-seq–derived gene expression data from 264 T-ALL samples (41). Major T-ALL subgroups are indicated on the plot, with SJTALL030071 localizing among the TLX3 cluster, as shown by the black arrow. E, Schematic representation of an ETV6–FOXO3 fusion found in SJBALL030052 joining the N-terminal region to the ETV6 sterile alpha motif domain (green) with oligomerization interfaces (red) and ETS domain (purple), with the C-terminal FOXO3 forkhead binding (green), KIX binding (purple), and transactivation domains (red). F, Two-dimensional t-SNE plot of RNA-seq–derived gene expression data from 1,988 B-ALL samples (42). Major subgroups are indicated on the plot, with SJBALL030052 localizing to the periphery of the ETV6–RUNX1 subgroup, as shown by the black arrow.
Figure 4. Germline variants and assessment of variant pathogenicity based on RNA data. A, Numbers of germline P/LP variants, broken down by gene and tumor type. NBL, neuroblastoma; RB, retinoblastoma. B, Proportions of germline P/LP variants, broken down by tumor type. C, BAP1 intron 4 retention in SJEWS030332 compared to other G4K Ewing sarcoma cases. Each blue histogram shows hg19-aligned RNA-seq coverage relative to the BAP1 gene model in green (note that BAP1 is on the negative strand). The position of the exon 5 splice acceptor mutation is indicated by the red dotted line. Increased read coverage in the SJEWS030332 (bearing a mutation at the -3 position of exon 5) intron relative to the three other samples indicates intron 4 retention (black arrow). Inset histograms show the relative proportion of reference and variant alleles in tumor-derived WGS and RNA-seq in gray and purple, respectively. Corresponding read counts are WGS: 32G/21T (40% variant allele) and RNA 2G/28T (93% variant allele). Above the RNA coverage plots is a schematic of the BAP1 protein with the location of the splice variant leading to protein truncation marked. D, NF1 exon 45 skipping in SJBALL030144. The blue histogram shows RNA-seq coverage relative to the NF1 gene model in green. Canonical splices are shown as light blue links between exons, and a noncanonical splice is shown in mauve. The height of mauve and blue lollipops is proportional to the number of splice junction reads detected plotted on a log scale on the y-axis. The purple bar indicates the position of the NF1 exon 45 splice acceptor mutation. Exon 45 expression is diminished relative to flanking exons, and a noncanonical splice linking exons 44 and 46 is observed, indicating an exon skipping event.
Figure 4.
Germline variants and assessment of variant pathogenicity based on RNA data. A, Numbers of germline P/LP variants, broken down by gene and tumor type. NBL, neuroblastoma; RB, retinoblastoma. B, Proportions of germline P/LP variants, broken down by tumor type. C,BAP1 intron 4 retention in SJEWS030332 compared to other G4K Ewing sarcoma cases. Each blue histogram shows hg19-aligned RNA-seq coverage relative to the BAP1 gene model in green (note that BAP1 is on the negative strand). The position of the exon 5 splice acceptor mutation is indicated by the red dotted line. Increased read coverage in the SJEWS030332 (bearing a mutation at the -3 position of exon 5) intron relative to the three other samples indicates intron 4 retention (black arrow). Inset histograms show the relative proportion of reference and variant alleles in tumor-derived WGS and RNA-seq in gray and purple, respectively. Corresponding read counts are WGS: 32G/21T (40% variant allele) and RNA 2G/28T (93% variant allele). Above the RNA coverage plots is a schematic of the BAP1 protein with the location of the splice variant leading to protein truncation marked. D,NF1 exon 45 skipping in SJBALL030144. The blue histogram shows RNA-seq coverage relative to the NF1 gene model in green. Canonical splices are shown as light blue links between exons, and a noncanonical splice is shown in mauve. The height of mauve and blue lollipops is proportional to the number of splice junction reads detected plotted on a log scale on the y-axis. The purple bar indicates the position of the NF1 exon 45 splice acceptor mutation. Exon 45 expression is diminished relative to flanking exons, and a noncanonical splice linking exons 44 and 46 is observed, indicating an exon skipping event.
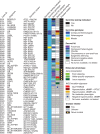
Figure 5. The impact of somatic variation in establishing disease relevance of deleterious germline variants. Each row represents a unique patient. From left to right, the columns are as follows: “Case ID” gives, the last 4 digits of the patients' IDs (compare Supplementary Table S8, column A). “Diagnosis” gives the disease code used internally (compare Supplementary Table S8, column B). Note: Matched superscripts indicate mutations in the same patient. “Germline variant” lists the gene and amino acid change. “Germline Testing Indicated” signifies patients whose cancer or other phenotypic characteristics suggested the patient and possibly the family should undergo germline testing (black tiles). “Germline genotype” gives the genotype of the variant indicated in the “Germline variant” column. “Second hit category” gives the genetic configuration of any genetic or epigenetic alterations affecting the remaining wild-type gene copy in the tumor. “Molecular phenotype” pertains to evidence in the DNA sequence of the tumor as to the activity of the germline variant. “Molecular phenotypes” includes features such as splice aberrations visible in the RNA-seq data and mutation signatures. Tumor second hits and molecular phenotype were not available for some patients due to absence or inadequate tumor for testing (see Methods). The 5 columns of tiled cells are sorted to group germline mutations by “Disease related” and then secondarily by “Germline Testing Indicated.” dMMR, deficient MMR.
Figure 5.
The impact of somatic variation in establishing disease relevance of deleterious germline variants. Each row represents a unique patient. From left to right, the columns are as follows: “Case ID” gives, the last 4 digits of the patients' IDs (compare Supplementary Table S8, column A). “Diagnosis” gives the disease code used internally (compare Supplementary Table S8, column B). Note: Matched superscripts indicate mutations in the same patient. “Germline variant” lists the gene and amino acid change. “Germline Testing Indicated” signifies patients whose cancer or other phenotypic characteristics suggested the patient and possibly the family should undergo germline testing (black tiles). “Germline genotype” gives the genotype of the variant indicated in the “Germline variant” column. “Second hit category” gives the genetic configuration of any genetic or epigenetic alterations affecting the remaining wild-type gene copy in the tumor. “Molecular phenotype” pertains to evidence in the DNA sequence of the tumor as to the activity of the germline variant. “Molecular phenotypes” includes features such as splice aberrations visible in the RNA-seq data and mutation signatures. Tumor second hits and molecular phenotype were not available for some patients due to absence or inadequate tumor for testing (see Methods). The 5 columns of tiled cells are sorted to group germline mutations by “Disease related” and then secondarily by “Germline Testing Indicated.” dMMR, deficient MMR.
Figure 6. Evaluation of germline and tumor data to establish disease relevance. A, P53 A161T is a weakly functional likely pathogenic p53 variant in SJNBL030203. Six markers, including the germline variant C>T at chr17:7578449 (demarked by upside down triangle), are represented by three rows of vertical bars. The bars are colored red and blue to show the allele fractions in WGS data. The rows indicating germline and tumor DNA show most positions as heterozygous, with both red and blue portions. In the RNA, all markers are monocolored, indicating that only one allele is expressed. At the location of the germline variant (C>T), the bar is completely red, indicating that only the variant allele is expressed, suggesting that the wild-type allele is transcriptionally silenced. ASE, allele-specific expression. B, A pathogenic MUTYH germline founder mutation, G396D, in retinoblastoma patient SHRB030050. C, The TMB for SHRB030050, from WGS data, is in the upper quartile compared with other retinoblastoma patients, including those from St. Jude Cloud. Box includes the second to third quartiles; horizontal bar within box is median. D, Mutation signatures from WGS data from retinoblastoma patients available in G4K and from the PCGP in the St. Jude Cloud resource (https://www.stjude.cloud/). Sixty percent of tumor mutations in SHRB030050 are attributable to damage by ROS. E, TMB plots of brain and hematologic tumors. The three tumors that are hypermutated (those with >10 mutations/Mb) are labeled with patient ID and the genes that were mutated to cause hypermutation. A fourth brain tumor with a TMB close to median was heterozygous for mutation of PMS2. The two hypermutated patients with PMS2 carried compound heterozygous mutation of the gene. The patient with the highest TMB also carried an S459F mutation of POLE. F, Mutation signatures of the patients in E. G, IHC staining for the indicated MMR proteins in the brain tumors of patients SJHGG030336 and SJBT030067. Top, infiltrative astrocytoma with severe cytologic atypia, mitotic activity, and necrosis, diagnostic of glioblastoma. IHC for MMR proteins exhibited loss of MSH2 and MSH6 but retained staining in stromal elements. Bottom, gastrointestinal-type adenocarcinoma arising in malignant mixed germ cell tumor. Staining for MMR proteins demonstrated retained expression of MSH2, MSH6, PMS2, and MLH1. All images are 40× magnification; scale bars, 40 μm.
Figure 6.
Evaluation of germline and tumor data to establish disease relevance. A, P53 A161T is a weakly functional likely pathogenic p53 variant in SJNBL030203. Six markers, including the germline variant C>T at chr17:7578449 (demarked by upside down triangle), are represented by three rows of vertical bars. The bars are colored red and blue to show the allele fractions in WGS data. The rows indicating germline and tumor DNA show most positions as heterozygous, with both red and blue portions. In the RNA, all markers are monocolored, indicating that only one allele is expressed. At the location of the germline variant (C>T), the bar is completely red, indicating that only the variant allele is expressed, suggesting that the wild-type allele is transcriptionally silenced. ASE, allele-specific expression. B, A pathogenic MUTYH germline founder mutation, G396D, in retinoblastoma patient SHRB030050. C, The TMB for SHRB030050, from WGS data, is in the upper quartile compared with other retinoblastoma patients, including those from St. Jude Cloud. Box includes the second to third quartiles; horizontal bar within box is median. D, Mutation signatures from WGS data from retinoblastoma patients available in G4K and from the PCGP in the St. Jude Cloud resource (https://www.stjude.cloud/). Sixty percent of tumor mutations in SHRB030050 are attributable to damage by ROS. E, TMB plots of brain and hematologic tumors. The three tumors that are hypermutated (those with >10 mutations/Mb) are labeled with patient ID and the genes that were mutated to cause hypermutation. A fourth brain tumor with a TMB close to median was heterozygous for mutation of PMS2. The two hypermutated patients with PMS2 carried compound heterozygous mutation of the gene. The patient with the highest TMB also carried an S459F mutation of POLE.F, Mutation signatures of the patients in E. G, IHC staining for the indicated MMR proteins in the brain tumors of patients SJHGG030336 and SJBT030067. Top, infiltrative astrocytoma with severe cytologic atypia, mitotic activity, and necrosis, diagnostic of glioblastoma. IHC for MMR proteins exhibited loss of MSH2 and MSH6 but retained staining in stromal elements. Bottom, gastrointestinal-type adenocarcinoma arising in malignant mixed germ cell tumor. Staining for MMR proteins demonstrated retained expression of MSH2, MSH6, PMS2, and MLH1. All images are 40× magnification; scale bars, 40 μm.
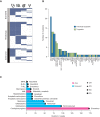
Figure 7. Clinically actionable findings. A, Tile plot summarizing clinically actionable findings in the 253 patients who had both tumor and normal tissues sequenced. Each tumor is represented as a row and is grouped according to major tumor type. Columns represent the presence (blue) or absence (white) of a diagnostic (stethoscope), prognostic (patient chart), therapeutically relevant (target), or cancer-predisposing mutation (pedigree). B, Tumors with targetable (tiers 1 and 2, green) or potentially targetable (blue) lesions, categorized by the affected gene, identified by the three-platform sequencing approach. Additional information can be found in Supplementary Tables S2 and S10. C, Swimmer plot depicting patients receiving a targeted therapy matched to their tumor genetic lesion. Each bar is 1 patient, with the disease as labeled. Pink bars, patient is alive; blue bars, patient is deceased. Best response on the targeted therapy is as labeled: CR, complete response; PD, progressive disease; PR, partial response; SD stable disease. The drugs used are labeled adjacent to each bar. See Supplementary Table S11 for further details. MPAL, mixed phenotype acute leukemia.
Figure 7.
Clinically actionable findings. A, Tile plot summarizing clinically actionable findings in the 253 patients who had both tumor and normal tissues sequenced. Each tumor is represented as a row and is grouped according to major tumor type. Columns represent the presence (blue) or absence (white) of a diagnostic (stethoscope), prognostic (patient chart), therapeutically relevant (target), or cancer-predisposing mutation (pedigree). B, Tumors with targetable (tiers 1 and 2, green) or potentially targetable (blue) lesions, categorized by the affected gene, identified by the three-platform sequencing approach. Additional information can be found in Supplementary Tables S2 and S10. C, Swimmer plot depicting patients receiving a targeted therapy matched to their tumor genetic lesion. Each bar is 1 patient, with the disease as labeled. Pink bars, patient is alive; blue bars, patient is deceased. Best response on the targeted therapy is as labeled: CR, complete response; PD, progressive disease; PR, partial response; SD stable disease. The drugs used are labeled adjacent to each bar. See Supplementary Table S11 for further details. MPAL, mixed phenotype acute leukemia.

Comment in

  • doi: 10.1158/2159-8290.CD-11-12-ITI

References

    1. Chang W, Brohl AS, Patidar R, Sindiri S, Shern JF, Wei JSet al. MultiDimensional ClinOmics for precision therapy of children and adolescent young adults with relapsed and refractory cancer: a report from the center for cancer research. Clin Cancer Res 2016;22:3810–20. - PMC - PubMed
    1. Kline CN, Joseph NM, Grenert JP, van Ziffle J, Talevich E, Onodera Cet al. Targeted next-generation sequencing of pediatric neuro-oncology patients improves diagnosis, identifies pathogenic germline mutations, and directs targeted therapy. Neuro Oncol 2017;19:699–709. - PMC - PubMed
    1. Oberg JA, Glade Bender JL, Sulis ML, Pendrick D, Sireci AN, Hsiao SJet al. Implementation of next generation sequencing into pediatric hematology-oncology practice: moving beyond actionable alterations. Genome Med 2016;8:133. - PMC - PubMed
    1. Parsons DW, Roy A, Yang Y, Wang T, Scollon S, Bergstrom Ket al. Diagnostic yield of clinical tumor and germline whole-exome sequencing for children with solid tumors. JAMA Oncol 2016;2:616–24. - PMC - PubMed
    1. Surrey LF, MacFarland SP, Chang F, Cao K, Rathi KS, Akgumus GTet al. Clinical utility of custom-designed NGS panel testing in pediatric tumors. Genome Med 2019;11:32. - PMC - PubMed

Publication types