. 2021 Jul 23;6(61):eabg5003.
doi: 10.1126/sciimmunol.abg5003.

Pax5 regulates B cell immunity by promoting PI3K signaling via PTEN down-regulation

Affiliations

Pax5 regulates B cell immunity by promoting PI3K signaling via PTEN down-regulation

Lesly Calderón et al. Sci Immunol. .

Abstract

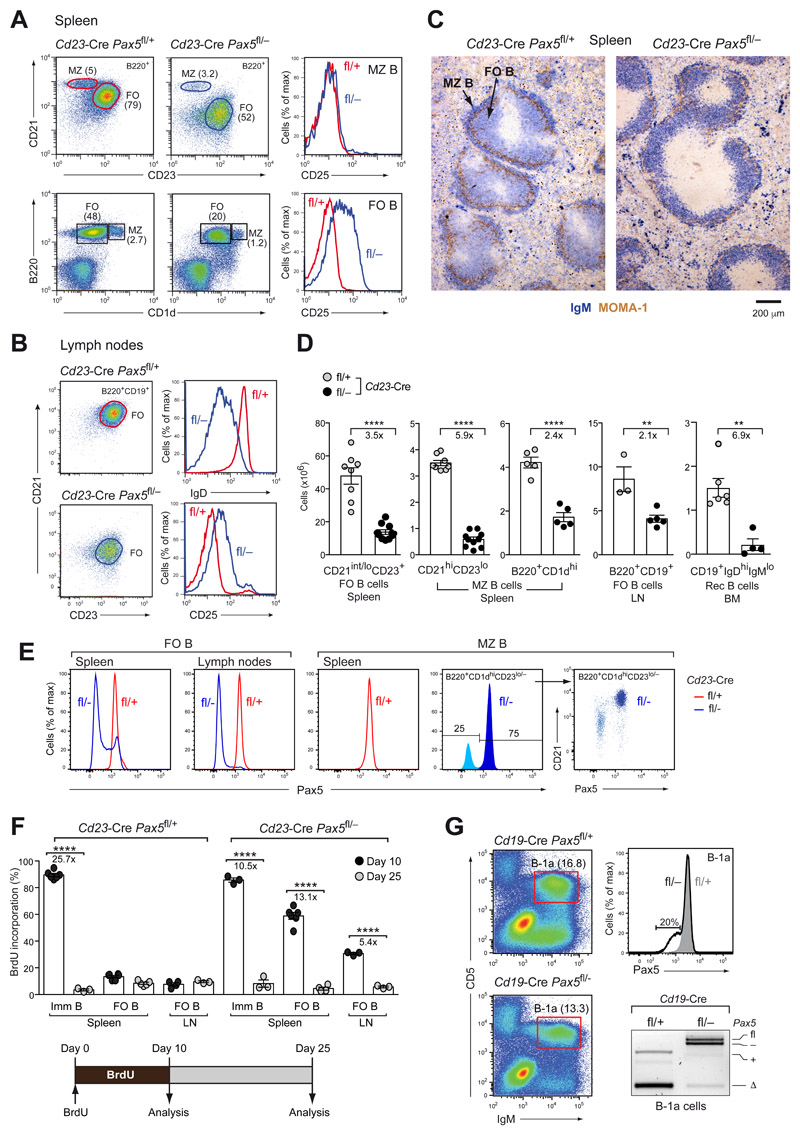
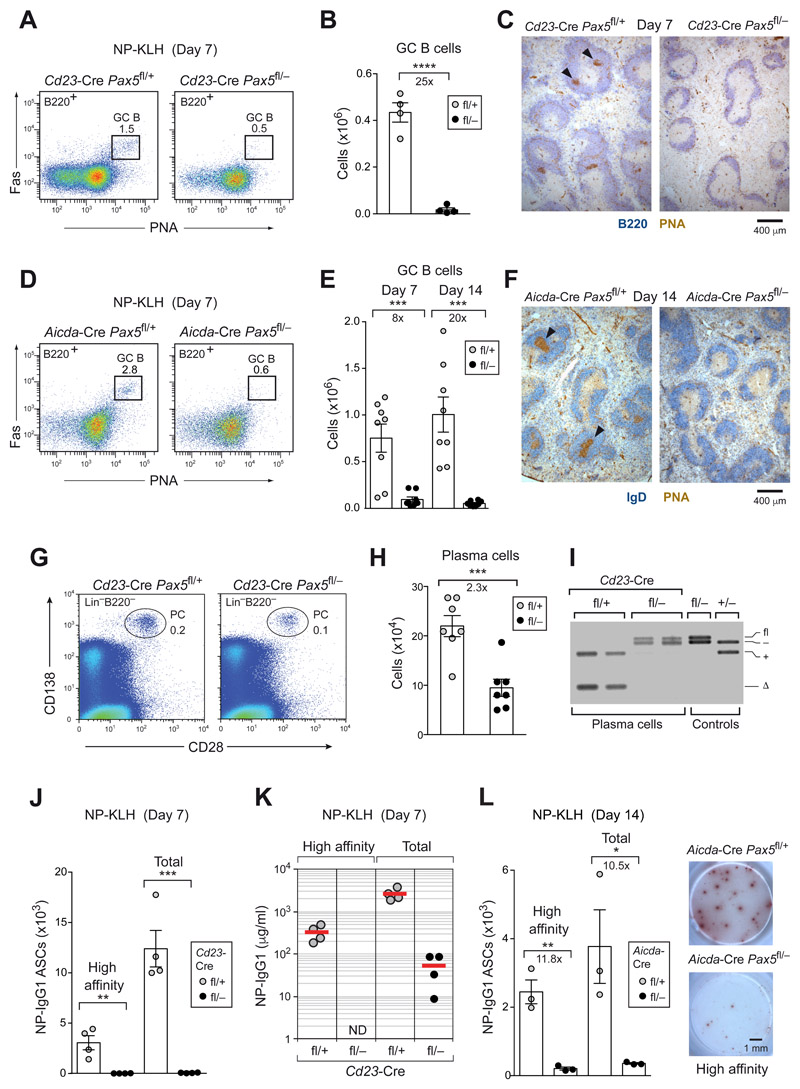
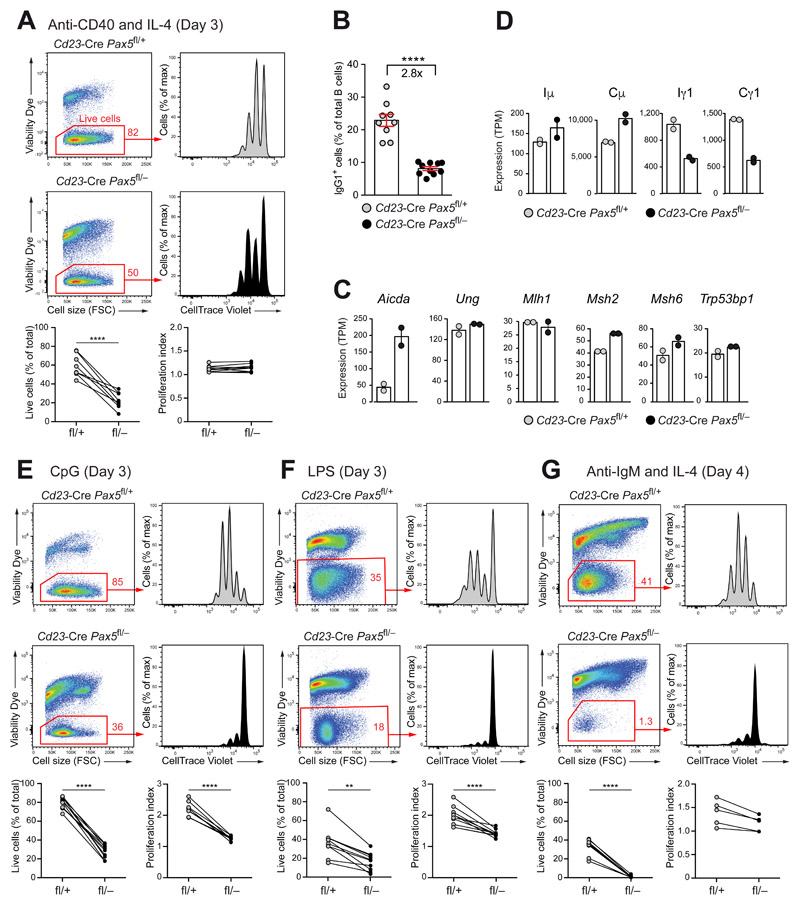
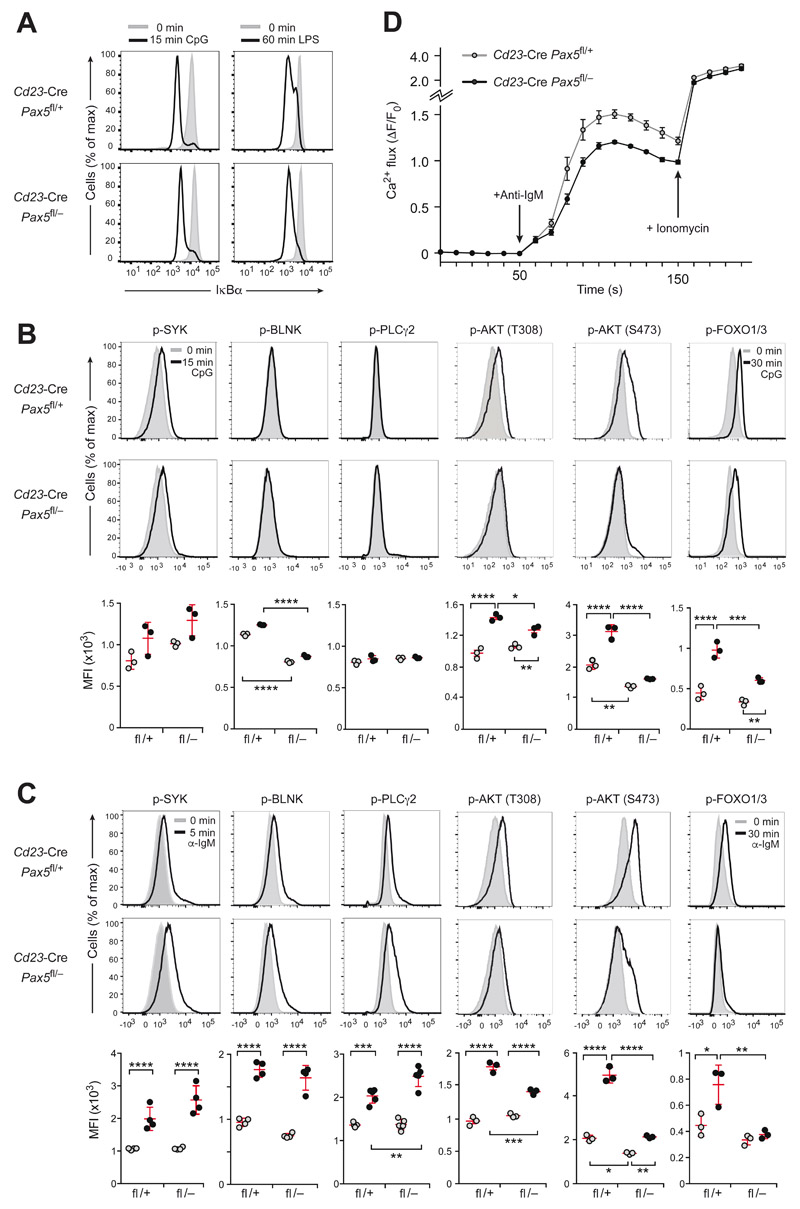
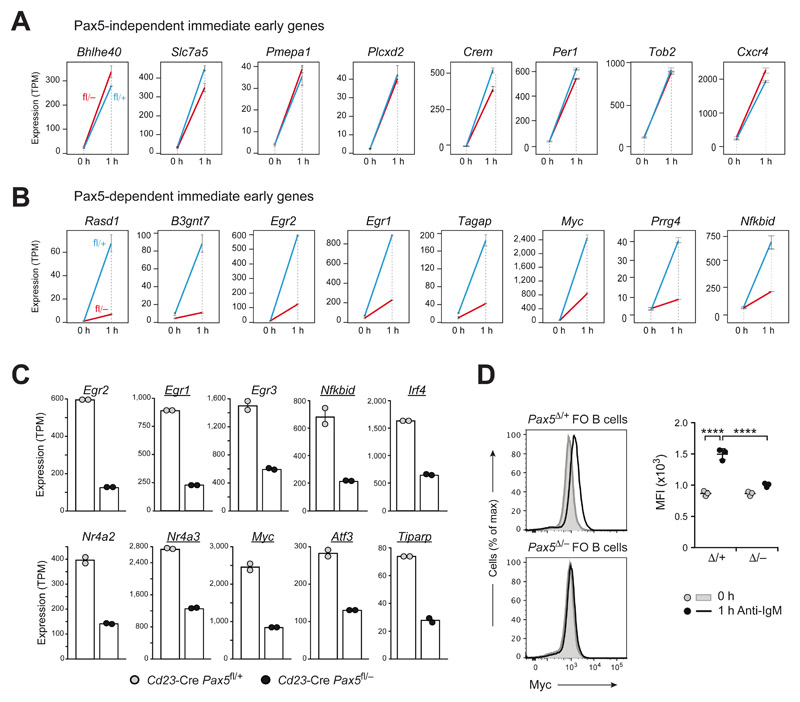
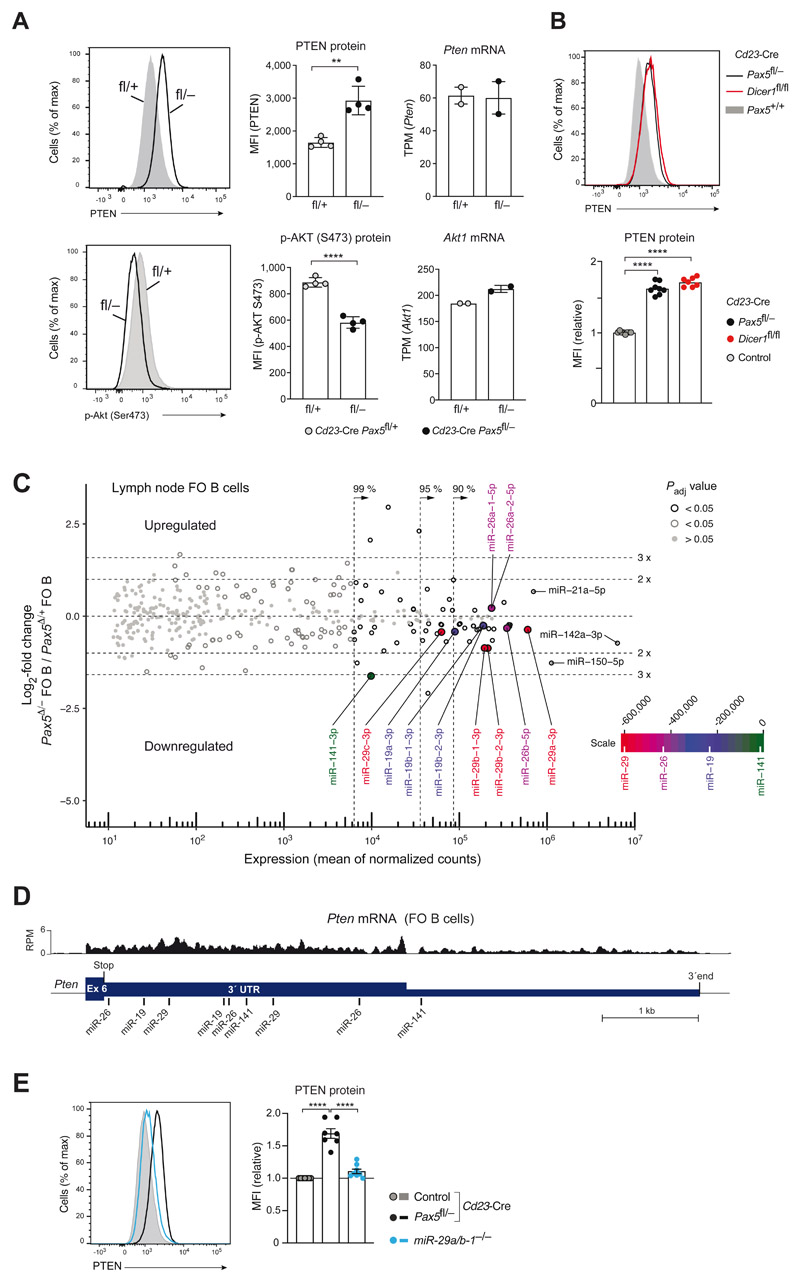
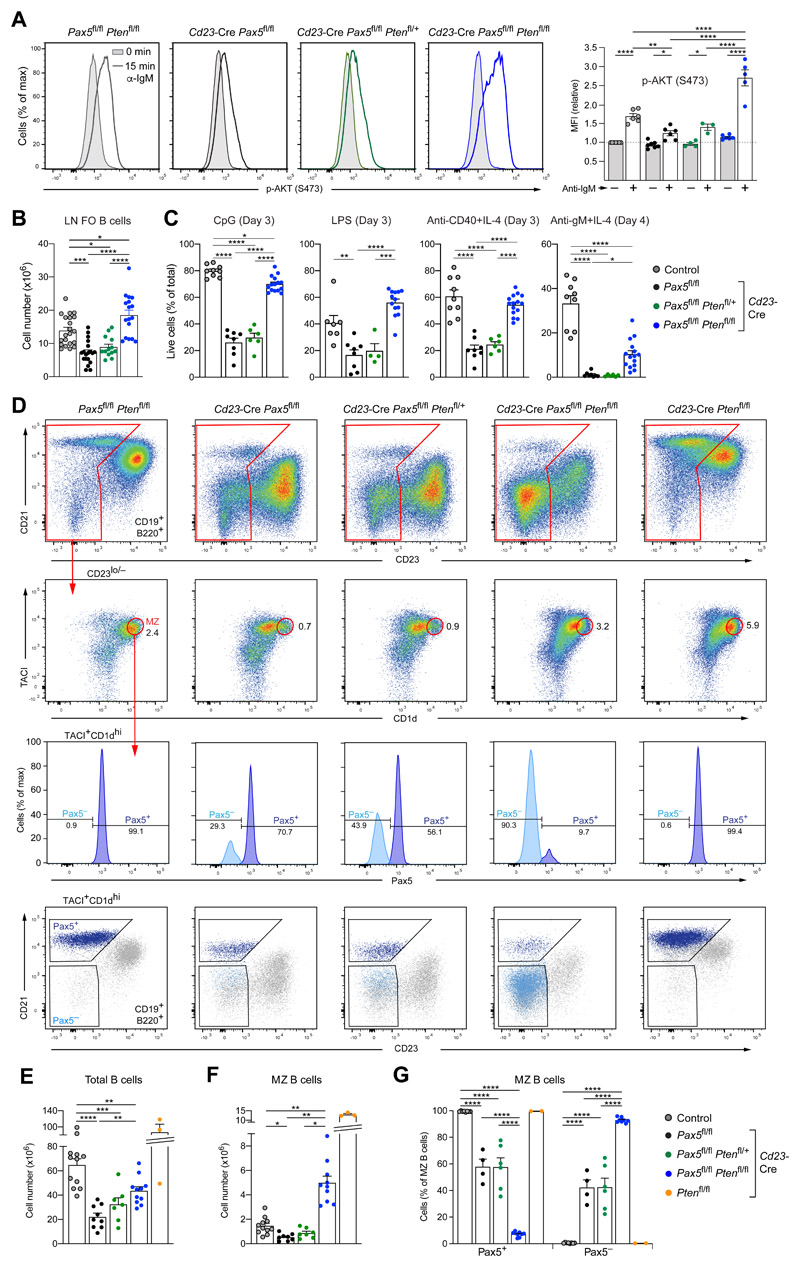
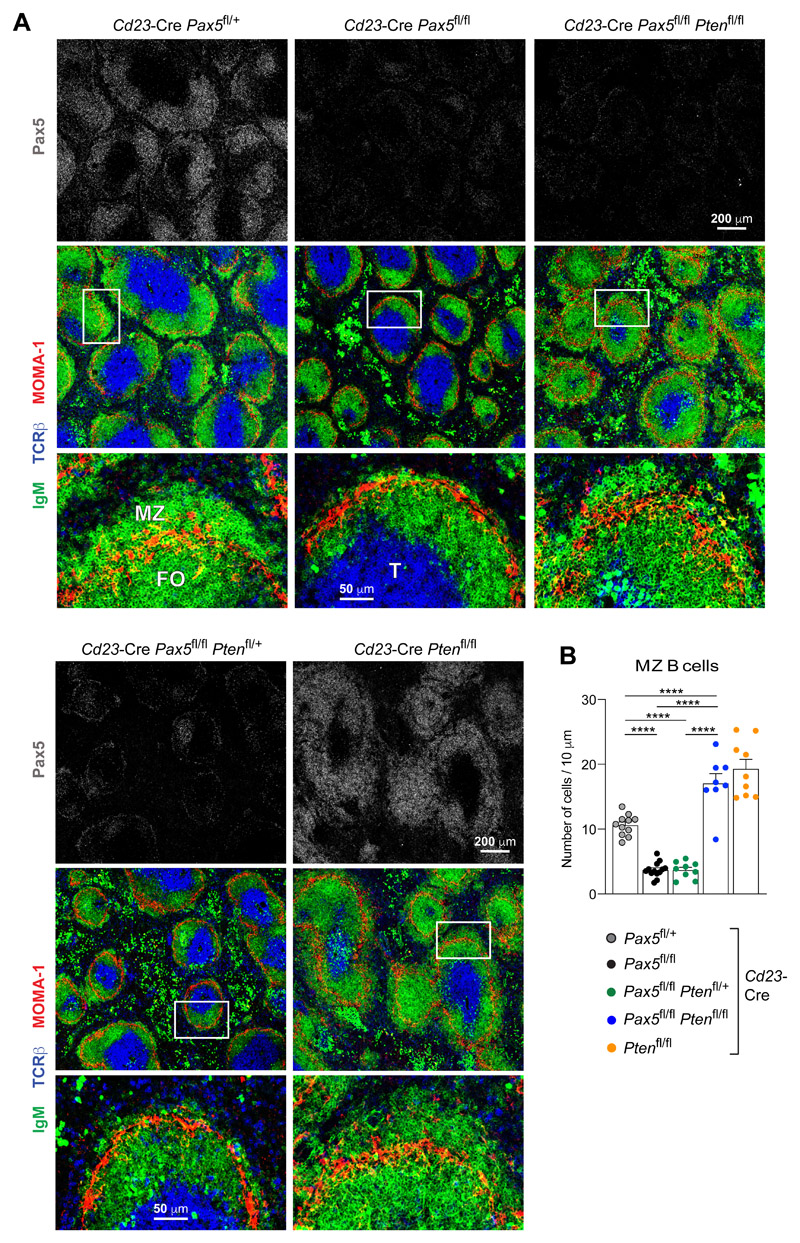
The transcription factor Pax5 controls B cell development, but its role in mature B cells is largely enigmatic. Here, we demonstrated that the loss of Pax5 by conditional mutagenesis in peripheral B lymphocytes led to the strong reduction of B-1a, marginal zone (MZ), and germinal center (GC) B cells as well as plasma cells. Follicular (FO) B cells tolerated the loss of Pax5 but had a shortened half-life. The Pax5-deficient FO B cells failed to proliferate upon B cell receptor or Toll-like receptor stimulation due to impaired PI3K-AKT signaling, which was caused by increased expression of PTEN, a negative regulator of the PI3K pathway. Pax5 restrained PTEN protein expression at the posttranscriptional level, likely involving Pten-targeting microRNAs. Additional PTEN loss in Pten,Pax5 double-mutant mice rescued FO B cell numbers and the development of MZ B cells but did not restore GC B cell formation. Hence, the posttranscriptional down-regulation of PTEN expression is an important function of Pax5 that facilitates the differentiation and survival of mature B cells, thereby promoting humoral immunity.


Conflict of interest statement

Competing interests: The authors declare that they have no competing interests.

Figures

Figure 1
Figure 1. Loss of mature B cell types upon Pax5 inactivation.
(A,B) Flow-cytometric analysis of MZ B (B220+CD21hiCD23lo/−) and FO B (B220+CD21int/loCD23hi) cells from the spleen (A) and FO B cells from lymph nodes (B) of Cd23-Cre Pax5 fl/− (fl/–) and Cd23-Cre Pax5 fl/+ (fl/+) mice. The percentages of cells in each gate are indicated. (C) Staining of spleen sections for MOMA-1 (brown) and IgM (blue) expression. (D) Absolute numbers of the indicated cell types in the spleen, lymph nodes (LN) and bone marrow (BM) of Cd23-Cre Pax5 fl/+ mice (gray dots) and Cd23-Cre Pax5 fl/− mice (black dots). (E) Intracellular Pax5 staining of FO B and MZ B (CD19+B220+CD 1dhiCD23lo/−) cells. (F) BrdU labeling of splenic immature and FO B cells and lymph node FO B cells of 2-month-old Cd23-Cre Pax5 fl/+ and Cd23-Cre Pax5 fl/− mice. BrdU+ B cells were identified by flow cytometry after 10 days of BrdU labeling (black dots) or after a subsequent 15-day chase period (gray dots) without BrdU in the drinking water (Fig. S1C), as shown by the diagram below. (G) Flow-cytometric analysis of B-1a cells (IgMhiCD5+) from the peritoneum of Cd19-Cre Pax5 fl/− (fl/–; black) and Cd19-Cre Pax5 fl/+ (fl/+; gray) mice. Upper right: Intracellular Pax5 staining of B-1a cells. The percentage of Cd19-Cre Pax5 fl/− B-1a cells with reduced Pax5 expression is shown. Lower right: PCR analysis of the deletion of the floxed Pax5 allele in B-1a cells (IgMhiCD5+). PCR fragments corresponding to the deleted (Δ) or intact (fl) floxed Pax5 allele and the wild-type (+) or null (–) Pax5 allele are indicated. Statistical data (D, F) are shown as mean value with SEM and were analyzed by two-tailed unpaired Student’s t-test (D) or two-way ANOVA with Šídák’s multiple comparison test (F); **P < 0.01, ****P < 0.0001. Each dot represents one mouse.
Figure 2
Figure 2. The initiation and maintenance of GC B cell differentiation depended on Pax5.
(A-C) GC B cell differentiation in the spleen of Cd23-Cre Pax5 fl/+ (fl/+; gray dots) and Cd23-Cre Pax5 fl/− (fl/–; black dots) mice at day 7 after immunization with NP-KLH (in alum). Absolute numbers of GC B cells (B220+Fas+PNA+) were determined by flow cytometry (A,B), and PNA+ GC B cells were visualized by staining of spleen sections for PNA (brown) and B220 (blue) expression (C). Arrowheads indicate GCs. (D-F) GC B cell differentiation in the spleen of Aicda-Cre Pax5 fl/+ and Aicda-Cre Pax5 fl/− mice at day 7 and 14 after immunization with NP-KLH (in alum) was analyzed, as described above. (G-I) Flow-cytometric analysis of plasma cells (CD28+CD138+Lin) from the bone marrow (femur and tibia of hind legs) of non-immunized Cd23-Cre Pax5 fl/+ and Cd23-Cre Pax5 fl/− mice (G,H). PCR determination of Pax5 exon 2 deletion in sorted plasma cells (I), as described in Fig. 1G. (J-L) T cell-dependent immune responses. Pax5 fl/+ and Pax5 fl/− mice carrying Cd23-Cre (J) or Aicda-Cre (L) were immunized with NP-KLH (in alum) and analyzed at the indicated days after immunization by ELISPOT assay to determine NP-specific IgG1 antibody-secreting cells (ASCs) in the spleen. NP4-BSA- or NP23-BSA-coated plates were used for detecting ASCs secreting high-affinity or total anti-NP-IgG1 antibodies, respectively. Representative ELISPOT images are shown. (K) ELISA analysis of serum titers of NP-specific IgG1 antibodies using NP7-BSA- or NP30-BSA-coated plates. ND, not detected. Statistical data (B,E,H,J,L) are shown as mean value with SEM and were analyzed by the two-tailed unpaired Student’s t-test; *P < 0.05; ***P < 0.001 and ****P < 0.0001. Each dot represents one mouse.
Figure 3
Figure 3. Pax5 controlled B cell proliferation in response to BCR and TLR signaling.
(A,B) Proliferation and IgG1 CSR response to anti-CD40 plus IL-4 stimulation. CellTrace Violet-labeled FO B cells from lymph nodes of Cd23-Cre Pax5 fl/− (fl/–; black) and Cd23-Cre Pax5 fl/+ (fl/+; gray) mice were stimulated with anti-CD40 and IL-4 for 3 (A) or 4 (B) days and then stained with the Viability Dye eFluor 780. The cell viability and proliferation index of the stimulated cells (A) and the percentage of IgG1+ B cells (B) were determined by flow-cytometric analysis. Lines connect the results obtained with Pax5-deficient and control B cells in the same stimulation experiment. (C,D) Gene expression in lymph node B cells stimulated with anti-CD40 and IL-4 for 2 days, as determined by RNA-seq (Fig. S3E). The expression of selected genes involved in CSR (C) and the abundance of germline transcripts at the Iμ and Ig1 exons and transcripts at the Cμ and Cg1 exons (D) are shown as mean expression value (TPM, transcripts per million) with SEM based on two independent RNA-seq experiments per genotype. (E-G) Stimulation of lymph node FO B cells of the indicated genotypes with CpG oligodeoxynucleotides (E) and LPS (F) for 3 days or with anti-IgM and IL-4 (G) for 4 days, as described (A). The data (A,E,F,G) were statistically analyzed by the two-tailed unpaired Student’s test: **P < 0.01, ****P < 0.0001. Each dot represents one mouse.
Figure 4
Figure 4. Intracellular signaling upon TLR9 and BCR activation in Pax5-deficient FO B cells.
(A) IκBα degradation upon TLR signaling. The IkBa protein amount was determined by intracellular staining of CD43 FO B cells from lymph nodes of Cd23-Cre Pax5 fl/− or control Cd23-Cre Pax5 fl/+ mice before (gray surface) and after (black line) stimulation for 15 min with CpG oligodeoxynucleotides or for 60 min with LPS. (B,C) Intracellular TLR9 and BCR signaling. The phosphorylation (p-) status of signal transducers of the calcium and PI3K signaling pathways (Fig. S4A) was determined in lymph node FO B cells of the indicated genotypes before or after stimulation with CpG oligodeoxynucleotides for 15 min (B) or stimulation with anti-IgM for 5 min (C) except for a 30-min stimulation with either stimuli for analyzing p-FOXO1,3. (B,C). Flow cytometry (top and middle) was performed with antibodies specific for p-AKT (p-Thr308) p-AKT (p-Ser473), p-BLNK (p-Tyr84), p-PLCγ2 (p-Tyr759), p-SYK (p-Tyr525/526) and p-FOXO1 (p-Thr24)/p-FOXO3 (p-Thr32). Bottom, the median fluorescence intensity (MFI) for untreated (gray dots) and stimulated (black dots) FO B cells of the indicated genotypes is shown. Statistical data are indicated as mean value with SEM and were analyzed by two-way ANOVA with Tukey’s multiple comparison test; *P < 0.05, **P < 0.01, ***P < 0.001, ****P < 0.0001. Each dot represents one mouse. One of at least three experiments is shown. (D) Calcium mobilization in response to BCR signaling. Intracellular Ca2+ fluxes in CD43 FO B cells from lymph nodes of the indicated genotypes were recorded as an increase of the fluorescent emission of a Ca2+ sensor dye after addition of anti-IgM (arrow, after 50 s) or ionomycin (arrow, after 150 s) and are presented as ΔF/F0 (F0, average fluorescence before antibody addition; ΔF, fluorescence at time ‘t’ - F0). Mean values with SEM are shown for 3 independent experiments.
Figure 5
Figure 5. Activation of immediate-early genes in response to BCR signaling.
(A,B) Pax5-independent (A) and Pax5-dependent (B) immediate-early genes that were induced > 9-fold upon anti-IgM stimulation in control FO B cells and were further defined, as described in Fig. S5D-F and the Materials and Methods. The expression of activated genes in Cd23-Cre Pax5 fl/+ (fl/+; blue) and Cd23-Cre Pax5 fl/− (fl/–; red) FO B cells before (0 h) and after (1 h) of anti-IgM stimulation is shown as mean expression value (TPM) with SEM based on two independent RNA-seq experiments for each genotype and treatment condition. (C) mRNA expression of Pax5-dependent immediate-early genes, coding for known transcription factors, is shown for FO B cells of the indicated genotypes after 1 h of anti-IgM stimulation. Genes bound by Pax5 (12) are underlined. (D) Intracellular Myc staining of Cd23-Cre Pax5 fl/+ (Pax5 Δ/+) and Cd23-Cre Pax5 fl/− (Pax5 Δ/−) FO B cells before (gray) and after (black) stimulation for 1 h with anti-IgM (left). Myc expression (right) is shown as mean MFI value with SEM and was analyzed by twoway ANOVA with Tukey’s multiple comparison test; ****P < 0.0001. Each dot represents one mouse.
Figure 6
Figure 6. Pax5 downregulated PTEN expression by controlling the abundance of Pten-targeting microRNAs.
(A) PTEN protein expression and phosphorylation of AKT (Ser473) in unstimulated lymph node FO B cells of Cd23-Cre Pax5 fl/− (back) and Cd23-Cre Pax5 fl/+ (gray) mice, as determined by intracellular staining (left) and MFI quantification (middle). Pten and Akt1 mRNA expression in the same FO B cell types (right) is shown as mean expression value (TPM) with SEM, as determined by RNA-seq. (B) PTEN expression in lymph node FO B cells of Cd23-Cre Dicer1 fl/fl (red), Cd23-Cre Pax5 fl/− (black) and Cd23-Cre Pax5 +/+ (gray) mice, as determined by intracellular staining and quantification of the MFI values relative to the control genotypes (Cd23-Cre Pax5 +/+ Dicer1 +/+, Pax5+/+ Dicer1 +/+, Pax5 fl/+ Dicer1 +/+, Pax5 +/+ Dicer1 fl/+ or Pax5+/+ Dicer1 fl/fl). (C) MA plot of miRNA expression differences between Cd23-Cre Pax5 fl/− (Pax5 Δ/−) and Cd23-Cre Pax5 fl/+ (Pax5 Δ/+) FO B cells, which were isolated from lymph nodes as CD23+ cells by immunomagnetic sorting. Two small-RNA-seq experiments per genotype were performed. The abundance of individual miRNAs in the two B cell types is plotted as mean value of the normalized counts versus the log2-fold change in abundance between Pax5 Δ/− and Pax5 Δ/+ FO B cells (Table S4 and S6). Dotted lines indicate the area containing 99%, 95% or 90% of the total normalized counts. The statistical significance of the observed differences is indicated by gray and black circles (P value < 0.05) or gray dots (P value > 0.05). Adjusted P values were determined by DESeq2. Each symbol represents one miRNA species. Pten-targeting miRNAs are highlighted by the color corresponding to their position on the scale bar, which was generated by multiplying the sum of the normalized read counts of all members of a miRNA family with the total context+/+ score of the miRNA family (Table S5). (D) Location of the target sites of the indicated miRNAs in the 3’UTR of the mouse Pten mRNA, as predicted by the TargetScanMouse algorithm (v7.2; targetscan.org; (37)). The mRNA-seq profile of Pten exon 6 in control FO B cells is shown. (E) PTEN expression in unstimulated lymph node FO B cells of miR-29a/b-1 −/− (blue), Cd23-Cre Pax5 fl/− (back) and control Cd23-Cre Pax5 fl/+ (gray) mice, as determined by intracellular staining (left) and quantification of the MFI values (right) relative to control FO B cells (Cd23-Cre Pax5 +/+, Cd23-Cre Pax5 fl/+, Pax5 +/+ or Pax5 fl/fl). Statistical data (A,B,E) are shown as mean value with SEM and were statistically analyzed by the two-tailed unpaired Student’s t-test (A) or by one-way ANOVA with Tukey’s multiple comparison test (B,E): **P < 0.01, ****P < 0.0001.
Figure 7
Figure 7. Loss of PTEN rescued PI3K signaling, FO B and MZ B cell numbers in Pax5 mutant mice.
(A) Rescue of PI3K signaling. CD43 FO B cells from lymph nodes of Cd23-Cre Pax5 fl/fl (black), Cd23-Cre Pax5 fl/fl Pten fl/+ (green), Cd23-Cre Pax5 fl/fl Pten fl/fl (blue) and control Pax5 fl/fl Pten fl/fl (gray) mice were either left untreated (gray surface) or stimulated (colored line) for 15 min with anti-IgM prior to intracellular staining with an anti p-AKT (Ser473) antibody (left). Quantification of the MFI values relative to the unstimulated FO B cells of the control genotype is shown to the right. (B,C) Rescue of the FO B cell survival before and after stimulation. FO B cells from lymph nodes (LN) of the indicated genotypes were analyzed directly ex vivo (B) or after stimulation (C) with CpG oligodeoxynucleotides, LPS, anti-CD40 and IL-4 or anti-IgM and IL-4 for the indicated days prior to staining with the Viability Dye eFluor™ 780. The frequency of viable B cells is plotted. (D) Flow-cytometric analysis of MZ B cells in the spleen of the indicated genotypes. MZ B cells were identified as CD19+B220+CD23lo/−TACI+CD1dhi cells and analyzed for Pax5 protein expression by intracellular staining. As shown by backgating, the Pax5+ MZ B cells expressed CD21, whereas the Pax5 MZ B cells lost CD21 expression. (E-G) Statistical analysis indicating the number of total B cells (E) and MZ B cells (F) as well as the relative frequency of Pax5+ and Pax5 MZ B cells (G) in the spleen of mice of the five indicated genotypes. Statistical data are shown as mean value with SEM and were analyzed by two-way ANOVA with Šídák’s multiple comparison test (A) or one-way (B,C,E,F) or two-way (G) ANOVA with Tukey’s multiple comparison test; *P < 0.05, **P < 0.01, ***P < 0.001, ****P < 0.0001. Each dot represents one mouse. The control genotypes (A,B,E,F,G) were Pax5 fl/fl Pten fl/fl, Pax5 fl/fl Pten fl/+, Pax5 fl/fl Pten +/+ or Cd23-Cre Pax5 fl/+ Pten +/+.
Figure 8
Figure 8. Rescue of MZ B cell development in Pten,Pax5 double-mutant mice.
(A) Immunohistological analysis of spleen sections from 12-week-old mice of the indicated genotypes. The sections were stained with antibodies detecting IgM (green), MOMA-1 (red), TCRβ (blue) and Pax5 (gray). Selected areas (boxed) of B cell follicles are shown at higher magnification. T, FO B and MZ B cell zones are indicated. One of three experiments is shown. (B) Quantification of the MZ B cells on histological sections. The average number of IgM+ B cells outside of the MOMA-1+ macrophage ring was determined per 10 μm length of the perimeter of the MOMA-1+ ring (see Methods). Each dot represents the measurement of one follicle. The mean values determined for the indicated genotypes is shown with SEM and were analyzed by one-way ANOVA with Tukey’s multiple comparison test; ****P < 0.0001.

References

    1. Bassing CH, Swat W, Alt FW. The mechanism and regulation of chromosomal V(D)J recombination. Cell. 2002;109:S45–S55. - PubMed
    1. Baumgarth N. The double life of a B-1 cell: self-reactivity selects for protective effector functions. Nat Rev Immunol. 2011;11:34–46. - PubMed
    1. Cerutti A, Cols M, Puga I. Marginal zone B cells: virtues of innate-like antibody-producing lymphocytes. Nat Rev Immunol. 2013;13:118–132. - PMC - PubMed
    1. Chaudhuri J, Alt FW. Class-switch recombination: interplay of transcription, DNA deamination and DNA repair. Nat Rev Immunol. 2004;4:541–552. - PubMed
    1. Victora GD, Nussenzweig MC. Germinal centers. Annu Rev Immunol. 2012;30:429–457. - PubMed

Publication types