. 2021 Aug 20;373(6557):eabc6506.
doi: 10.1126/science.abc6506. Epub 2021 Jul 22.

A DNA repair pathway can regulate transcriptional noise to promote cell fate transitions

Affiliations

A DNA repair pathway can regulate transcriptional noise to promote cell fate transitions

Ravi V Desai et al. Science. .

Abstract

Stochastic fluctuations in gene expression ("noise") are often considered detrimental, but fluctuations can also be exploited for benefit (e.g., dither). We show here that DNA base excision repair amplifies transcriptional noise to facilitate cellular reprogramming. Specifically, the DNA repair protein Apex1, which recognizes both naturally occurring and unnatural base modifications, amplifies expression noise while homeostatically maintaining mean expression levels. This amplified expression noise originates from shorter-duration, higher-intensity transcriptional bursts generated by Apex1-mediated DNA supercoiling. The remodeling of DNA topology first impedes and then accelerates transcription to maintain mean levels. This mechanism, which we refer to as "discordant transcription through repair" ("DiThR," which is pronounced "dither"), potentiates cellular reprogramming and differentiation. Our study reveals a potential functional role for transcriptional fluctuations mediated by DNA base modifications in embryonic development and disease.


Conflict of interest statement

Competing interests: The authors declare no competing interests.

Figures

Fig. 1.
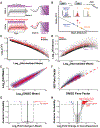
Fig. 1.. Genome-wide amplification of cell-to-cell mRNA variability (noise) independently of mean.
(A) (Left) Monte Carlo simulations of the two-state random-telegraph model of transcription showing low-noise and higher-noise trajectories with matched mean expression levels. Coefficient of variation (σ22, CV2) quantifies magnitude of fluctuations. (Right) Predicted facilitation of state transitions through dithering. (B) (Top) Schematic of two-state random-telegraph model of transcription. (Bottom) Schematic of mean versus CV2 for mRNA abundance. Solid gray line indicates Poisson, inverse scaling of CV2 as a function of mean. The question mark symbolizes unknown noise control mechanisms that amplify fluctuations independently of mean. Histograms depict expected shift in mRNA copy number distributions. (C to F) scRNA-seq of mESCs treated with DMSO (black) or 10 μM IdU (red) for 24 hours. A total of 812 and 744 transcriptomes from DMSO and IdU treatments, respectively, were analyzed. (C) Mean expression versus CV2 and (D) mean versus variance. Four examples of housekeeping genes (purple) demonstrate how IdU increases expression fluctuations with minimal change in mean (white arrows). (E and F) Mean expression (E) and Fano factor (F) (σ2/μ) of genes in DMSO versus IdU treatments. (G and H) BASiCS analysis of scRNA-seq data. (G) Fold change in mean versus certainty (posterior probability) that a gene is up- or down-regulated. With IdU treatment, 113 genes (red) were classified as differentially expressed (more than a twofold change in mean with >85% probability). (H) Fold change in overdispersion versus certainty (posterior probability) that gene is highly or lowly variable. A total of 945 genes (red) were classified as highly variable (>1.5-fold change in overdispersion with >85% probability).
Fig. 2.
Fig. 2.. Amplification of mRNA noise is not caused by extrinsic sources, results from shorter but more intense transcriptional bursts, and propagates to protein levels.
(A) Pearson correlations of expression for gene pairs in scRNA-seq dataset. Hierarchical clustering reveals networks of genes (highlighted in black rectangles) sharing similar correlation patterns. Dashed rectangle highlights network enriched with pluripotency factors such as Nanog. (B to D) Results of smRNA-FISH used to count nascent and mature Nanog mRNA in Nanog-GFP mESCs treated with DMSO or 10 μM IdU for 24 hours in 2i/LIF medium. Data are from four biological replicates. (B) (Left) Representative micrograph (maximum intensity projection) of mESCs with DAPI staining in which Nanog transcripts are labeled with probe set for eGFP. Bright foci correspond to TCs as verified by intron probe set. Scale bar, 5 μm. (Right) Distributions of mature Nanog transcripts per cell. Dashed lines represent mean. Averaged Fano factors over all four replicates are reported (±SD), *P = 0.0011, two-tailed, unpaired Student’s t test. (C) Fraction of possible TCs that are active as detected by overlap of signal in exon and intron probe channels. Each cell is assumed to have two possible TCs. Data represent mean ± SD, **P = 6.9 × 10⁻⁵, two-tailed, unpaired Student’s t test. (D) Distributions of nascent Nanog mRNA per TC. Average number of nascent mRNAs over all four replicates are reported, **P = 1.0 × 10⁻⁴, two-tailed, unpaired Student’s t test. (E) Representative flow cytometry distribution of Nanog-GFP expression in mESCs treated with DMSO or 10 μM IdU for 24 hours in 2i/LIF medium. Dashed lines represent mean. Fold change in Fano factor (±SD) obtained from three biological replicates. Inset: Representative flow cytometry dot plot showing conservative gating on forward and side scatter to filter extrinsic noise arising from cell size heterogeneity. (F) Time-lapse imaging of Nanog-GFP mESCs treated with either DMSO (n = 1513) or 10 μM IdU (n = 1414) in 2i/LIF medium. Trajectories from two replicates of each condition are pooled, with solid and dashed lines representing mean and SD of trajectories, respectively. Distributions of Nanog-GFP represent expression at the final time point. Intrinsic CV2 of each detrended trajectory was calculated, with the average (±SD) of all trajectories reported.
Fig. 3.
Fig. 3.. Noise amplification independent of mean is caused by Apex1-mediated DNA repair.
(A) Screening of 14 additional nucleoside analogs. Nanog-GFP mESCs grown in 2i/LIF medium were supplemented with a 10 μM concentration of nucleoside analog for 24 hours. Fano factor for Nanog protein expression was normalized to DMSO. Data represent mean (±SD) of biological replicates, *P < 0.01, Kruskal-Wallis test followed by Tukey’s multiple comparisons test. (B) Schematic of nucleoside analog incorporation into genomic DNA and removal through the BER pathway. (C) (Left) CRISPRi screening for genetic dependencies of IdU noise enhancement. Nanog-GFP mESCs stably expressing dCas9-KRAB-p2A-mCherry were transduced with a single gRNA expression vector with blue fluorescent protein reporter. A total of 75 gRNAs (25 genes, with three gRNAs/gene) were tested, in addition to three nontargeting control gRNAs. Two days after transduction, each gRNA-expressing population of mESCs was treated with DMSO or 10 μM IdU for 24 hours in 2i/LIF medium. The Nanog Fano factor for DMSO and IdU treatment of each gRNA population was normalized to the Nanog Fano factor for the nontargeting gRNA + DMSO population. Each point represents a gRNA. Dashed horizontal line represents average noise enhancement of Nanog from IdU in the background of nontargeting gRNA expression (black squares). Depletion of Apex1 and Tk1 diminishes noise enhancement of Nanog from IdU. (Right) Representative flow cytometry distributions of Nanog expression for mESCs expressing nontargeting (top right), Apex1 (middle right), or Tk1 (bottom right) gRNAs and treated with DMSO or 10 μM IdU. (D) Combination of IdU and small-molecule inhibitor of the Apex1 endonuclease domain (CRT0044876). (Left) Representative flow cytometry distributions of Nanog expression for mESCs treated with DMSO or 10 μM IdU + 100 μM CRT0044876. (Right) mESCs were treated with DMSO, 100 μM CRT0044876, 10 μM IdU, or 10 μM IdU + 100 μM CRT0044876 for 24 hours in 2i/LIF medium. The Nanog Fano factor for each treatment was normalized to the DMSO control. Data represent mean ± SD of three biological replicates, *P = 0.0028, two-tailed, unpaired Student’s t test. (E) Overexpression of wild-type (WT) or catalytically inactive (CI) Apex1 with simultaneous CRISPRi depletion of endogenous Apex1. (Top) Fold change in Nanog Fano factor for respective treatment condition described in the rectangular grid. An mOrange empty vector was used as a transduction control. The Nanog Fano factor for each treatment was normalized to mOrange control cells treated with DMSO. Data represent mean ± SD of three biological replicates, *P < 0.005, two-tailed, unpaired Student’s t test. (Bottom) Representative flow cytometry distributions of Nanog expression for each treatment condition. (F) Single-cell quantification of negative supercoiling levels using the psoralen–cross-linking assay. mESCs were treated with DMSO, 10 μM IdU, or 10 μM IdU + 100 μM CRT0044876 for 24 hours in 2i/LIF medium. Distributions for nuclear intensities of bTMP staining are shown. Data are pooled from two biological replicates of each treatment, **P < 0.0001, Kruskal-Wallis test followed by Tukey’s multiple comparisons test.
Fig. 4.
Fig. 4.. Mechanistic model for DiThR and the phenotypic consequence of DiThR on potentiation of cellular reprogramming.
(A) Detailed schematic of model 5 (the DiThR model) (see fig. S22 for a schematic of models 1 to 4), which uses transcription-coupled base excision. In the presence of IdU (bottom panel), Apex1 binding occurs when the gene is transcriptionally permissive (i.e., in the ON state). Binding induces negative supercoiling, which lengthens the time that a gene is transcriptionally nonproductive (i.e., in the ON* state) while also facilitating recruitment of transcriptional resources. Upon repair completion, a higher transcriptional rate that is proportional to time spent in ON* state is reached. Mean expression is maintained with larger transcriptional fluctuations. (B) Effective behavior [μ, Fano factor (FF), KOFF, fraction of time active (von), burst size (BS), KON] of the DiThR model is compared with experimentally derived values of each parameter (red dots) obtained from smRNA-FISH data. Absolute percentage error was calculated as described in supplementary text 5.2.2. Model 5 (the DiThR model) best matches experimental data. (C) Testing of 96 concentration combinations of IdU and CRT0044876 (Apex1 inh) to validate tunability of Nanog variability. IdU and CRT0044876 were used to increase binding and decrease unbinding of Apex1, respectively. Data represent the average of two biological replicates. Left and center panels are 96-well heatmaps displaying the fold change in Nanog mean and Fano factor for each drug combination compared with DMSO (top left well). An insufficient number of cells for extrinsic noise filtering (<50,000) was recorded from white wells. (Right panel) Representative flow cytometry distributions from highlighted wells (black rectangles). (D) Simulations of the DiThR model for Nanog gene expression in the presence of DMSO (top left), IdU (top right), an activator (increased KON, decreased KOFF) of promoter activity (bottom left), and an activator combined with IdU (bottom right). (E) Alkaline phosphatase staining for pluripotent stem cell colonies. Nanog-GFP secondary MEFs harboring stably integrated, doxycycline-inducible cassettes for Oct4, Sox2, and Klf4 (OSK) were subjected to 10 days of doxycycline treatment in combination with DMSO (first well), 1 μM IdU (second well), or 4 μM IdU (third well) for the first 48 hours of reprogramming. (F) (Top) Micrographs of Nanog-GFP secondary MEFs at day 10 of doxycycline-induced reprogramming. Scale bar, 100 μm. (Bottom) Flow cytometric analysis of Nanog-GFP activation at day 10 of reprogramming. Data are pooled from two replicates. (G) Fold change in percentage of Oct4-GFP+ cells at day 10 of reprogramming between IdU and DMSO treatment conditions with and without Apex1 depletion; 4 μM IdU or an equivalent volume DMSO was present for first 48 hours of reprogramming. Data represent mean ± SD of three biological replicates, **P = 0.0014, ***P < 0.001, two-tailed, unpaired Student’s t test.

Comment in

Similar articles

Cited by

References

    1. Boltzmann L, Weitere Studien uber das Wärmegleichgewicht unter Gasmolekulen, Sitzungsber. Kais. Akad. Wiss. Wien Math. Naturwiss 66, 275–370 (1872).
    1. Arrhenius S, Über die Reaktionsgeschwindigkeit bei der Inversion von Rohrzucker durch Säuren. Z. Phys. Chem 4, 226–248 (1889). doi: 10.1515/zpch-1889-0416 - DOI
    1. Roberts L, Picture coding using pseudo-random noise. IEEE Trans. Inf. Theory 8, 145–154 (1962). doi: 10.1109/TIT.1962.1057702 - DOI
    1. Fatt P, Katz B, Some observations on biological noise. Nature 166, 597–598 (1950). doi: 10.1038/166597a0; - DOI - PubMed
    1. Priplata AA, Niemi JB, Harry JD, Lipsitz LA, Collins JJ, Vibrating insoles and balance control in elderly people. Lancet 362, 1123–1124 (2003). doi: 10.1016/S0140-6736(03)14470-4; - DOI - PubMed

Publication types

MeSH terms